| Param | Original file | Final file |
|---|---|---|
| Filename | modeM0/AS1C09_011T08_9000006492_53287cztM0_level2.fits | modeM0/AS1C09_011T08_9000006492_53287cztM0_level2_quad_clean.evt |
| Size (bytes) | 832,893,120 | 90,048,960 |
| Size | 794.3 MB | 85.9 MB |
| Events in quadrant A | 4,737,231 | 679,720 |
| Events in quadrant B | 4,131,134 | 741,403 |
| Events in quadrant C | 16,898,282 | 185,611 |
| Events in quadrant D | 4,483,878 | 599,348 |
| Mode M0 | |||
|---|---|---|---|
| Quadrant | BADHDUFLAG | Total packets | Discarded packets |
| A | 0 | 19634 | 0 |
| B | 0 | 17598 | 0 |
| C | 0 | 55229 | 3 |
| D | 0 | 18903 | 0 |
| Mode SS | |||
|---|---|---|---|
| Quadrant | BADHDUFLAG | Total packets | Discarded packets |
| A | 0 | 148 | 0 |
| B | 0 | 148 | 0 |
| C | 0 | 148 | 0 |
| D | 0 | 148 | 0 |
| Quadrant | Total seconds | Saturated seconds | Saturation percentage |
|---|---|---|---|
| A | 7481 | 159 | 2.125384% |
| B | 7482 | 123 | 1.643945% |
| C | 7481 | 5552 | 74.214677% |
| D | 7481 | 377 | 5.039433% |
Noise dominated data is calculated using 1-second bins in cleaned event files. If a bin has >2000 counts, and if more than 50% of those come from <1% of pixels, then it is considered to be noise-dominated and hence unusable.
| Quadrant | # 1 sec bins | Bins with >0 counts | Bins with >2000 counts | High rate bins dominated by noise | Noise dominated (total time) | Noise dominated (detector-on time) | Marked lightcurve |
|---|---|---|---|---|---|---|---|
| A | 7481 | 7481 | 168 | 168 | 2.25% | 2.25% |  |
| B | 7482 | 7482 | 73 | 73 | 0.98% | 0.98% | 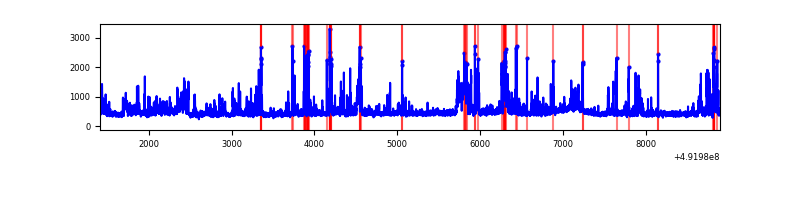 |
| C | 7481 | 7481 | 5579 | 5579 | 74.58% | 74.58% | 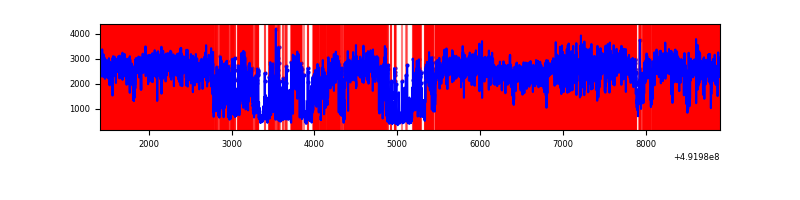 |
| D | 7481 | 7481 | 261 | 261 | 3.49% | 3.49% | 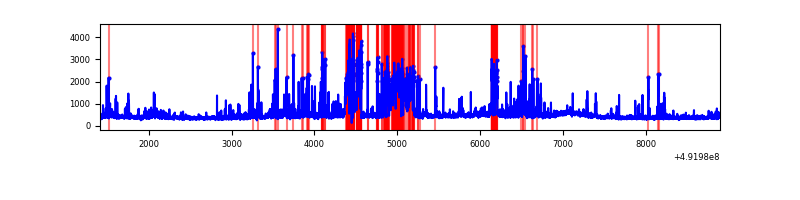 |
Top three noisy pixels from each quadrant. If the there are fewer than three noisy pixels in the level2.evt file, extra rows are filled as -1
| Pixel properties | Quadrant properties | ||||||
|---|---|---|---|---|---|---|---|
| Quadrant | DetID | PixID | Counts | Sigma | Mean | Median | Sigma |
| A | 3 | 62 | 671919 | 3567.05 | 760 | 742 | 188.2 |
| A | 4 | 5 | 526157 | 2792.38 | 760 | 742 | 188.2 |
| A | 4 | 159 | 153728 | 813.06 | 760 | 742 | 188.2 |
| B | 10 | 28 | 346934 | 2108.71 | 761 | 734 | 164.2 |
| B | 4 | 81 | 327960 | 1993.14 | 761 | 734 | 164.2 |
| B | 8 | 234 | 119290 | 722.13 | 761 | 734 | 164.2 |
| C | 1 | 241 | 10183492 | 83345.48 | 440 | 435 | 122.2 |
| C | 15 | 178 | 2122593 | 17369.27 | 440 | 435 | 122.2 |
| C | 15 | 224 | 1401742 | 11469.31 | 440 | 435 | 122.2 |
| D | 2 | 62 | 635831 | 3094.83 | 724 | 692 | 205.2 |
| D | 3 | 12 | 436702 | 2124.54 | 724 | 692 | 205.2 |
| D | 2 | 249 | 101600 | 491.69 | 724 | 692 | 205.2 |
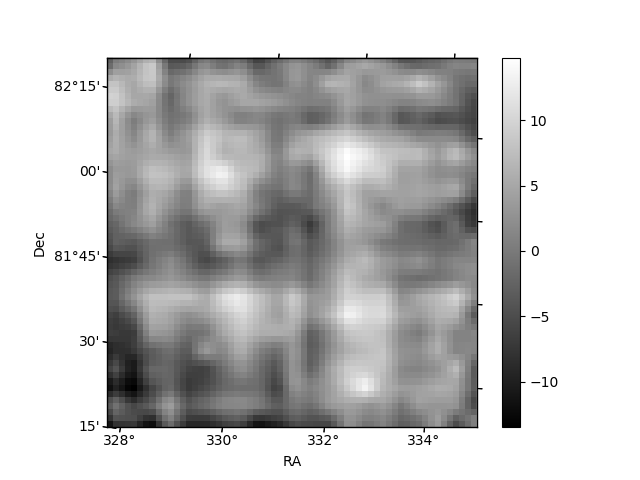
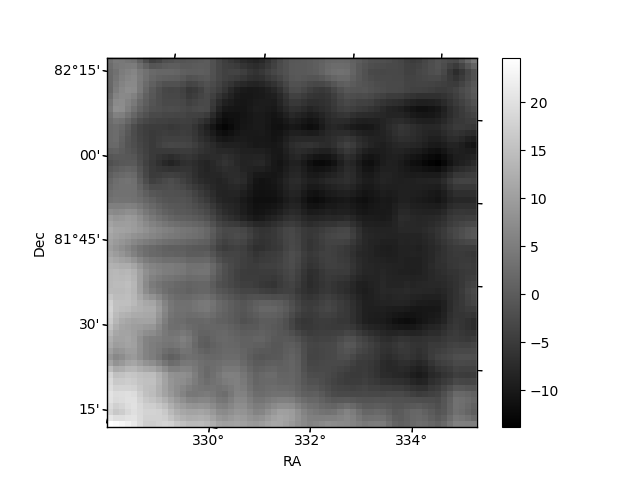
Histogram calculated using DETX and DETY for each event in the final _common_clean file
| Quadrant A | 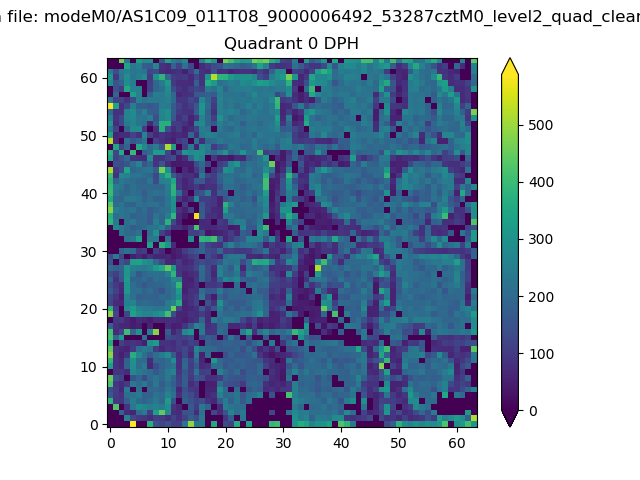 |
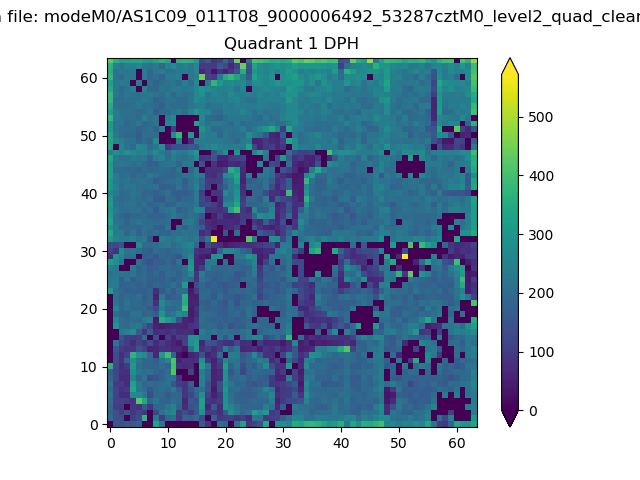 |
Quadrant B |
|---|---|---|---|
| Quadrant D | 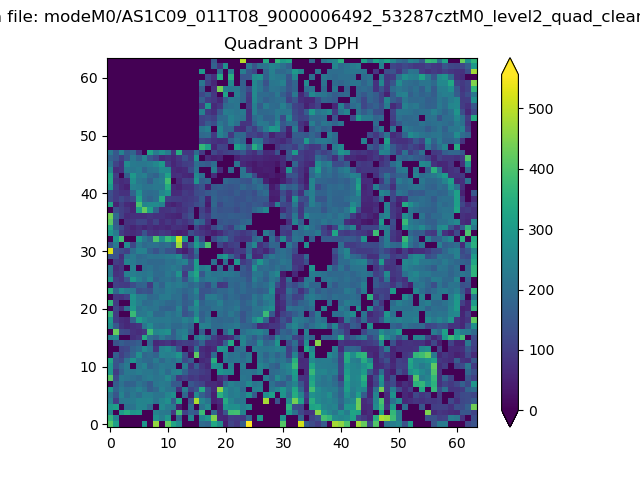 |
 |
Quadrant C |
| Plot type | Count rate plots | Images |
|---|---|---|
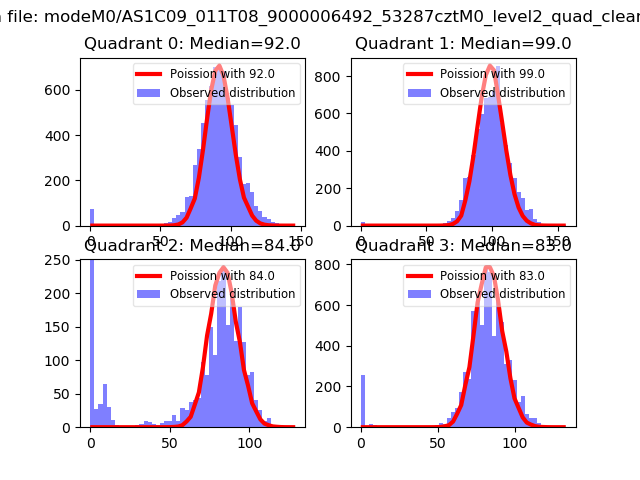
| Comparison with Poisson distribution Blue bars denote a histogram of data divided into 1 sec bins. Red curve is a Poisson curve with rate = median count rate of data. |
 |
 |
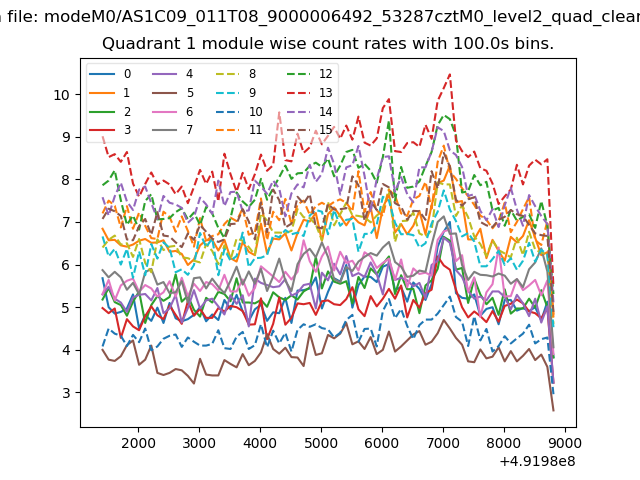
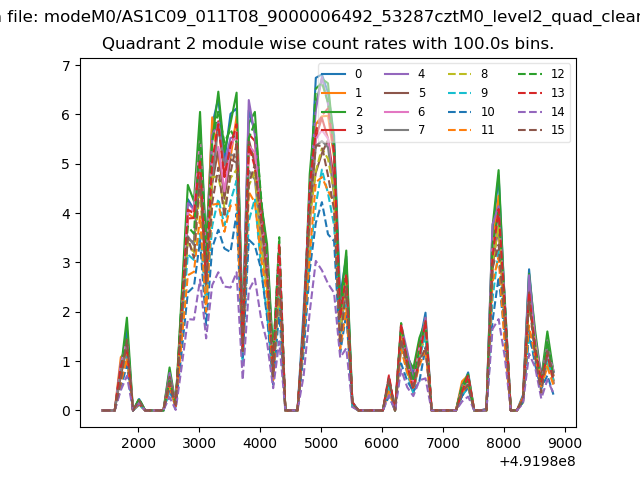
| Quadrant-wise count rates Data is divided into 100 sec bins |
 |
|
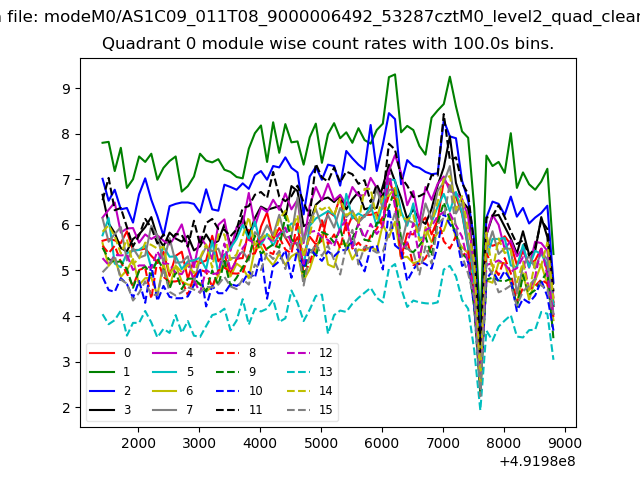
| Module-wise count rates for Quadrant A Data is divided into 100 sec bins |
 |
 |
| Module-wise count rates for Quadrant B Data is divided into 100 sec bins |
 |
 |
| Module-wise count rates for Quadrant C Data is divided into 100 sec bins |
 |
 |
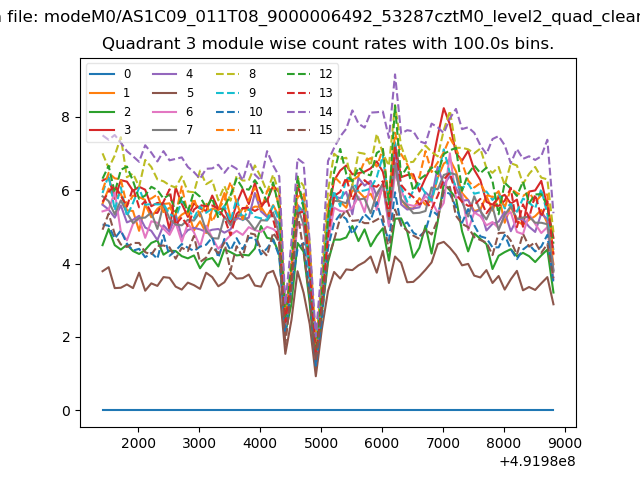
| Module-wise count rates for Quadrant D Data is divided into 100 sec bins |
 |
 |
| Parameter | Plot |
|---|---|
| CZT HV Monitor | 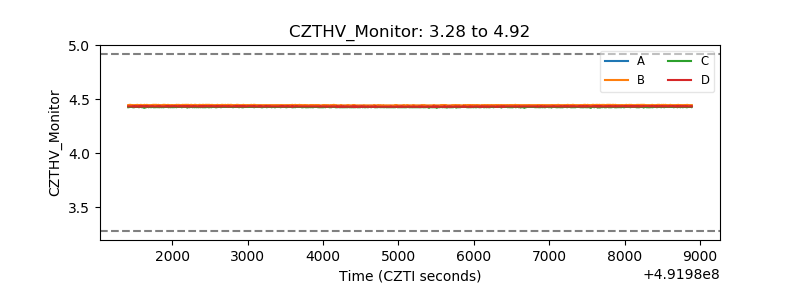 |
| D_VDD | 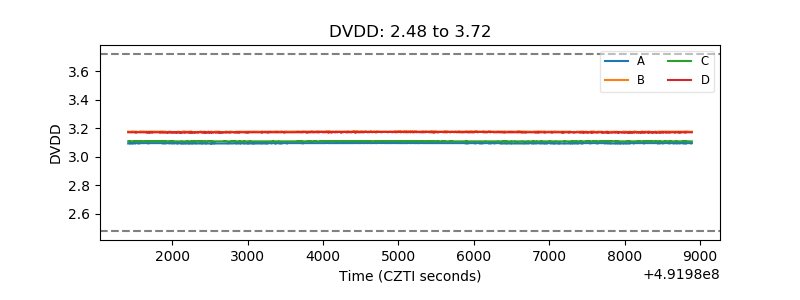 |
| Temperature 1 | 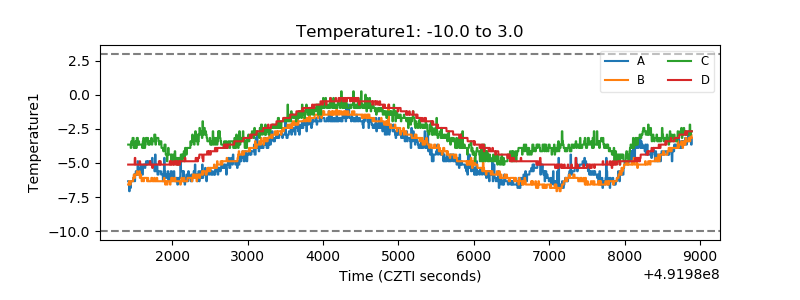 |
| Veto HV Monitor | 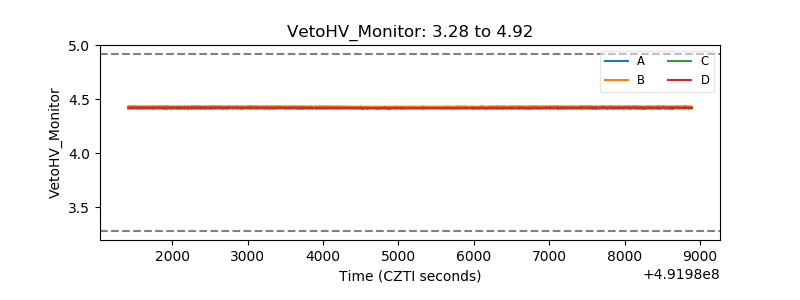 |
| Veto LLD | 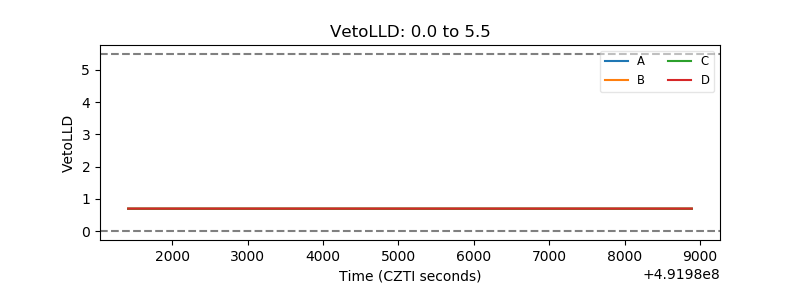 |
| Alpha Counter |  |
| _CPM_Rate | 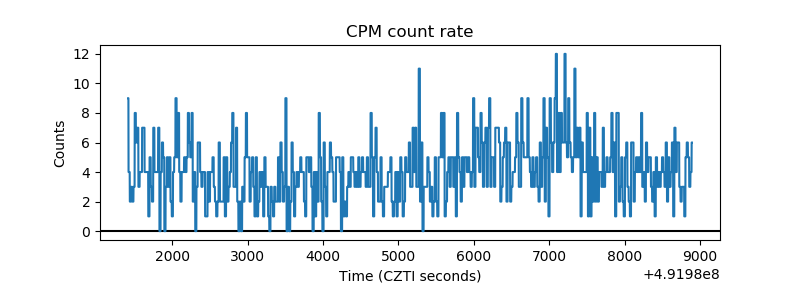 |
| CZT Counter | 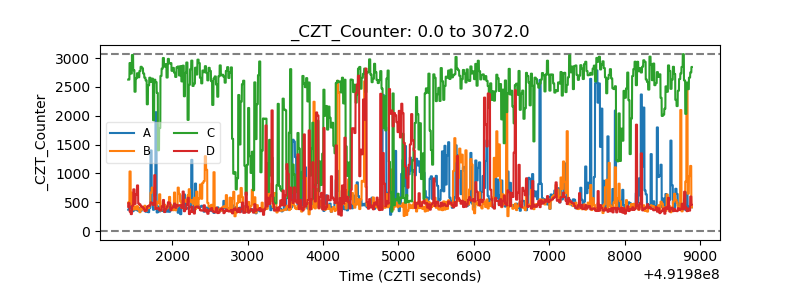 |
| +2.5 Volts monitor | 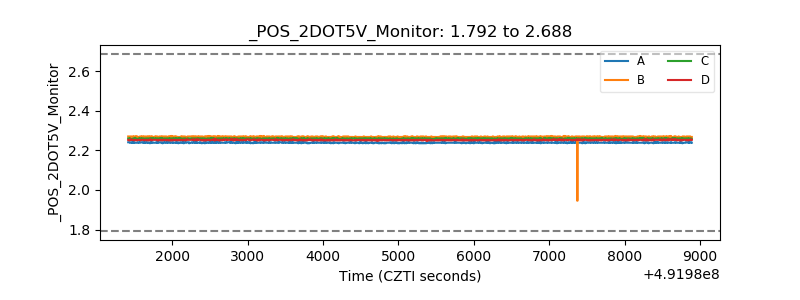 |
| +5 Volts monitor |  |
| _ROLL_ROT | 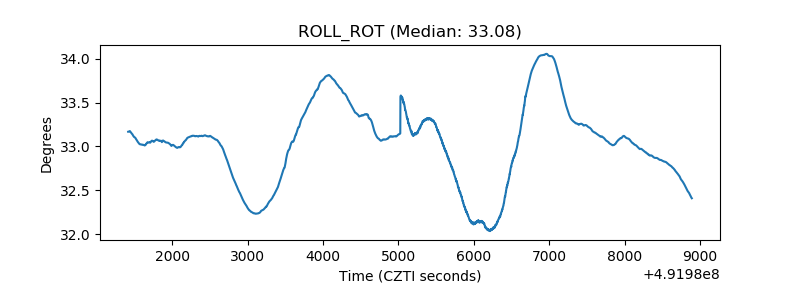 |
| _Roll_DEC | 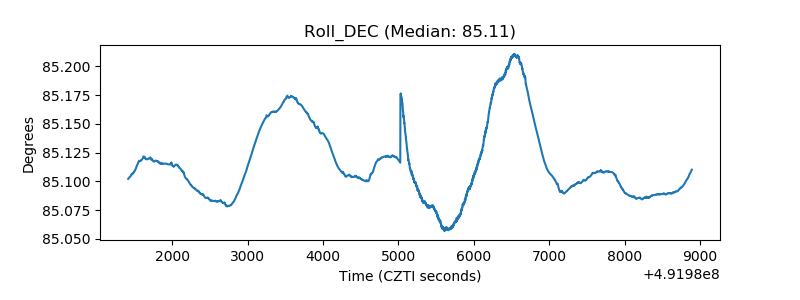 |
| _Roll_RA |  |
| Veto Counter | 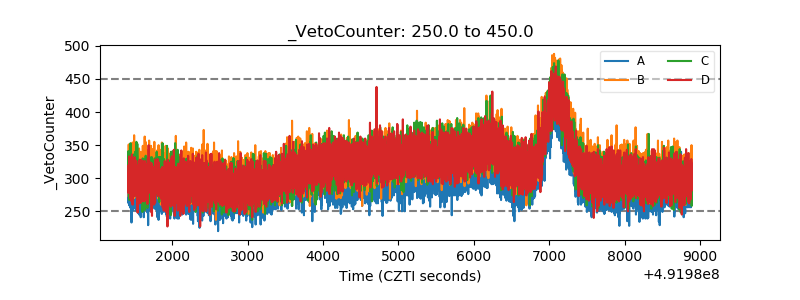 |