| Param | Original file | Final file |
|---|---|---|
| Filename | modeM0/AS1C09_011T08_9000006492_53291cztM0_level2.fits | modeM0/AS1C09_011T08_9000006492_53291cztM0_level2_quad_clean.evt |
| Size (bytes) | 783,872,640 | 78,108,480 |
| Size | 747.6 MB | 74.5 MB |
| Events in quadrant A | 3,450,786 | 615,031 |
| Events in quadrant B | 4,490,221 | 642,522 |
| Events in quadrant C | 14,913,304 | 159,940 |
| Events in quadrant D | 5,658,105 | 494,035 |
| Mode M0 | |||
|---|---|---|---|
| Quadrant | BADHDUFLAG | Total packets | Discarded packets |
| A | 0 | 14938 | 1 |
| B | 0 | 17727 | 1 |
| C | 0 | 48600 | 1 |
| D | 0 | 21103 | 1 |
| Mode M9 | |||
|---|---|---|---|
| Quadrant | BADHDUFLAG | Total packets | Discarded packets |
| A | 0 | 8 | 0 |
| B | 0 | 8 | 0 |
| C | 0 | 8 | 0 |
| D | 0 | 8 | 0 |
| Mode SS | |||
|---|---|---|---|
| Quadrant | BADHDUFLAG | Total packets | Discarded packets |
| A | 0 | 132 | 0 |
| B | 0 | 132 | 0 |
| C | 0 | 132 | 0 |
| D | 0 | 132 | 0 |
| Quadrant | Total seconds | Saturated seconds | Saturation percentage |
|---|---|---|---|
| A | 6496 | 151 | 2.324507% |
| B | 6497 | 321 | 4.940742% |
| C | 6497 | 4890 | 75.265507% |
| D | 6497 | 870 | 13.390796% |
Noise dominated data is calculated using 1-second bins in cleaned event files. If a bin has >2000 counts, and if more than 50% of those come from <1% of pixels, then it is considered to be noise-dominated and hence unusable.
| Quadrant | # 1 sec bins | Bins with >0 counts | Bins with >2000 counts | High rate bins dominated by noise | Noise dominated (total time) | Noise dominated (detector-on time) | Marked lightcurve |
|---|---|---|---|---|---|---|---|
| A | 7286 | 6497 | 78 | 78 | 1.07% | 1.20% | 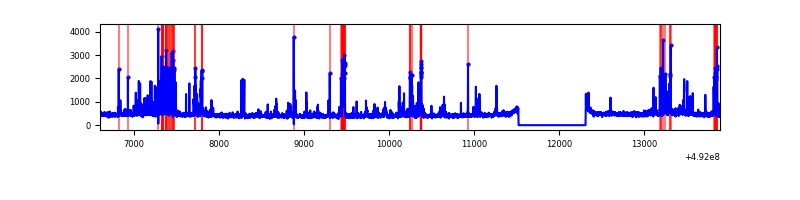 |
| B | 7287 | 6498 | 176 | 176 | 2.42% | 2.71% | 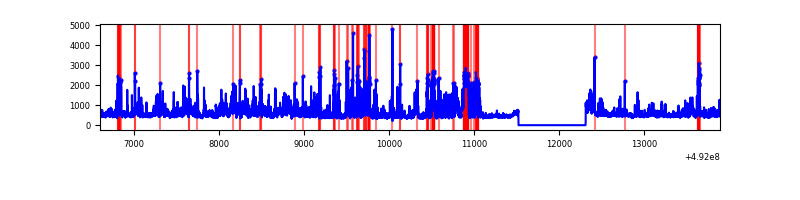 |
| C | 7287 | 6498 | 4708 | 4708 | 64.61% | 72.45% | 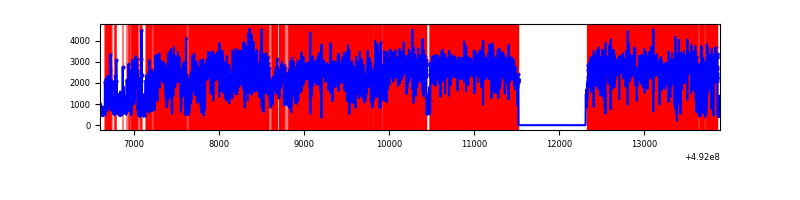 |
| D | 7287 | 6498 | 813 | 813 | 11.16% | 12.51% | 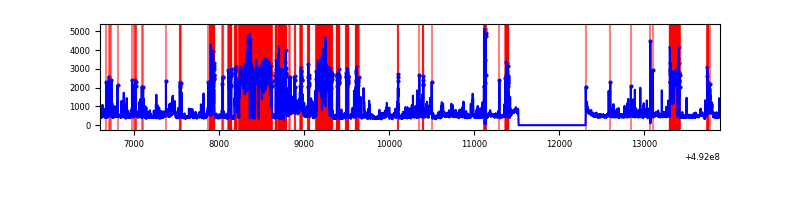 |
Top three noisy pixels from each quadrant. If the there are fewer than three noisy pixels in the level2.evt file, extra rows are filled as -1
| Pixel properties | Quadrant properties | ||||||
|---|---|---|---|---|---|---|---|
| Quadrant | DetID | PixID | Counts | Sigma | Mean | Median | Sigma |
| A | 4 | 249 | 181468 | 1056.46 | 688 | 671 | 171.1 |
| A | 5 | 240 | 137400 | 798.96 | 688 | 671 | 171.1 |
| A | 15 | 174 | 117935 | 685.22 | 688 | 671 | 171.1 |
| B | 10 | 28 | 616266 | 4266.78 | 674 | 650 | 144.3 |
| B | 4 | 81 | 277752 | 1920.57 | 674 | 650 | 144.3 |
| B | 8 | 234 | 269632 | 1864.29 | 674 | 650 | 144.3 |
| C | 1 | 241 | 11325735 | 109944.88 | 368 | 364 | 103.0 |
| C | 15 | 224 | 1325438 | 12863.6 | 368 | 364 | 103.0 |
| C | 1 | 240 | 362309 | 3513.7 | 368 | 364 | 103.0 |
| D | 11 | 176 | 2527574 | 14202.69 | 631 | 603 | 177.9 |
| D | 3 | 12 | 111737 | 624.62 | 631 | 603 | 177.9 |
| D | 5 | 70 | 90621 | 505.94 | 631 | 603 | 177.9 |
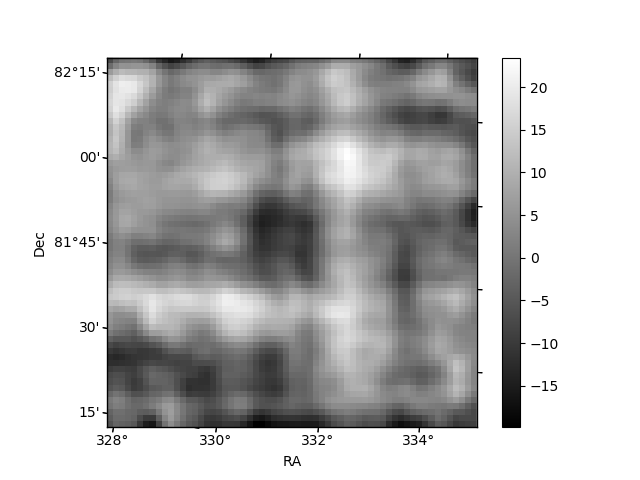
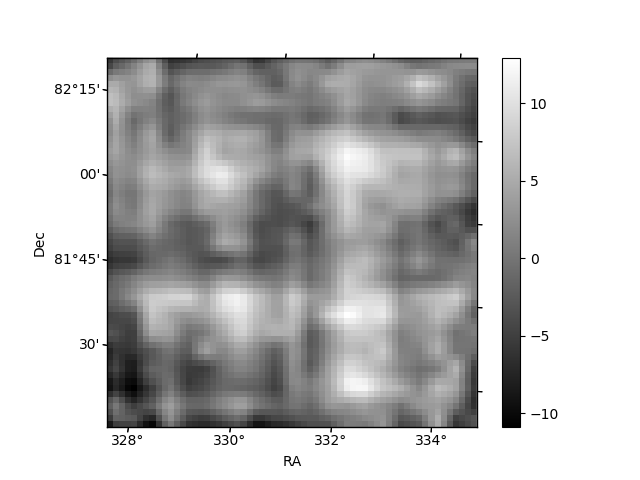
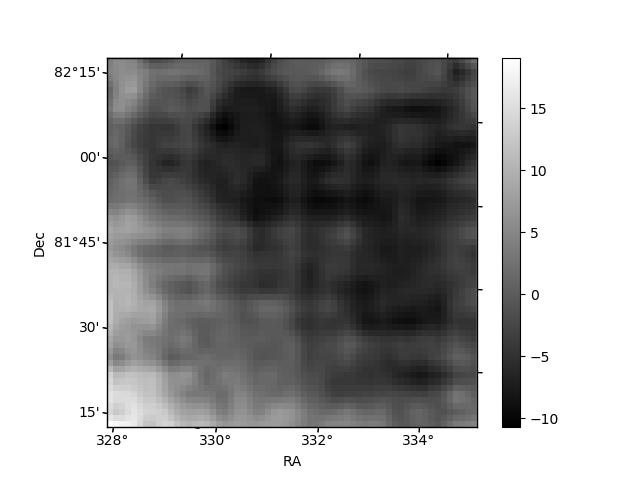
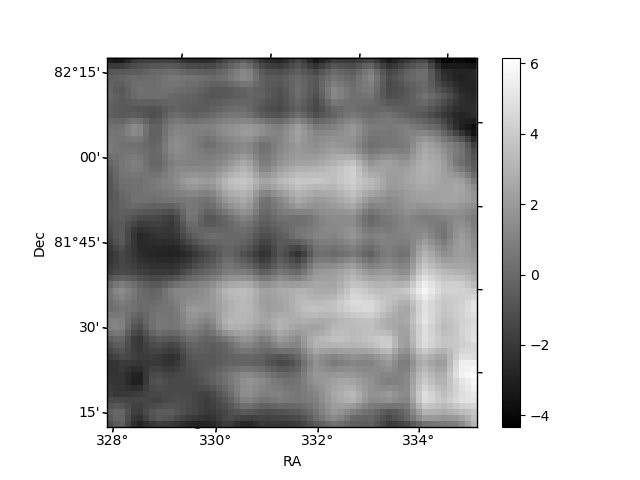
Histogram calculated using DETX and DETY for each event in the final _common_clean file
| Quadrant A | 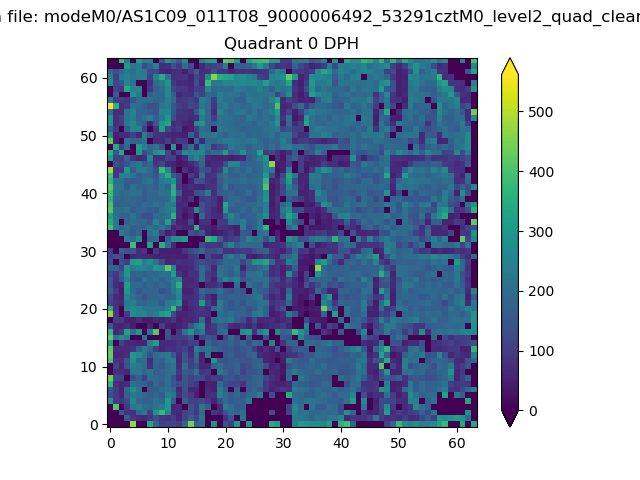 |
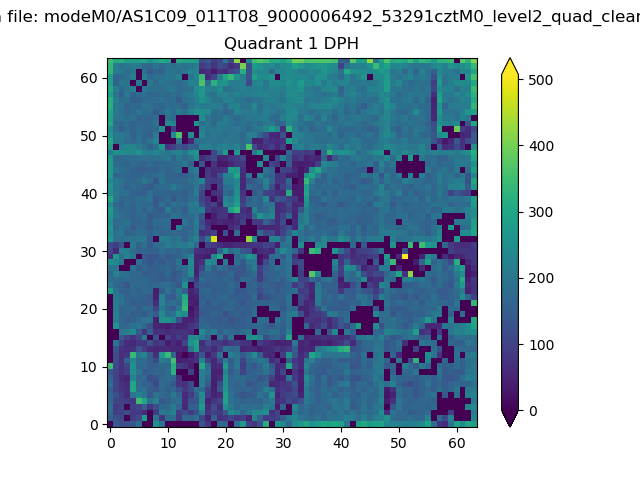 |
Quadrant B |
|---|---|---|---|
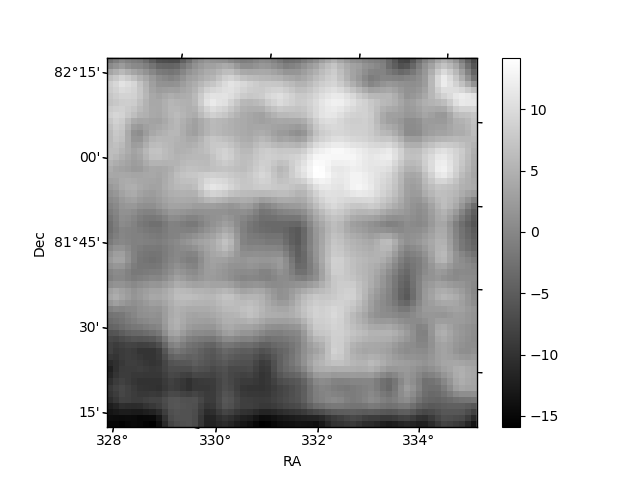
| Quadrant D |  |
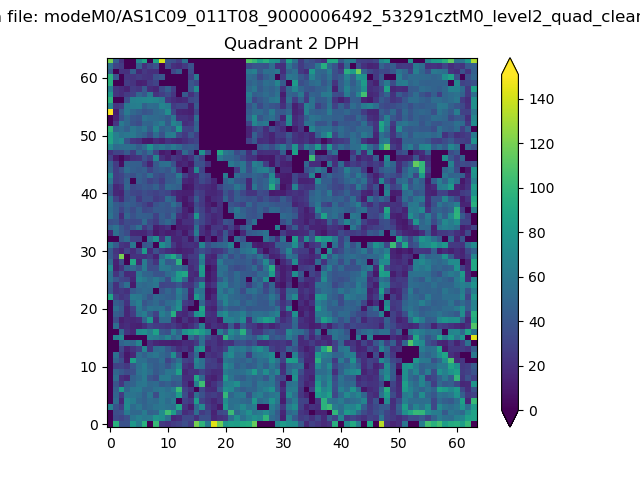 |
Quadrant C |
| Plot type | Count rate plots | Images |
|---|---|---|
| Comparison with Poisson distribution Blue bars denote a histogram of data divided into 1 sec bins. Red curve is a Poisson curve with rate = median count rate of data. |
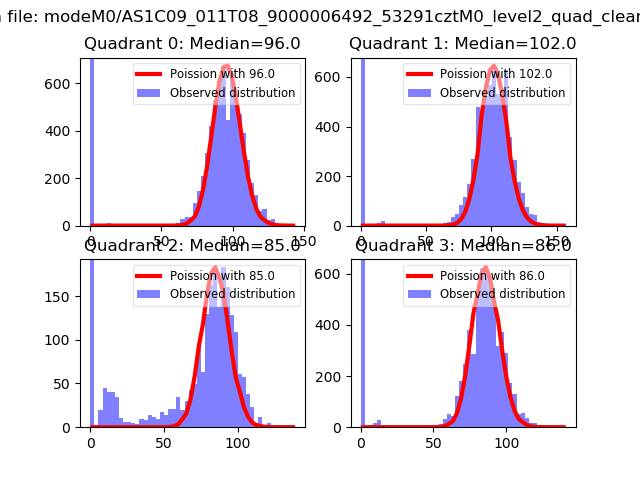 |
 |
| Quadrant-wise count rates Data is divided into 100 sec bins |
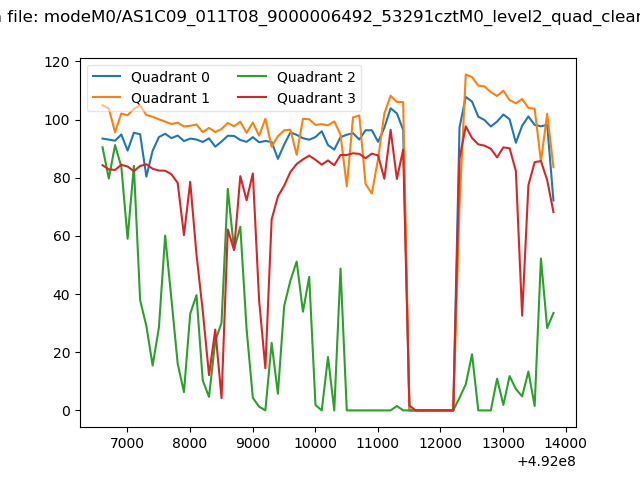 |
|
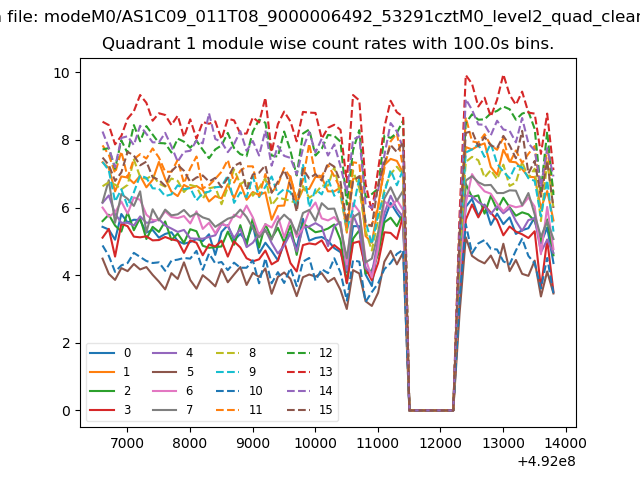
| Module-wise count rates for Quadrant A Data is divided into 100 sec bins |
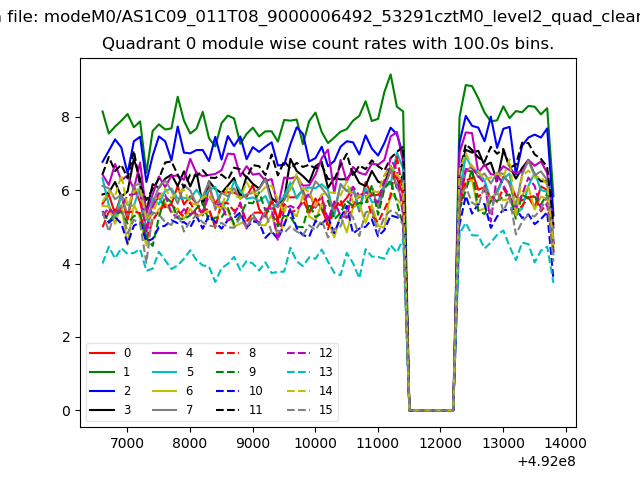 |
 |
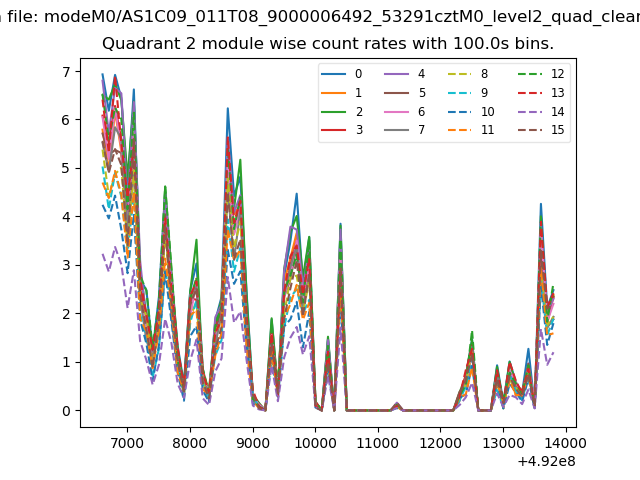
| Module-wise count rates for Quadrant B Data is divided into 100 sec bins |
 |
 |
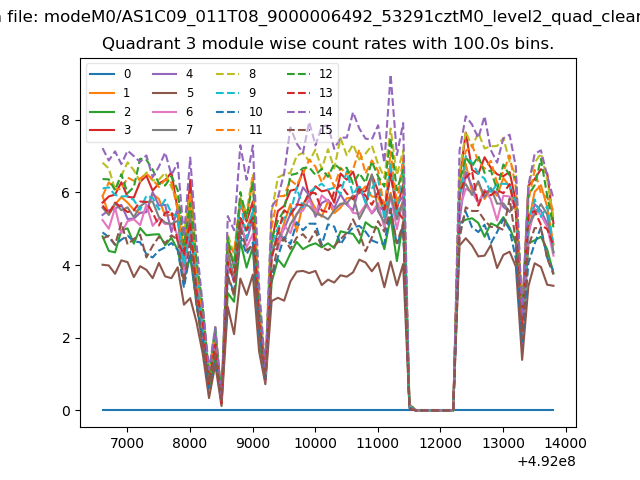
| Module-wise count rates for Quadrant C Data is divided into 100 sec bins |
 |
 |
| Module-wise count rates for Quadrant D Data is divided into 100 sec bins |
 |
 |
| Parameter | Plot |
|---|---|
| CZT HV Monitor | 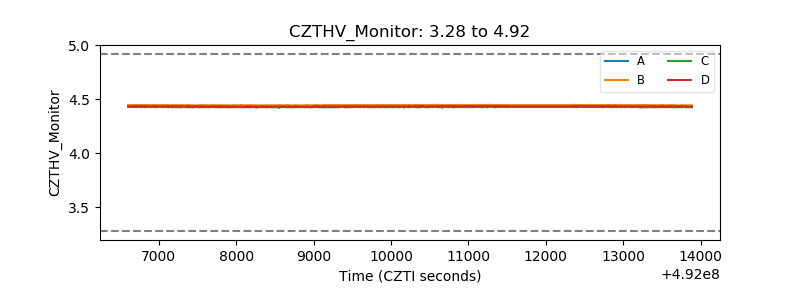 |
| D_VDD | 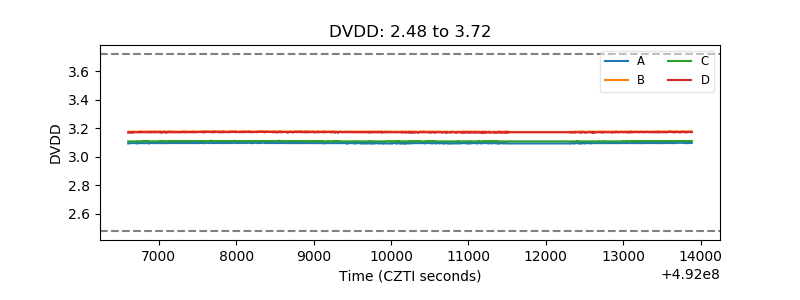 |
| Temperature 1 | 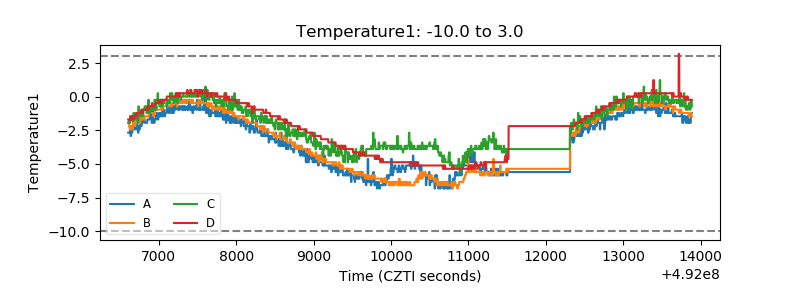 |
| Veto HV Monitor | 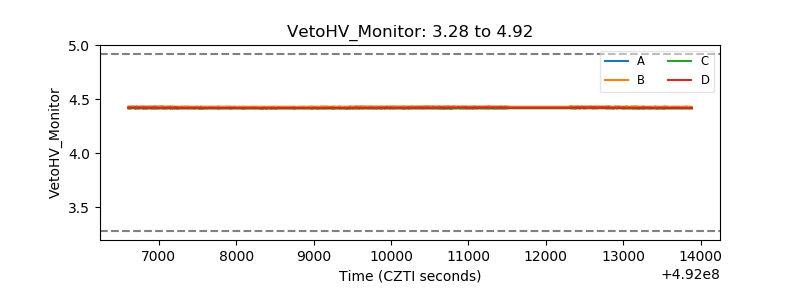 |
| Veto LLD | 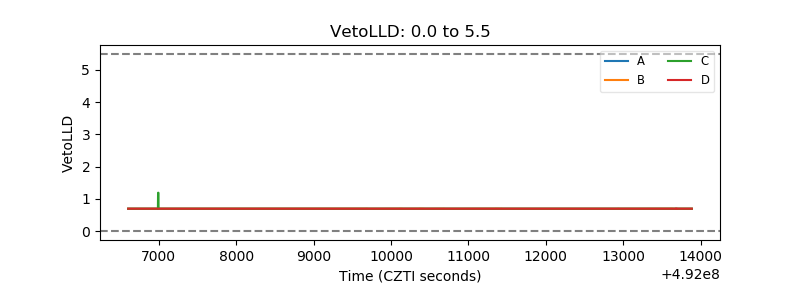 |
| Alpha Counter | 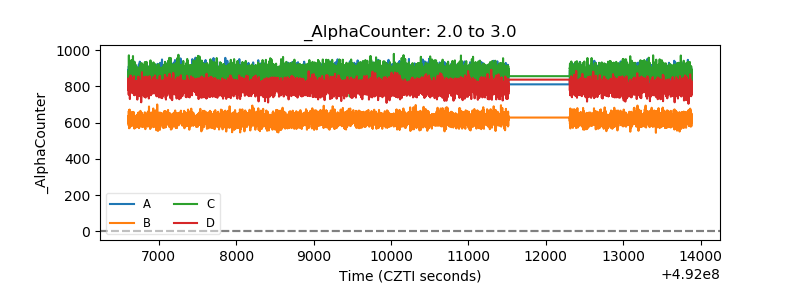 |
| _CPM_Rate | 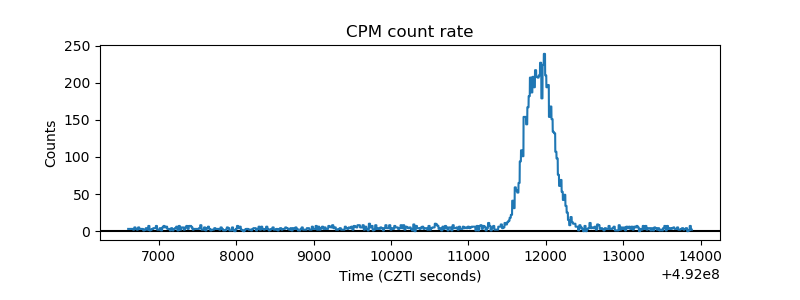 |
| CZT Counter | 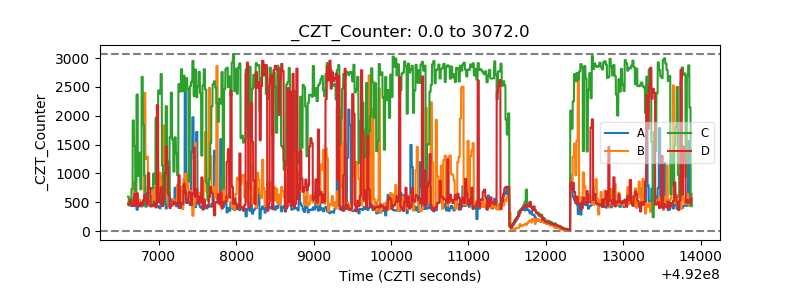 |
| +2.5 Volts monitor |  |
| +5 Volts monitor |  |
| _ROLL_ROT | 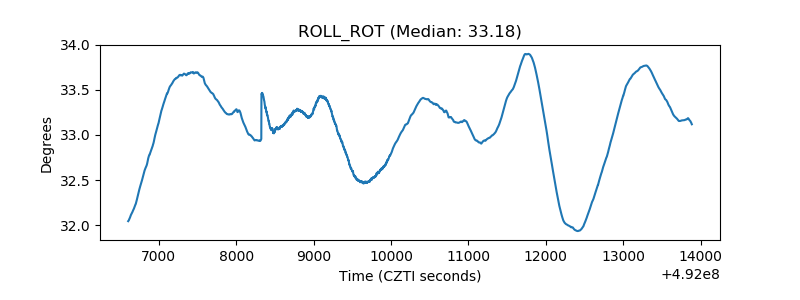 |
| _Roll_DEC | 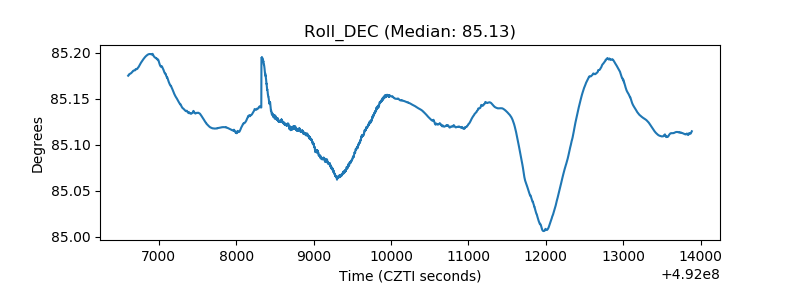 |
| _Roll_RA | 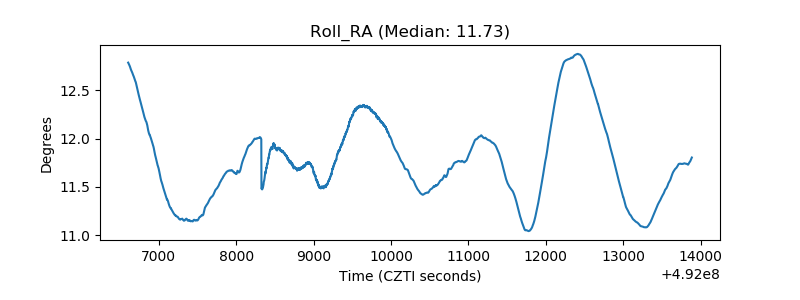 |
| Veto Counter | 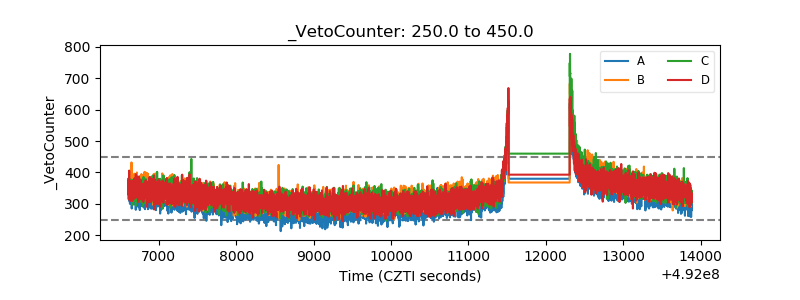 |