| Param | Original file | Final file |
|---|---|---|
| Filename | modeM0/AS1C09_011T08_9000006492_53293cztM0_level2.fits | modeM0/AS1C09_011T08_9000006492_53293cztM0_level2_quad_clean.evt |
| Size (bytes) | 19,183,680 | 2,759,040 |
| Size | 18.3 MB | 2.6 MB |
| Events in quadrant A | 159,631 | 19,320 |
| Events in quadrant B | 120,238 | 19,955 |
| Events in quadrant C | 254,170 | 4,542 |
| Events in quadrant D | 154,635 | 15,584 |
| Mode M0 | |||
|---|---|---|---|
| Quadrant | BADHDUFLAG | Total packets | Discarded packets |
| A | 0 | 1632 | 985 |
| B | 0 | 1631 | 1128 |
| C | 0 | 2877 | 2009 |
| D | 0 | 1751 | 1134 |
| Mode SS | |||
|---|---|---|---|
| Quadrant | BADHDUFLAG | Total packets | Discarded packets |
| A | 0 | 13 | 7 |
| B | 0 | 13 | 7 |
| C | 0 | 12 | 10 |
| D | 0 | 13 | 5 |
| Quadrant | Total seconds | Saturated seconds | Saturation percentage |
|---|---|---|---|
| A | 259 | 12 | 4.633205% |
| B | 242 | 0 | 0.000000% |
| C | 167 | 38 | 22.754491% |
| D | 245 | 2 | 0.816327% |
Noise dominated data is calculated using 1-second bins in cleaned event files. If a bin has >2000 counts, and if more than 50% of those come from <1% of pixels, then it is considered to be noise-dominated and hence unusable.
| Quadrant | # 1 sec bins | Bins with >0 counts | Bins with >2000 counts | High rate bins dominated by noise | Noise dominated (total time) | Noise dominated (detector-on time) | Marked lightcurve |
|---|---|---|---|---|---|---|---|
| A | 558 | 330 | 8 | 8 | 1.43% | 2.42% | 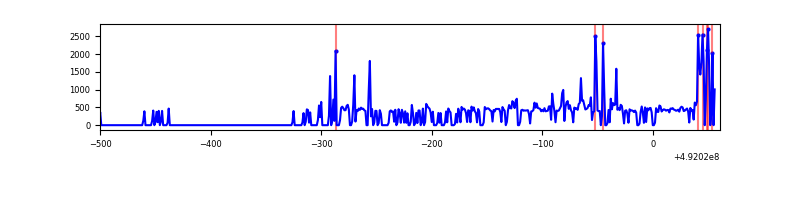 |
| B | 380 | 305 | 0 | 0 | 0.00% | 0.00% | 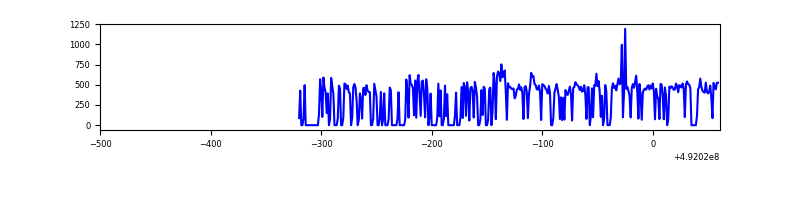 |
| C | 486 | 229 | 22 | 22 | 4.53% | 9.61% | 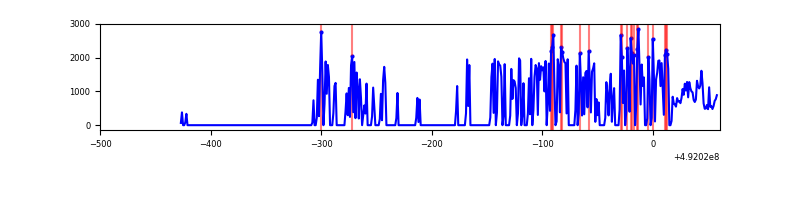 |
| D | 499 | 312 | 2 | 2 | 0.40% | 0.64% | 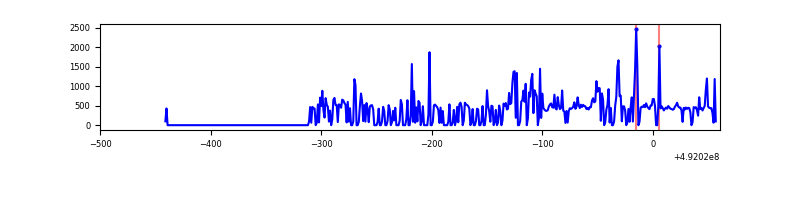 |
Top three noisy pixels from each quadrant. If the there are fewer than three noisy pixels in the level2.evt file, extra rows are filled as -1
| Pixel properties | Quadrant properties | ||||||
|---|---|---|---|---|---|---|---|
| Quadrant | DetID | PixID | Counts | Sigma | Mean | Median | Sigma |
| A | 3 | 62 | 40536 | 4695.97 | 27 | 26 | 8.6 |
| A | 12 | 115 | 5901 | 681.04 | 27 | 26 | 8.6 |
| A | 7 | 160 | 1255 | 142.47 | 27 | 26 | 8.6 |
| B | 10 | 28 | 8166 | 1070.12 | 25 | 24 | 7.6 |
| B | 10 | 254 | 4513 | 590.0 | 25 | 24 | 7.6 |
| B | 10 | 247 | 2551 | 332.13 | 25 | 24 | 7.6 |
| C | 4 | 5 | 95500 | 15982.17 | 16 | 16 | 6.0 |
| C | 15 | 178 | 61074 | 10219.92 | 16 | 16 | 6.0 |
| C | 0 | 177 | 12340 | 2062.8 | 16 | 16 | 6.0 |
| D | 11 | 176 | 34856 | 3859.2 | 25 | 24 | 9.0 |
| D | 3 | 12 | 8565 | 946.3 | 25 | 24 | 9.0 |
| D | 6 | 242 | 2420 | 265.46 | 25 | 24 | 9.0 |
Histogram calculated using DETX and DETY for each event in the final _common_clean file
| Quadrant A | 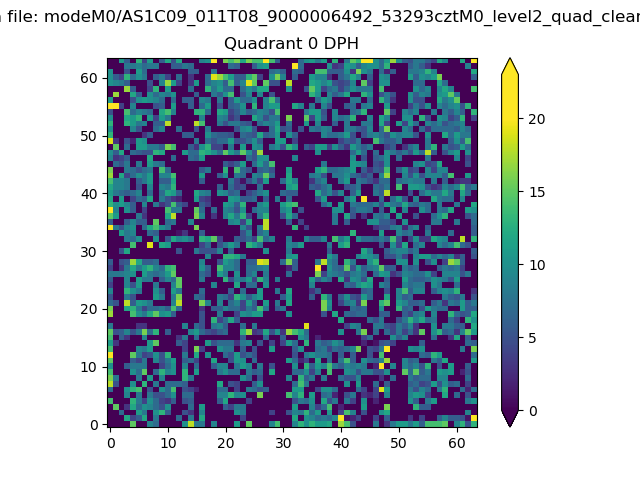 |
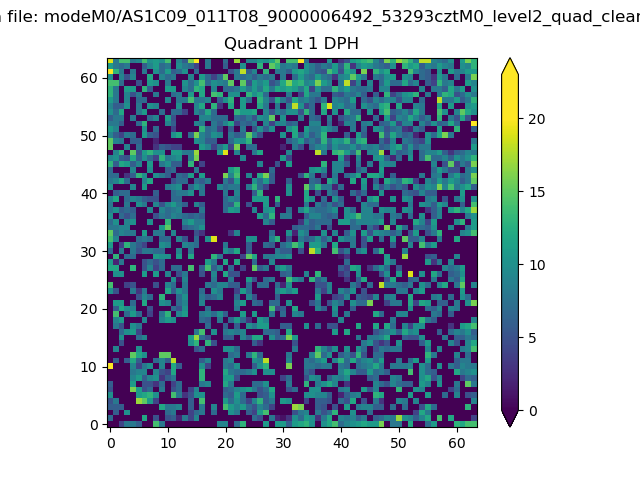 |
Quadrant B |
|---|---|---|---|
| Quadrant D |  |
 |
Quadrant C |
| Plot type | Count rate plots | Images |
|---|---|---|
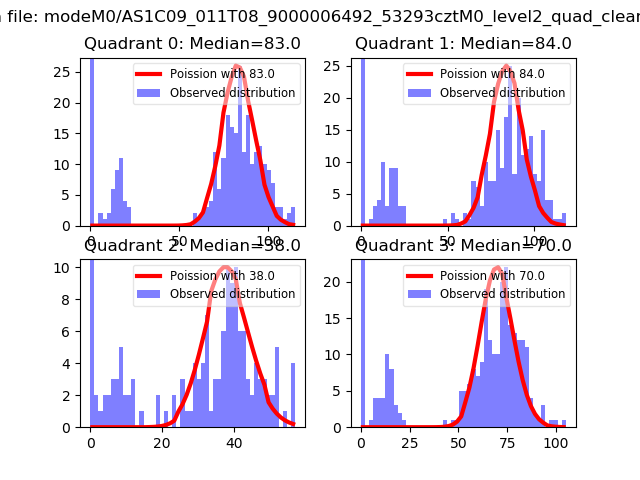
| Comparison with Poisson distribution Blue bars denote a histogram of data divided into 1 sec bins. Red curve is a Poisson curve with rate = median count rate of data. |
 |
 |
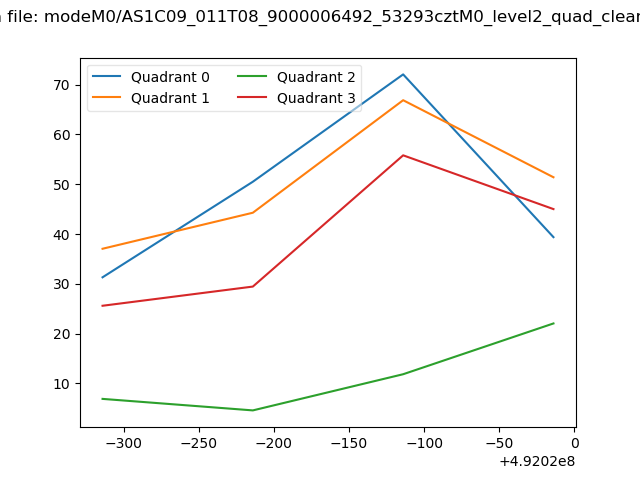
| Quadrant-wise count rates Data is divided into 100 sec bins |
 |
|
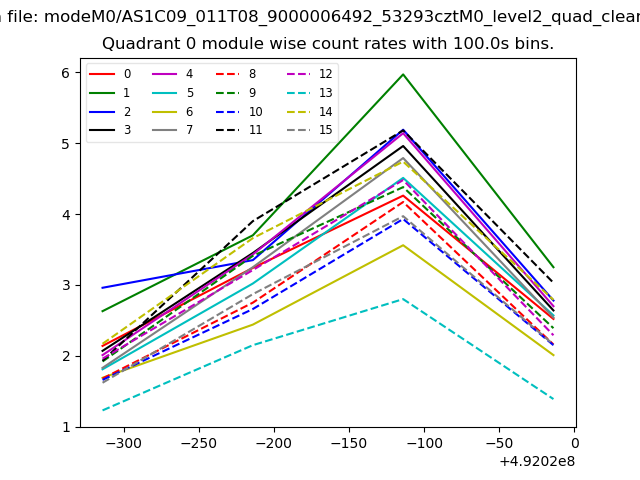
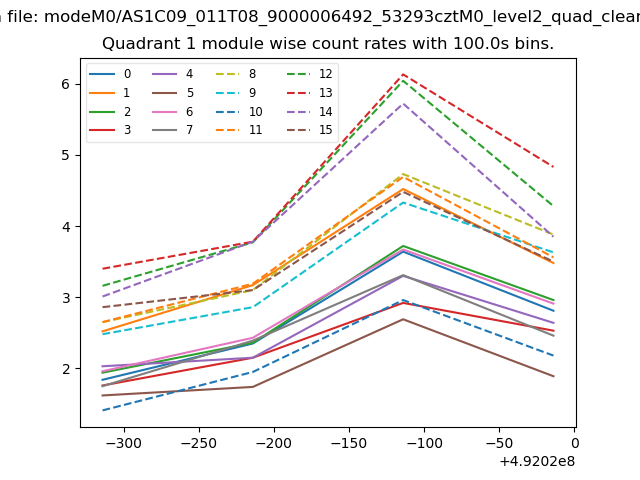
| Module-wise count rates for Quadrant A Data is divided into 100 sec bins |
 |
 |
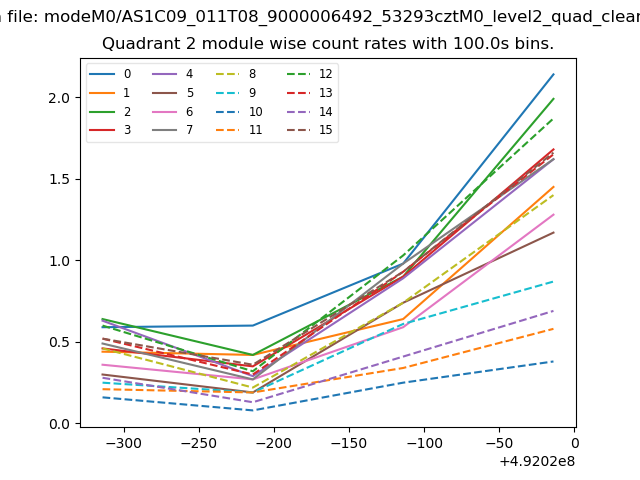
| Module-wise count rates for Quadrant B Data is divided into 100 sec bins |
 |
 |
| Module-wise count rates for Quadrant C Data is divided into 100 sec bins |
 |
 |
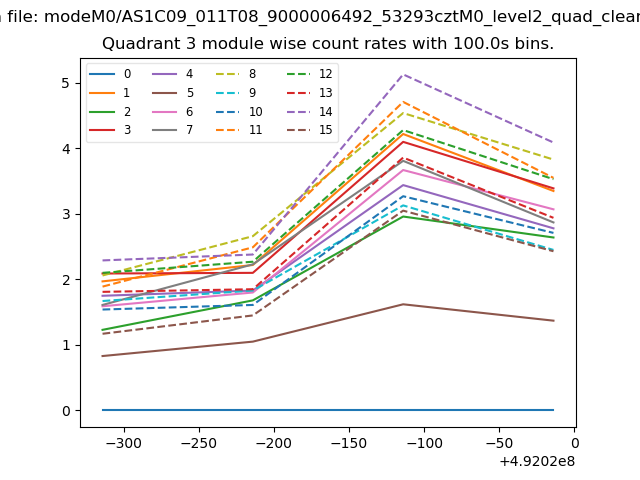
| Module-wise count rates for Quadrant D Data is divided into 100 sec bins |
 |
 |
| Parameter | Plot |
|---|---|
| CZT HV Monitor | 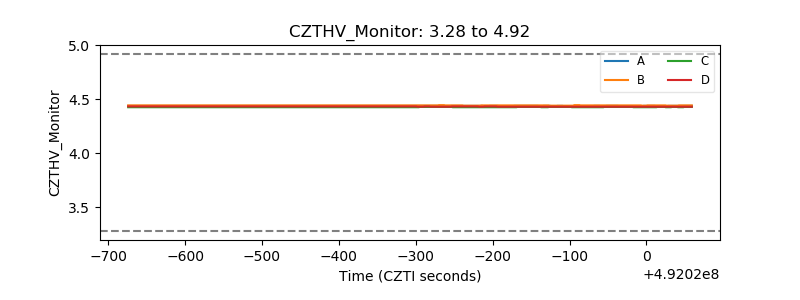 |
| D_VDD | 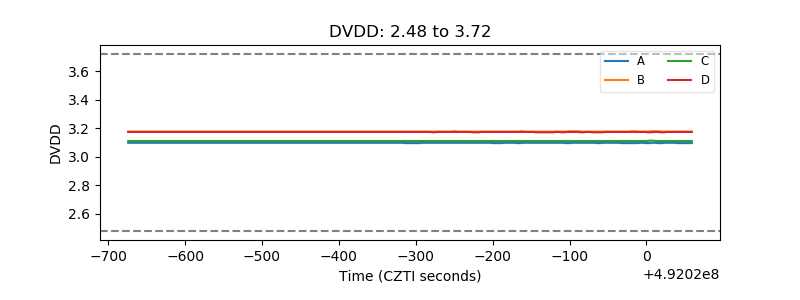 |
| Temperature 1 | 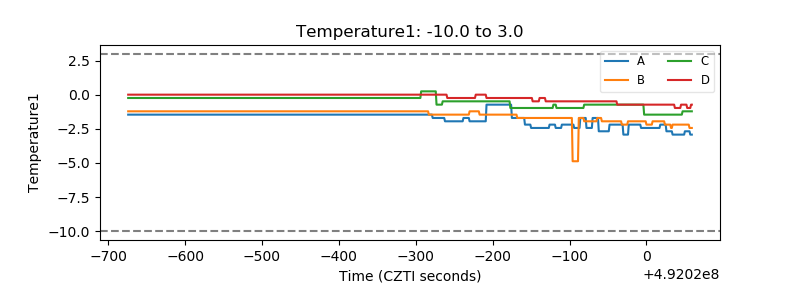 |
| Veto HV Monitor | 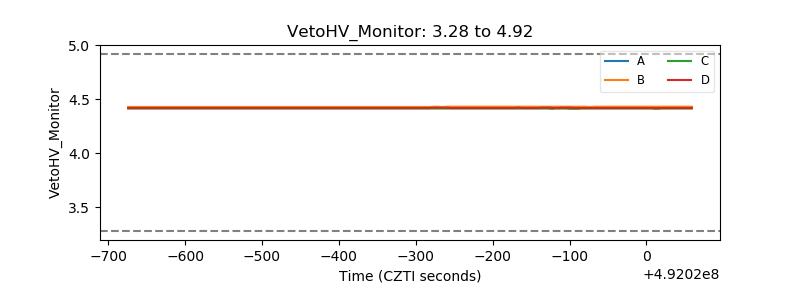 |
| Veto LLD | 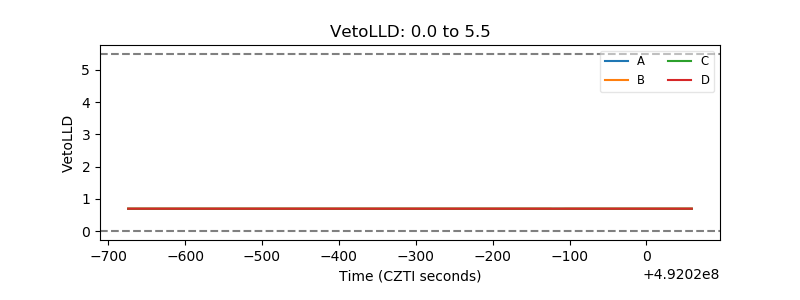 |
| Alpha Counter | 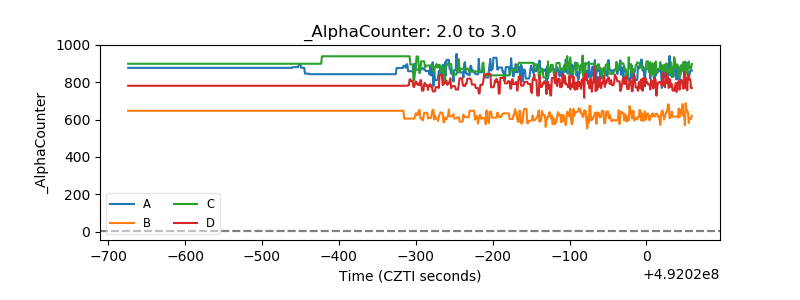 |
| _CPM_Rate | 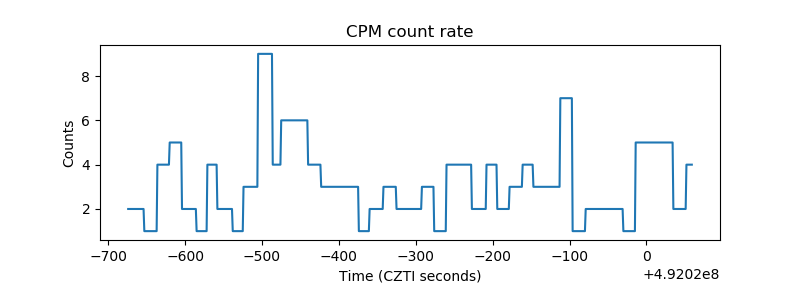 |
| CZT Counter | 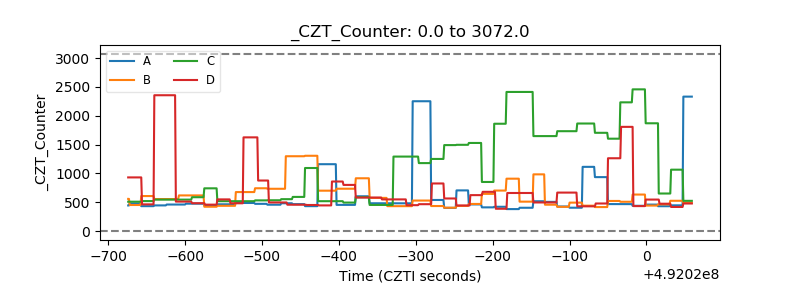 |
| +2.5 Volts monitor |  |
| +5 Volts monitor |  |
| _ROLL_ROT | 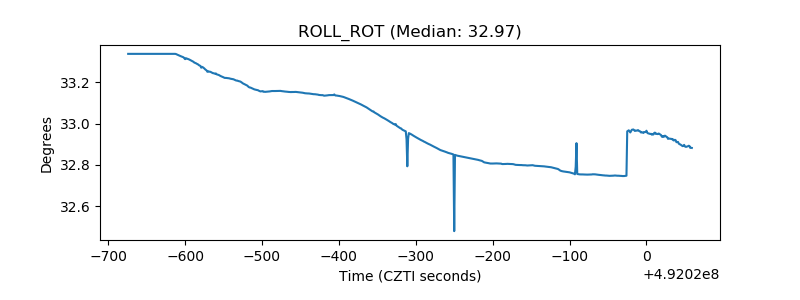 |
| _Roll_DEC | 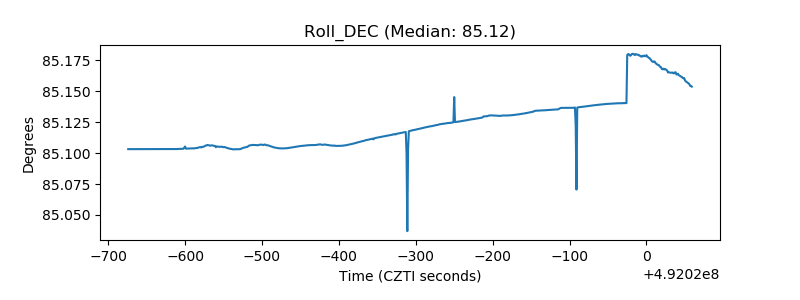 |
| _Roll_RA | 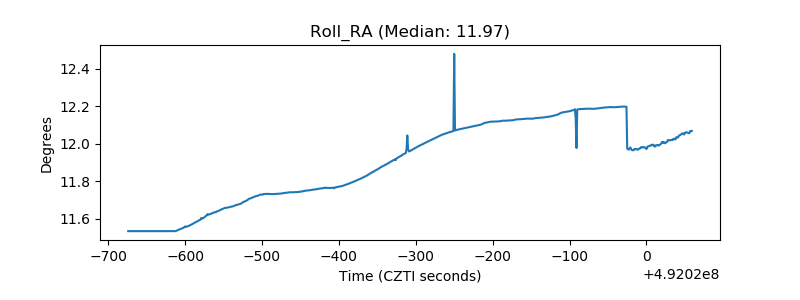 |
| Veto Counter | 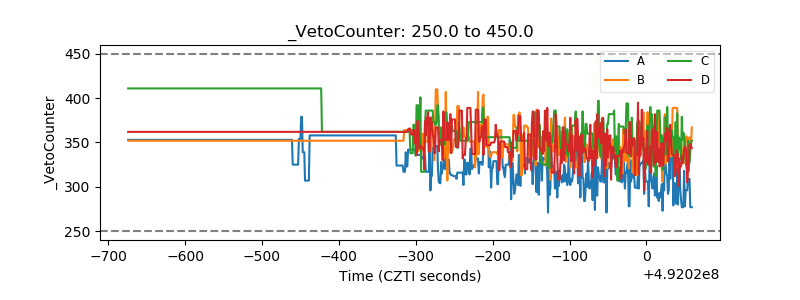 |