| Param | Original file | Final file |
|---|---|---|
| Filename | modeM0/AS1C09_011T08_9000006492_53294cztM0_level2.fits | modeM0/AS1C09_011T08_9000006492_53294cztM0_level2_quad_clean.evt |
| Size (bytes) | 619,202,880 | 91,261,440 |
| Size | 590.5 MB | 87.0 MB |
| Events in quadrant A | 4,372,952 | 625,496 |
| Events in quadrant B | 4,881,158 | 653,457 |
| Events in quadrant C | 8,786,186 | 470,449 |
| Events in quadrant D | 4,382,021 | 565,001 |
| Mode M0 | |||
|---|---|---|---|
| Quadrant | BADHDUFLAG | Total packets | Discarded packets |
| A | 0 | 17393 | 2 |
| B | 0 | 18861 | 6 |
| C | 0 | 30563 | 20 |
| D | 0 | 17562 | 2 |
| Mode M9 | |||
|---|---|---|---|
| Quadrant | BADHDUFLAG | Total packets | Discarded packets |
| A | 0 | 11 | 0 |
| B | 0 | 11 | 0 |
| C | 0 | 12 | 0 |
| D | 0 | 12 | 0 |
| Mode SS | |||
|---|---|---|---|
| Quadrant | BADHDUFLAG | Total packets | Discarded packets |
| A | 0 | 130 | 0 |
| B | 0 | 130 | 0 |
| C | 0 | 130 | 0 |
| D | 0 | 130 | 0 |
| Quadrant | Total seconds | Saturated seconds | Saturation percentage |
|---|---|---|---|
| A | 6435 | 322 | 5.003885% |
| B | 6434 | 514 | 7.988809% |
| C | 6430 | 1718 | 26.718507% |
| D | 6434 | 274 | 4.258626% |
Noise dominated data is calculated using 1-second bins in cleaned event files. If a bin has >2000 counts, and if more than 50% of those come from <1% of pixels, then it is considered to be noise-dominated and hence unusable.
| Quadrant | # 1 sec bins | Bins with >0 counts | Bins with >2000 counts | High rate bins dominated by noise | Noise dominated (total time) | Noise dominated (detector-on time) | Marked lightcurve |
|---|---|---|---|---|---|---|---|
| A | 7520 | 6436 | 259 | 259 | 3.44% | 4.02% | 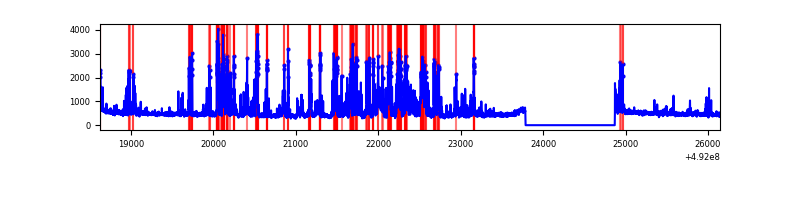 |
| B | 7519 | 6435 | 302 | 302 | 4.02% | 4.69% | 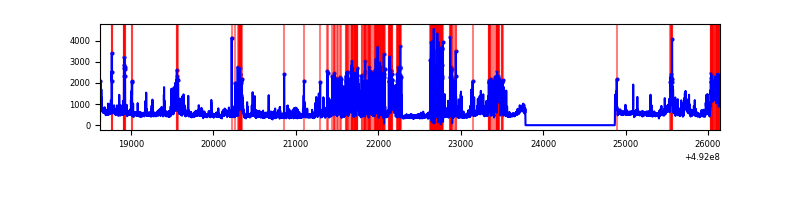 |
| C | 7519 | 6434 | 1564 | 1564 | 20.80% | 24.31% | 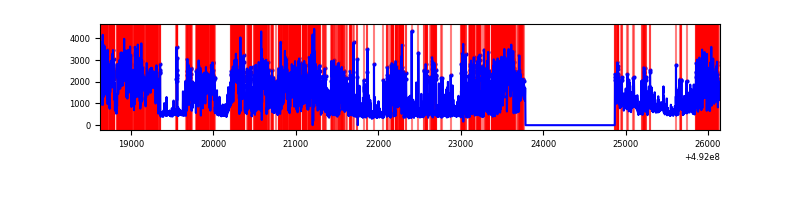 |
| D | 7519 | 6435 | 201 | 201 | 2.67% | 3.12% |  |
Top three noisy pixels from each quadrant. If the there are fewer than three noisy pixels in the level2.evt file, extra rows are filled as -1
| Pixel properties | Quadrant properties | ||||||
|---|---|---|---|---|---|---|---|
| Quadrant | DetID | PixID | Counts | Sigma | Mean | Median | Sigma |
| A | 3 | 62 | 1265841 | 7345.62 | 690 | 672 | 172.2 |
| A | 7 | 206 | 160173 | 926.07 | 690 | 672 | 172.2 |
| A | 5 | 240 | 64366 | 369.81 | 690 | 672 | 172.2 |
| B | 2 | 249 | 923749 | 6410.12 | 673 | 650 | 144.0 |
| B | 10 | 254 | 398033 | 2759.48 | 673 | 650 | 144.0 |
| B | 4 | 81 | 386034 | 2676.16 | 673 | 650 | 144.0 |
| C | 15 | 178 | 1769323 | 10542.35 | 609 | 601 | 167.8 |
| C | 4 | 5 | 1432728 | 8536.09 | 609 | 601 | 167.8 |
| C | 15 | 224 | 1178637 | 7021.6 | 609 | 601 | 167.8 |
| D | 3 | 12 | 627381 | 3315.14 | 674 | 644 | 189.1 |
| D | 11 | 176 | 517716 | 2735.07 | 674 | 644 | 189.1 |
| D | 2 | 62 | 111836 | 588.15 | 674 | 644 | 189.1 |
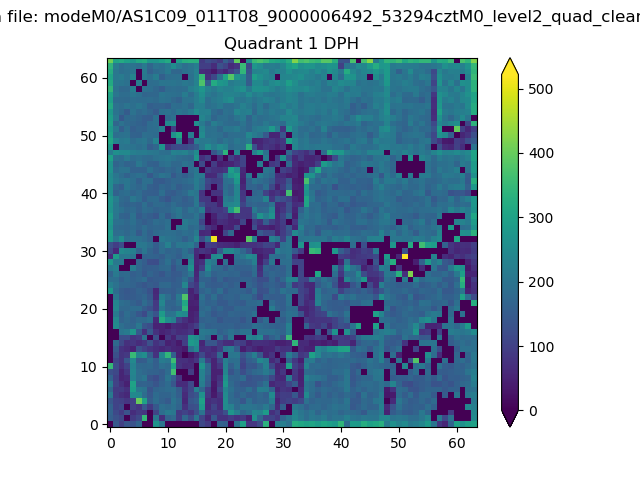
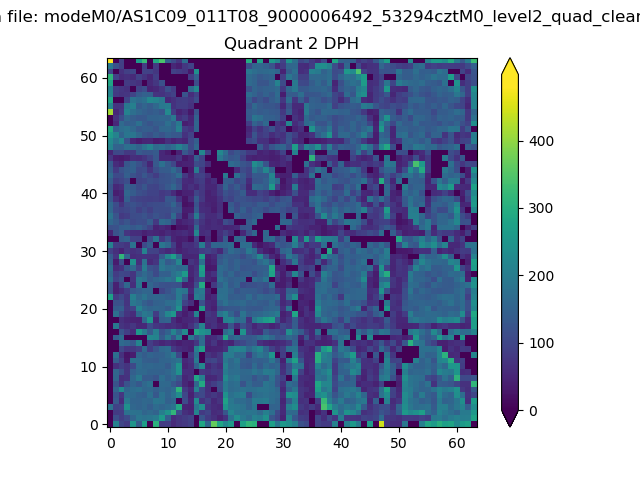
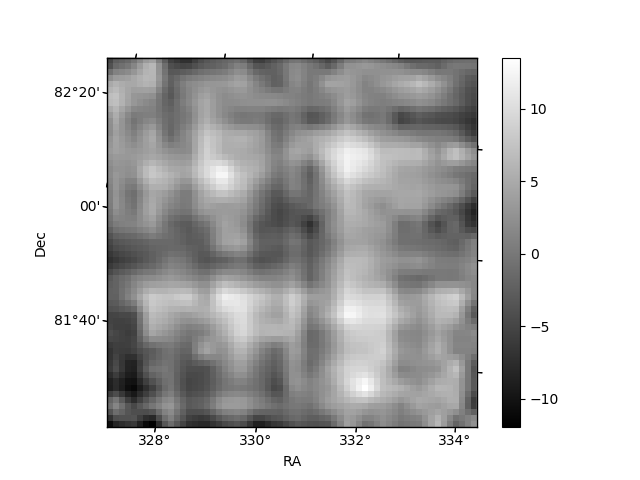
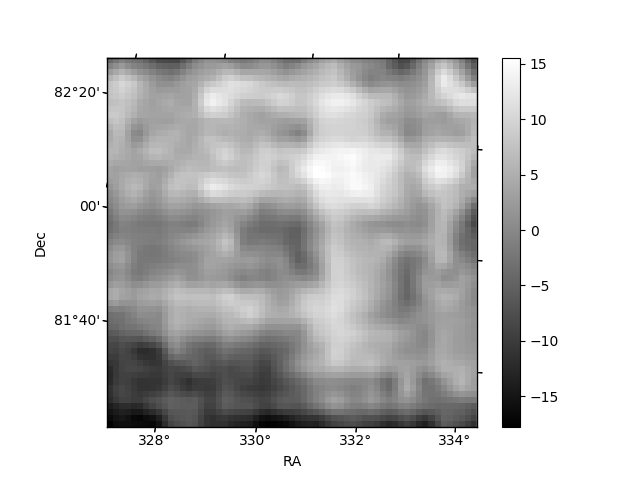
Histogram calculated using DETX and DETY for each event in the final _common_clean file
| Quadrant A | 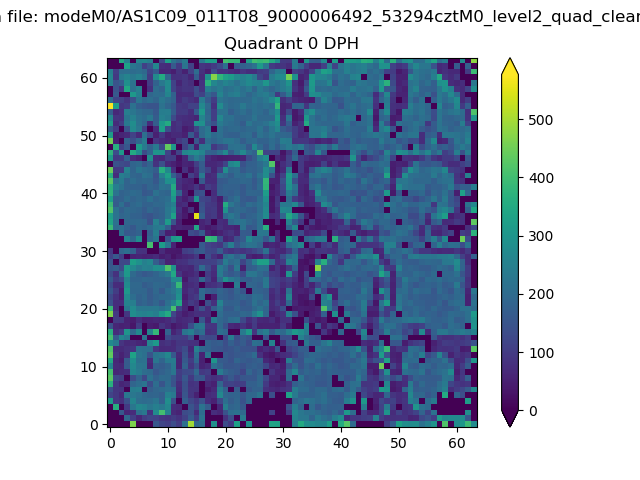 |
 |
Quadrant B |
|---|---|---|---|
| Quadrant D | 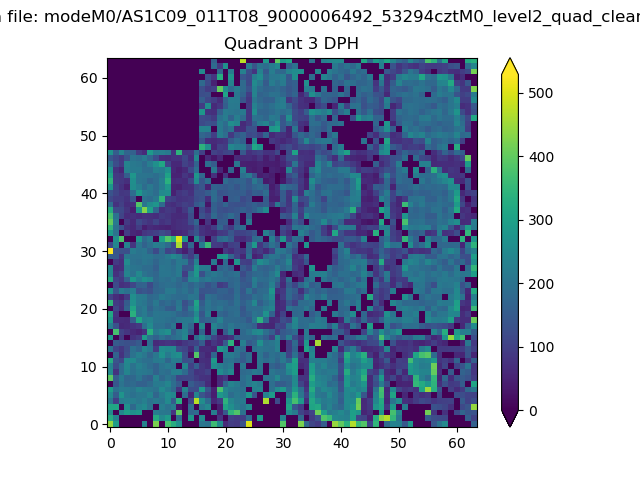 |
 |
Quadrant C |
| Plot type | Count rate plots | Images |
|---|---|---|
| Comparison with Poisson distribution Blue bars denote a histogram of data divided into 1 sec bins. Red curve is a Poisson curve with rate = median count rate of data. |
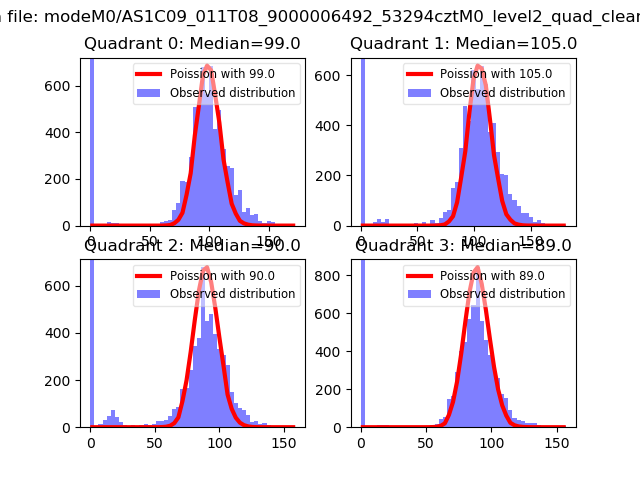 |
 |
| Quadrant-wise count rates Data is divided into 100 sec bins |
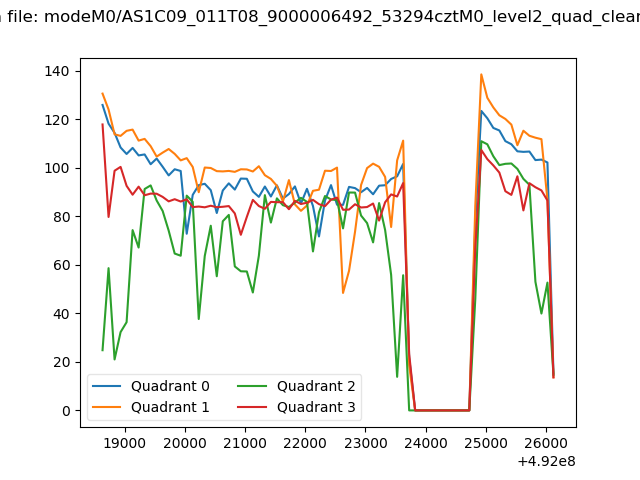 |
|
| Module-wise count rates for Quadrant A Data is divided into 100 sec bins |
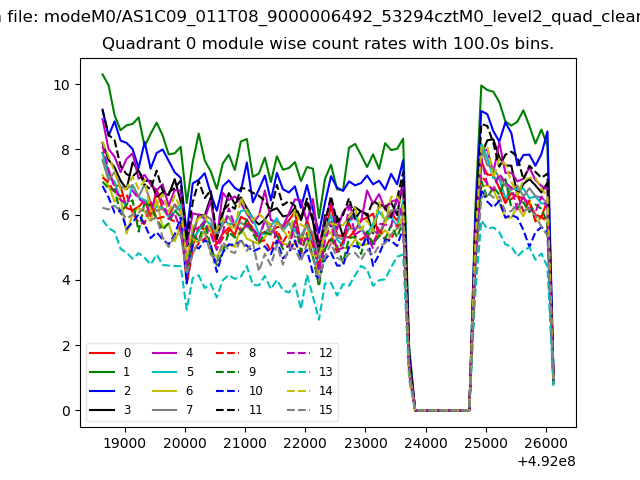 |
 |
| Module-wise count rates for Quadrant B Data is divided into 100 sec bins |
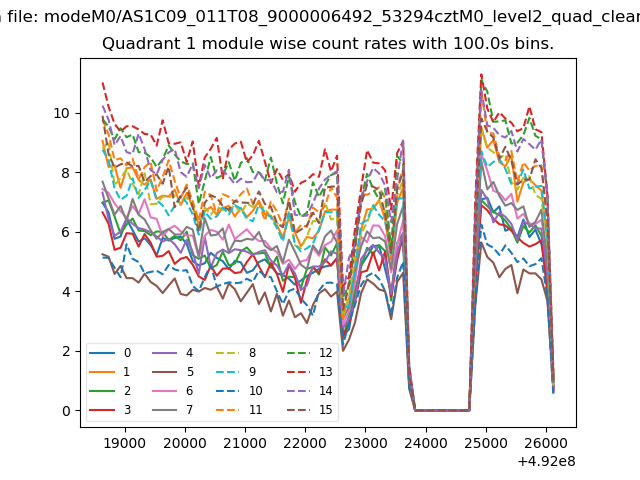 |
 |
| Module-wise count rates for Quadrant C Data is divided into 100 sec bins |
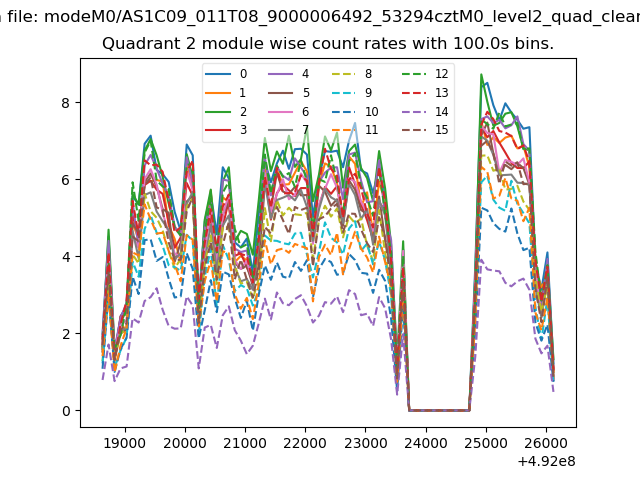 |
 |
| Module-wise count rates for Quadrant D Data is divided into 100 sec bins |
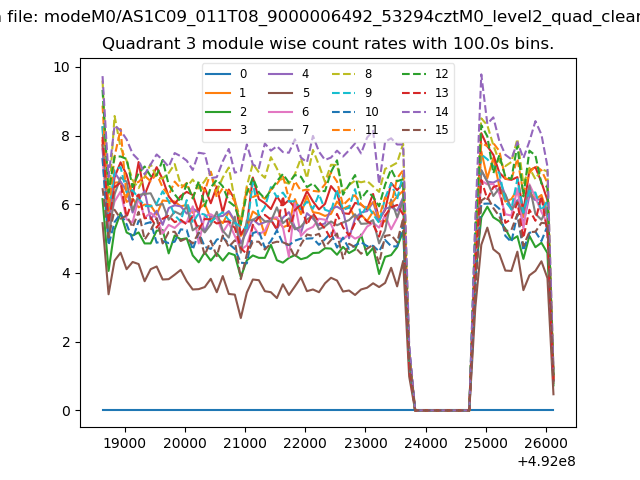 |
 |
| Parameter | Plot |
|---|---|
| CZT HV Monitor | 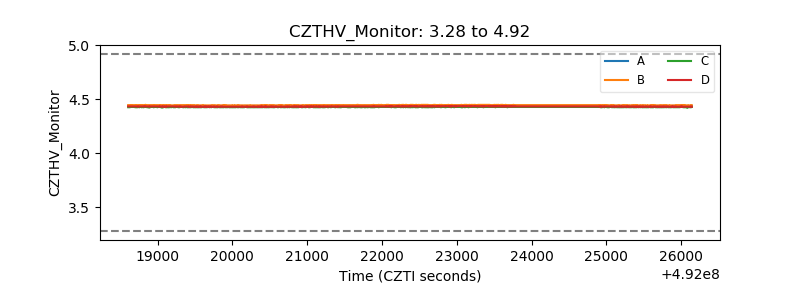 |
| D_VDD | 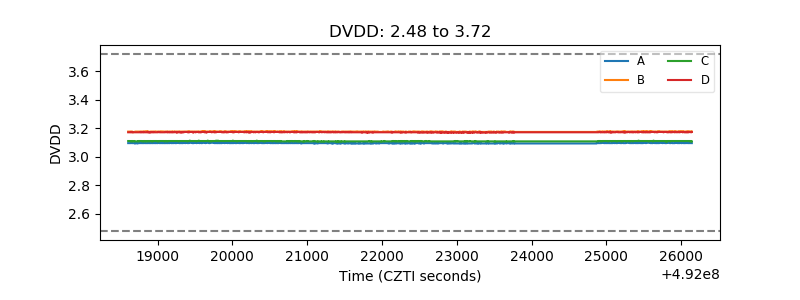 |
| Temperature 1 | 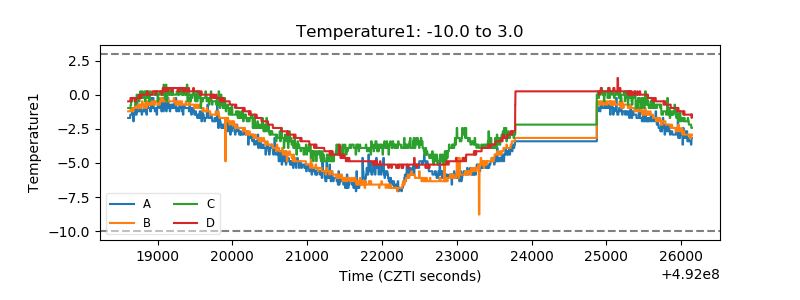 |
| Veto HV Monitor | 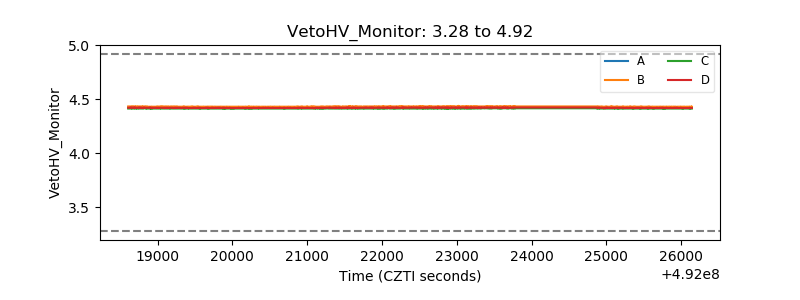 |
| Veto LLD | 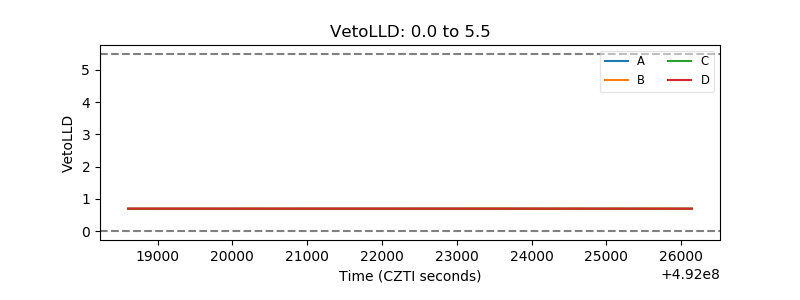 |
| Alpha Counter |  |
| _CPM_Rate | 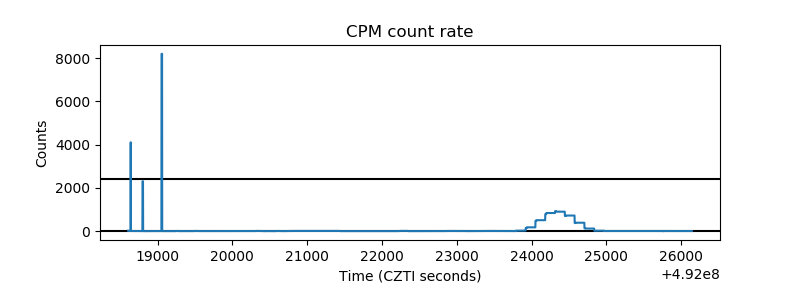 |
| CZT Counter | 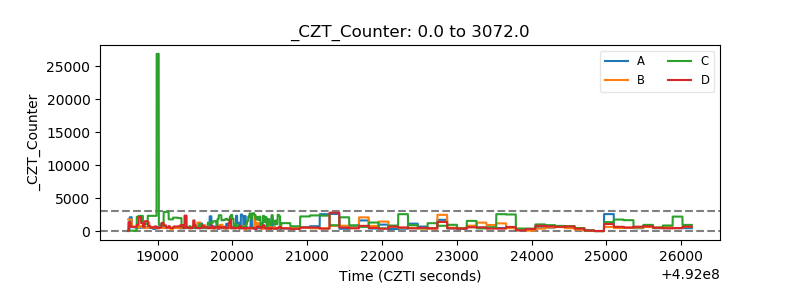 |
| +2.5 Volts monitor | 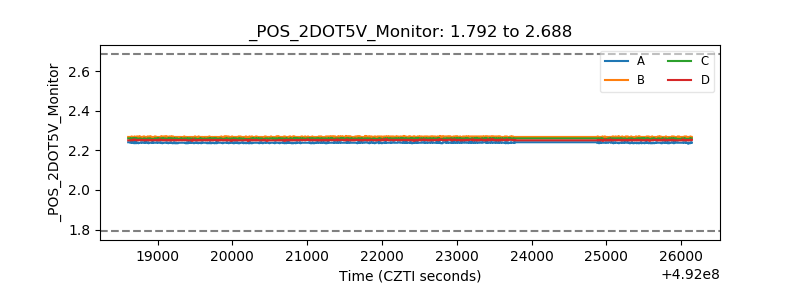 |
| +5 Volts monitor | 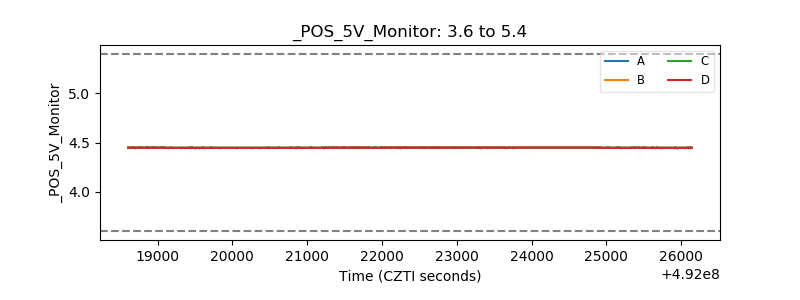 |
| _ROLL_ROT | 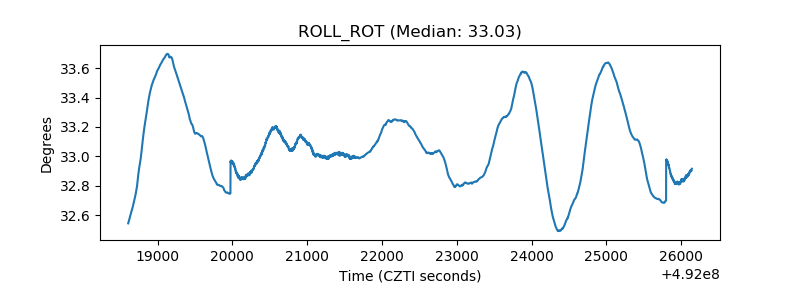 |
| _Roll_DEC | 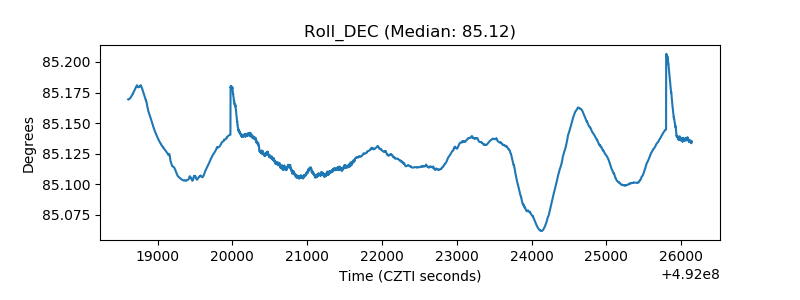 |
| _Roll_RA | 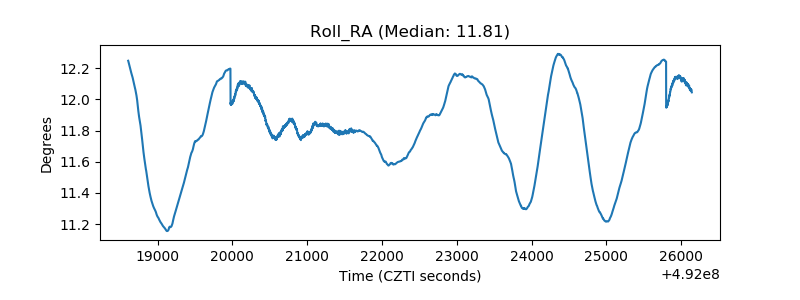 |
| Veto Counter | 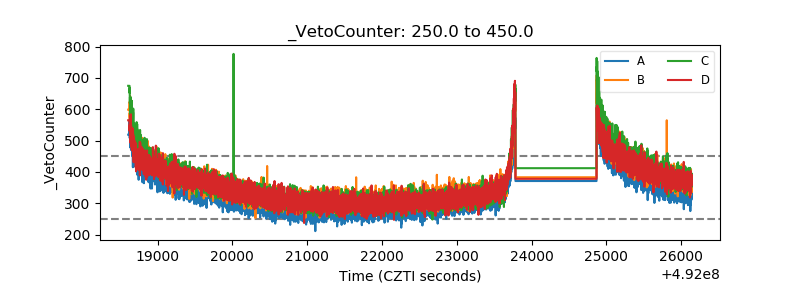 |