| Param | Original file | Final file |
|---|---|---|
| Filename | modeM0/AS1C09_011T08_9000006492_53295cztM0_level2.fits | modeM0/AS1C09_011T08_9000006492_53295cztM0_level2_quad_clean.evt |
| Size (bytes) | 594,120,960 | 83,462,400 |
| Size | 566.6 MB | 79.6 MB |
| Events in quadrant A | 2,958,836 | 598,191 |
| Events in quadrant B | 4,795,148 | 634,718 |
| Events in quadrant C | 9,877,464 | 351,508 |
| Events in quadrant D | 3,897,176 | 525,122 |
| Mode M0 | |||
|---|---|---|---|
| Quadrant | BADHDUFLAG | Total packets | Discarded packets |
| A | 0 | 13121 | 1 |
| B | 0 | 18318 | 1 |
| C | 0 | 33431 | 2 |
| D | 0 | 15758 | 1 |
| Mode M9 | |||
|---|---|---|---|
| Quadrant | BADHDUFLAG | Total packets | Discarded packets |
| A | 0 | 12 | 0 |
| B | 0 | 12 | 0 |
| C | 0 | 12 | 0 |
| D | 0 | 12 | 0 |
| Mode SS | |||
|---|---|---|---|
| Quadrant | BADHDUFLAG | Total packets | Discarded packets |
| A | 0 | 122 | 0 |
| B | 0 | 122 | 0 |
| C | 0 | 122 | 0 |
| D | 0 | 122 | 0 |
| Quadrant | Total seconds | Saturated seconds | Saturation percentage |
|---|---|---|---|
| A | 5976 | 65 | 1.087684% |
| B | 5976 | 247 | 4.133199% |
| C | 5976 | 2593 | 43.390228% |
| D | 5976 | 281 | 4.702142% |
Noise dominated data is calculated using 1-second bins in cleaned event files. If a bin has >2000 counts, and if more than 50% of those come from <1% of pixels, then it is considered to be noise-dominated and hence unusable.
| Quadrant | # 1 sec bins | Bins with >0 counts | Bins with >2000 counts | High rate bins dominated by noise | Noise dominated (total time) | Noise dominated (detector-on time) | Marked lightcurve |
|---|---|---|---|---|---|---|---|
| A | 7171 | 5977 | 36 | 36 | 0.50% | 0.60% | 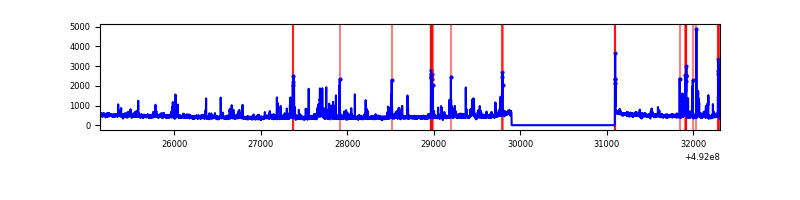 |
| B | 7171 | 5977 | 183 | 183 | 2.55% | 3.06% | 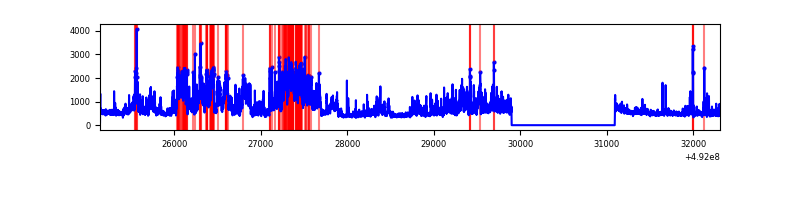 |
| C | 7171 | 5976 | 2396 | 2396 | 33.41% | 40.09% | 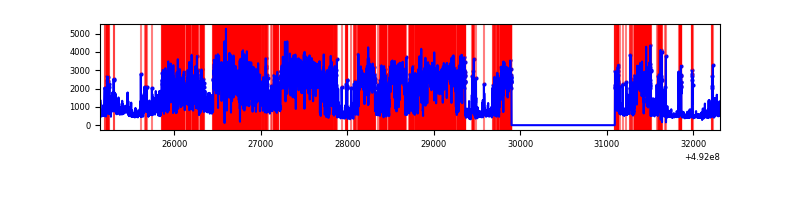 |
| D | 7171 | 5977 | 215 | 215 | 3.00% | 3.60% | 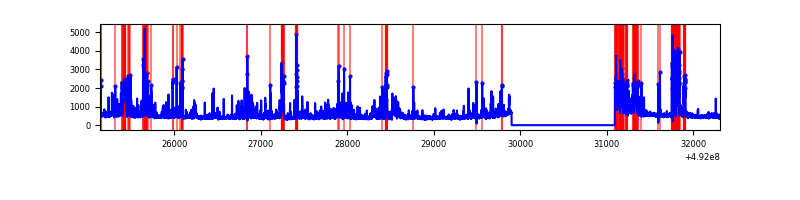 |
Top three noisy pixels from each quadrant. If the there are fewer than three noisy pixels in the level2.evt file, extra rows are filled as -1
| Pixel properties | Quadrant properties | ||||||
|---|---|---|---|---|---|---|---|
| Quadrant | DetID | PixID | Counts | Sigma | Mean | Median | Sigma |
| A | 3 | 62 | 228569 | 1423.65 | 636 | 622 | 160.1 |
| A | 15 | 174 | 96555 | 599.15 | 636 | 622 | 160.1 |
| A | 0 | 8 | 61570 | 380.65 | 636 | 622 | 160.1 |
| B | 10 | 254 | 1539900 | 11492.16 | 632 | 612 | 133.9 |
| B | 4 | 81 | 294279 | 2192.49 | 632 | 612 | 133.9 |
| B | 10 | 28 | 115600 | 858.49 | 632 | 612 | 133.9 |
| C | 1 | 241 | 3638509 | 26780.49 | 495 | 490 | 135.8 |
| C | 4 | 5 | 1324754 | 9748.28 | 495 | 490 | 135.8 |
| C | 15 | 224 | 826628 | 6081.43 | 495 | 490 | 135.8 |
| D | 11 | 176 | 447875 | 2555.42 | 611 | 584 | 175.0 |
| D | 3 | 12 | 337752 | 1926.27 | 611 | 584 | 175.0 |
| D | 6 | 239 | 175191 | 997.55 | 611 | 584 | 175.0 |
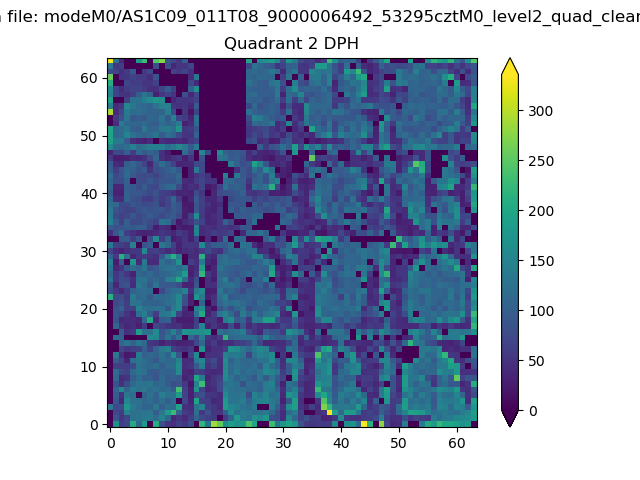
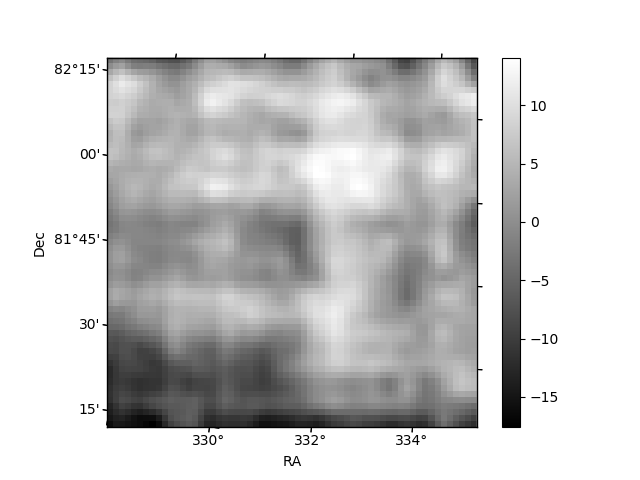
Histogram calculated using DETX and DETY for each event in the final _common_clean file
| Quadrant A | 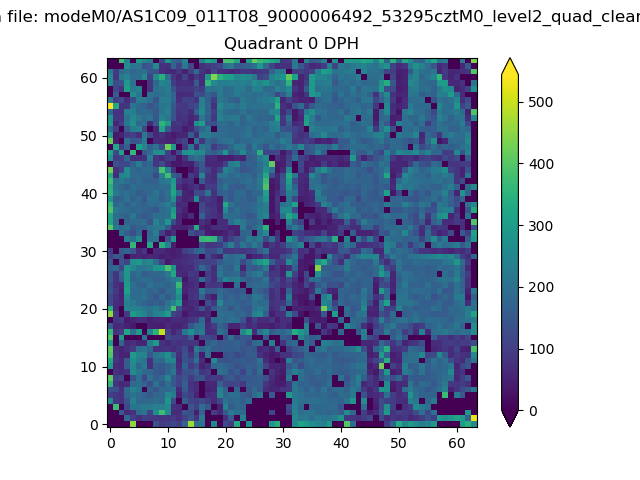 |
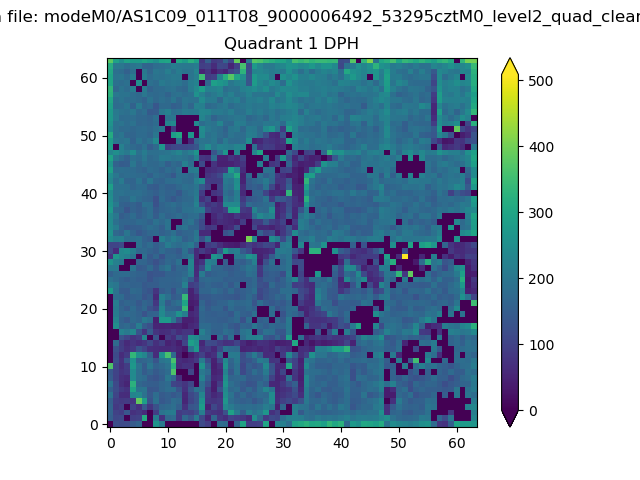 |
Quadrant B |
|---|---|---|---|
| Quadrant D | 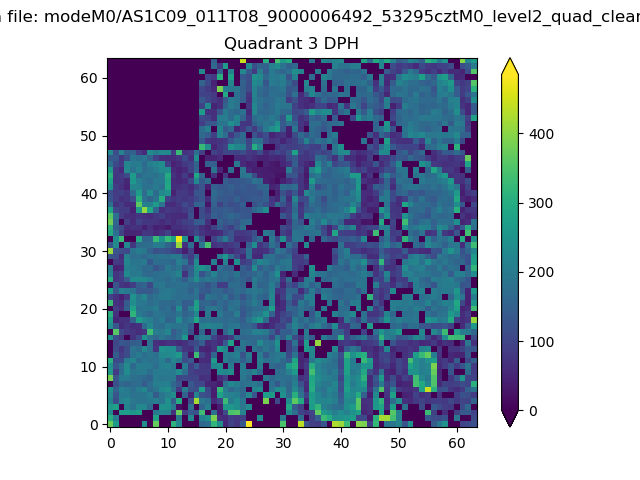 |
 |
Quadrant C |
| Plot type | Count rate plots | Images |
|---|---|---|
| Comparison with Poisson distribution Blue bars denote a histogram of data divided into 1 sec bins. Red curve is a Poisson curve with rate = median count rate of data. |
 |
 |
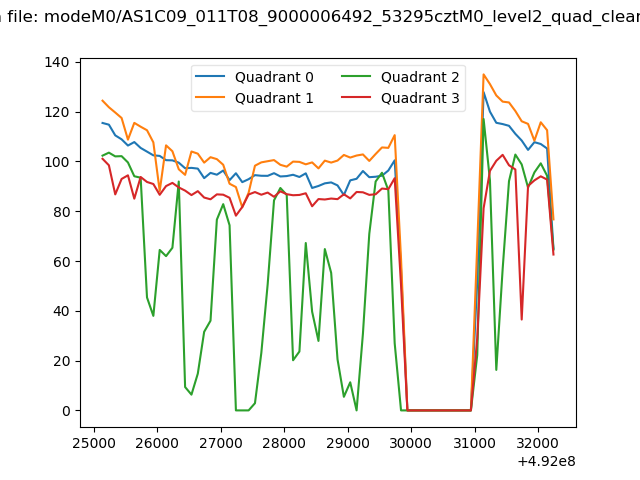
| Quadrant-wise count rates Data is divided into 100 sec bins |
 |
|
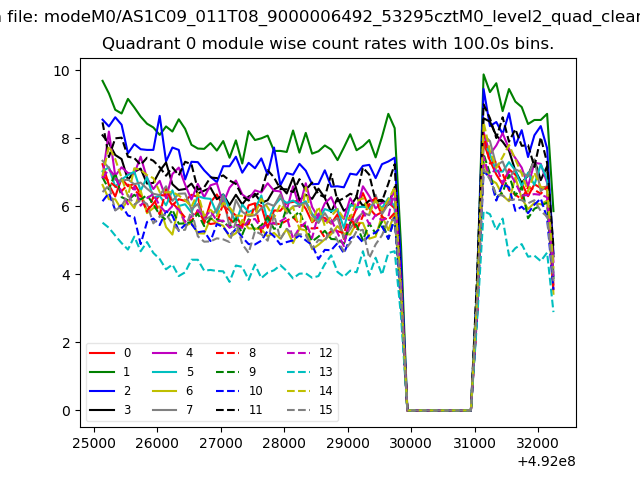
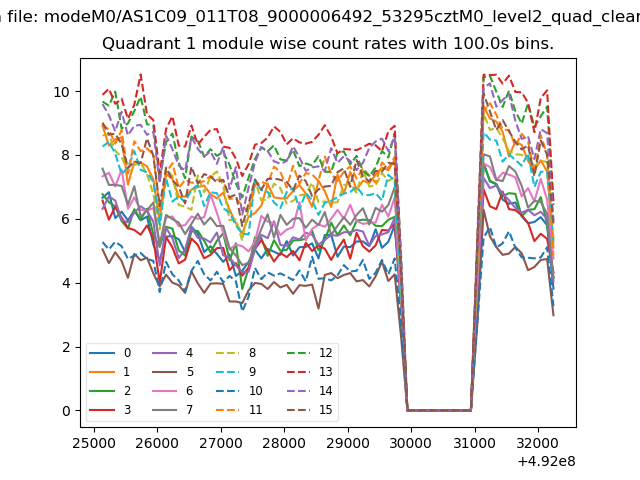
| Module-wise count rates for Quadrant A Data is divided into 100 sec bins |
 |
 |
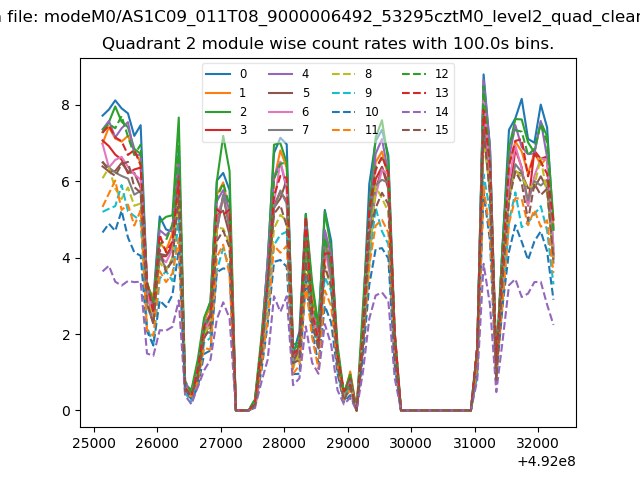
| Module-wise count rates for Quadrant B Data is divided into 100 sec bins |
 |
 |
| Module-wise count rates for Quadrant C Data is divided into 100 sec bins |
 |
 |
| Module-wise count rates for Quadrant D Data is divided into 100 sec bins |
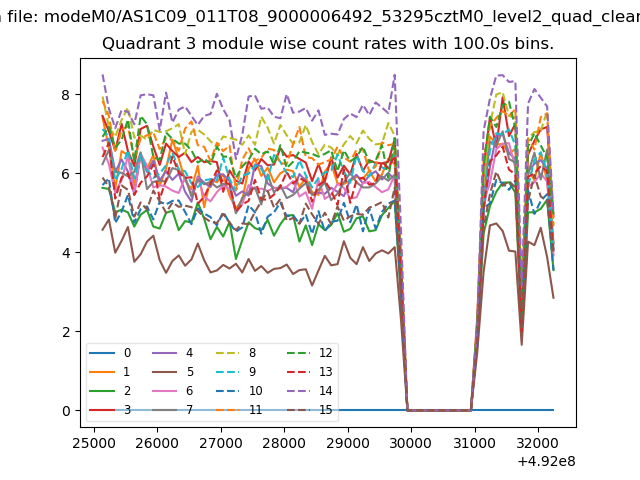 |
 |
| Parameter | Plot |
|---|---|
| CZT HV Monitor |  |
| D_VDD | 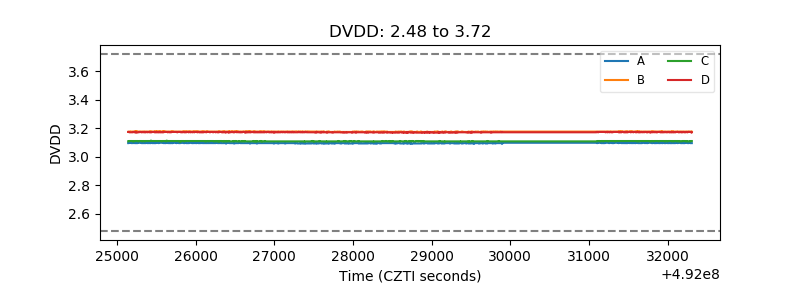 |
| Temperature 1 |  |
| Veto HV Monitor | 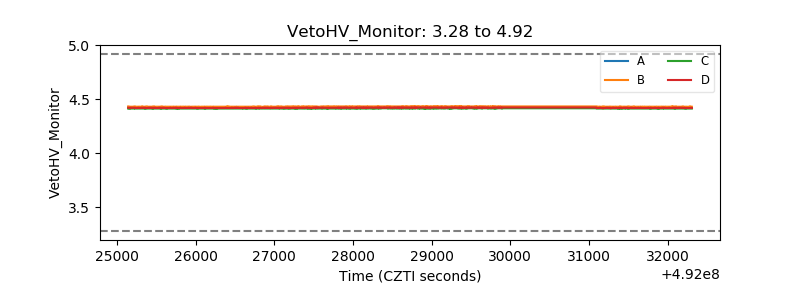 |
| Veto LLD | 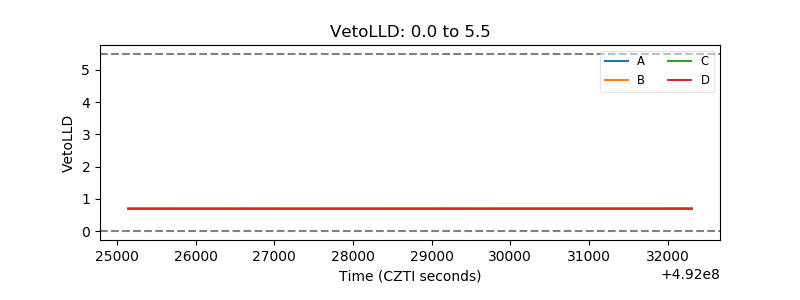 |
| Alpha Counter | 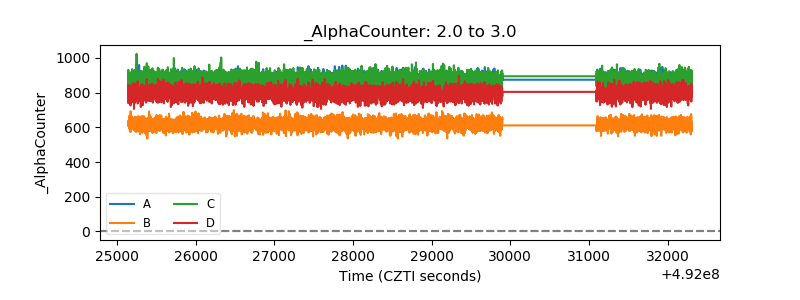 |
| _CPM_Rate | 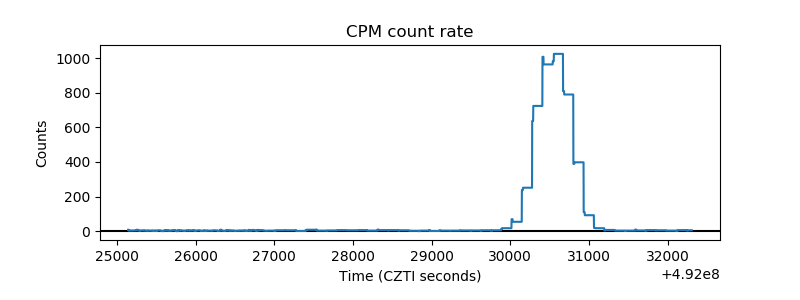 |
| CZT Counter | 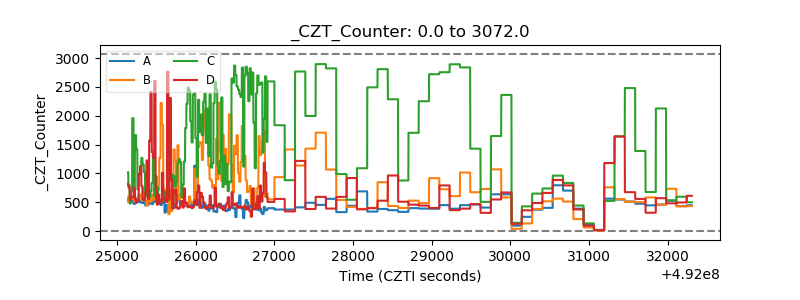 |
| +2.5 Volts monitor |  |
| +5 Volts monitor |  |
| _ROLL_ROT | 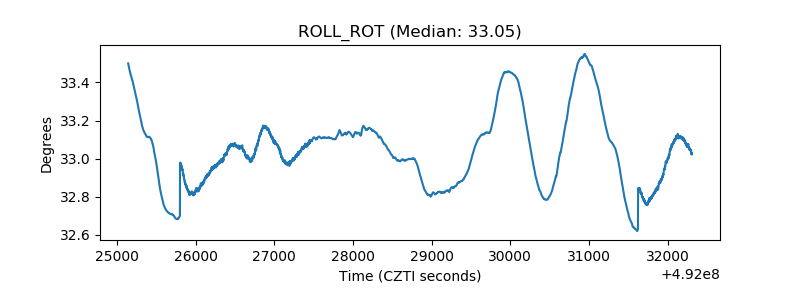 |
| _Roll_DEC | 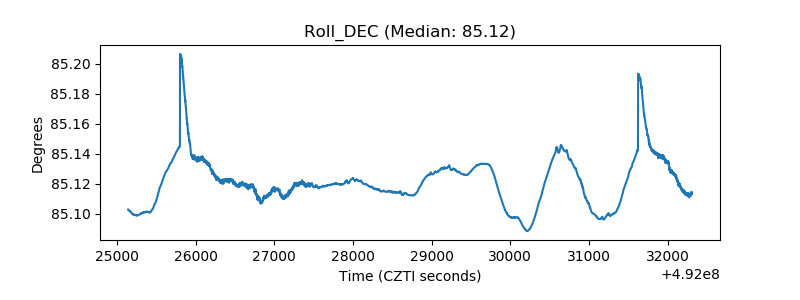 |
| _Roll_RA | 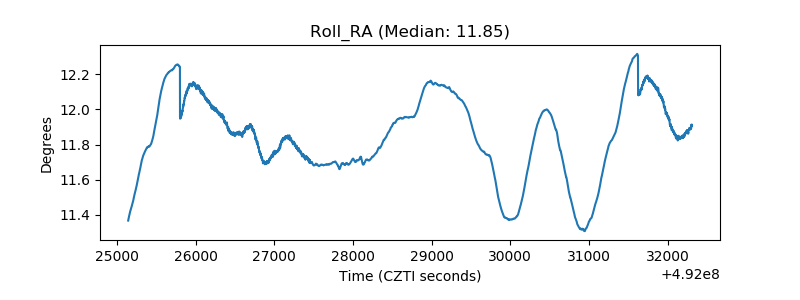 |
| Veto Counter | 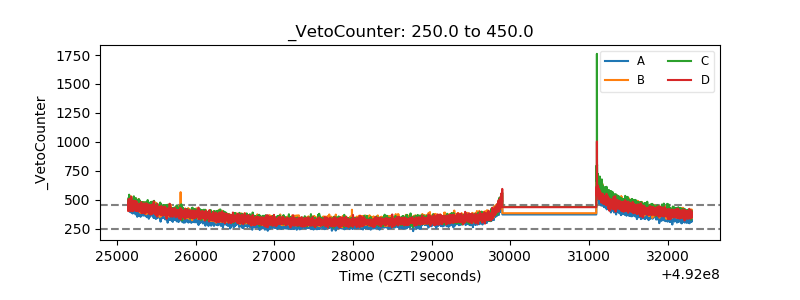 |