| Param | Original file | Final file |
|---|---|---|
| Filename | modeM0/AS1C09_011T08_9000006492_53296cztM0_level2.fits | modeM0/AS1C09_011T08_9000006492_53296cztM0_level2_quad_clean.evt |
| Size (bytes) | 600,652,800 | 86,558,400 |
| Size | 572.8 MB | 82.5 MB |
| Events in quadrant A | 3,207,561 | 623,608 |
| Events in quadrant B | 3,954,908 | 668,631 |
| Events in quadrant C | 10,539,199 | 345,311 |
| Events in quadrant D | 4,048,984 | 548,939 |
| Mode M0 | |||
|---|---|---|---|
| Quadrant | BADHDUFLAG | Total packets | Discarded packets |
| A | 0 | 13934 | 2 |
| B | 0 | 15952 | 2 |
| C | 0 | 35533 | 2 |
| D | 0 | 16379 | 4 |
| Mode M9 | |||
|---|---|---|---|
| Quadrant | BADHDUFLAG | Total packets | Discarded packets |
| A | 0 | 14 | 0 |
| B | 0 | 15 | 0 |
| C | 0 | 15 | 0 |
| D | 0 | 15 | 0 |
| Mode SS | |||
|---|---|---|---|
| Quadrant | BADHDUFLAG | Total packets | Discarded packets |
| A | 0 | 126 | 0 |
| B | 0 | 126 | 0 |
| C | 0 | 126 | 0 |
| D | 0 | 126 | 0 |
| Quadrant | Total seconds | Saturated seconds | Saturation percentage |
|---|---|---|---|
| A | 6227 | 111 | 1.782560% |
| B | 6227 | 239 | 3.838124% |
| C | 6227 | 2876 | 46.185964% |
| D | 6226 | 331 | 5.316415% |
Noise dominated data is calculated using 1-second bins in cleaned event files. If a bin has >2000 counts, and if more than 50% of those come from <1% of pixels, then it is considered to be noise-dominated and hence unusable.
| Quadrant | # 1 sec bins | Bins with >0 counts | Bins with >2000 counts | High rate bins dominated by noise | Noise dominated (total time) | Noise dominated (detector-on time) | Marked lightcurve |
|---|---|---|---|---|---|---|---|
| A | 7467 | 6228 | 51 | 51 | 0.68% | 0.82% | 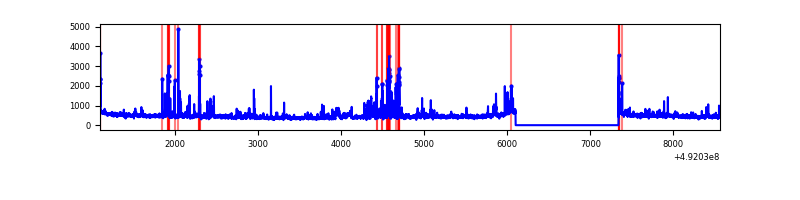 |
| B | 7467 | 6228 | 141 | 141 | 1.89% | 2.26% | 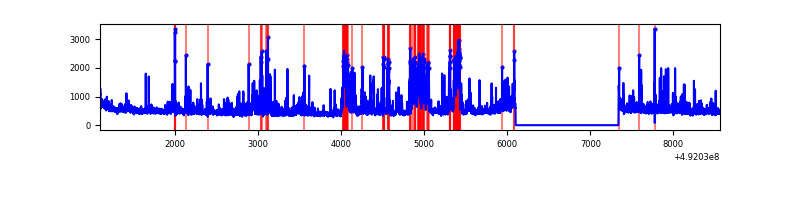 |
| C | 7467 | 6228 | 2661 | 2661 | 35.64% | 42.73% | 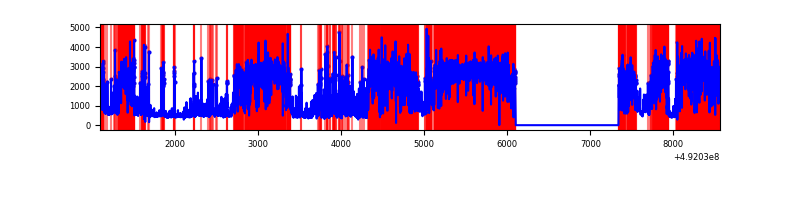 |
| D | 7466 | 6227 | 243 | 243 | 3.25% | 3.90% | 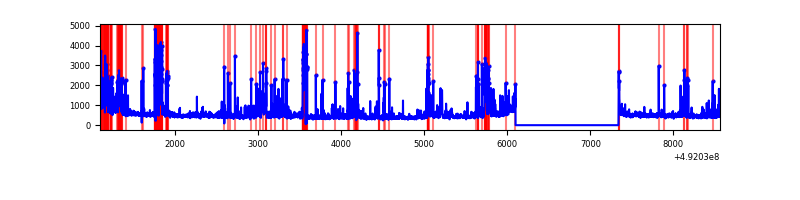 |
Top three noisy pixels from each quadrant. If the there are fewer than three noisy pixels in the level2.evt file, extra rows are filled as -1
| Pixel properties | Quadrant properties | ||||||
|---|---|---|---|---|---|---|---|
| Quadrant | DetID | PixID | Counts | Sigma | Mean | Median | Sigma |
| A | 0 | 8 | 202181 | 1195.3 | 664 | 647 | 168.6 |
| A | 4 | 3 | 129628 | 764.99 | 664 | 647 | 168.6 |
| A | 15 | 174 | 68619 | 403.14 | 664 | 647 | 168.6 |
| B | 4 | 81 | 775137 | 5564.48 | 663 | 641 | 139.2 |
| B | 10 | 28 | 129364 | 924.83 | 663 | 641 | 139.2 |
| B | 4 | 170 | 84913 | 605.46 | 663 | 641 | 139.2 |
| C | 1 | 241 | 5878020 | 42581.49 | 502 | 499 | 138.0 |
| C | 15 | 224 | 1184586 | 8578.48 | 502 | 499 | 138.0 |
| C | 9 | 38 | 747597 | 5412.58 | 502 | 499 | 138.0 |
| D | 11 | 176 | 532049 | 2924.0 | 636 | 608 | 181.8 |
| D | 3 | 12 | 247348 | 1357.57 | 636 | 608 | 181.8 |
| D | 6 | 239 | 117131 | 641.11 | 636 | 608 | 181.8 |
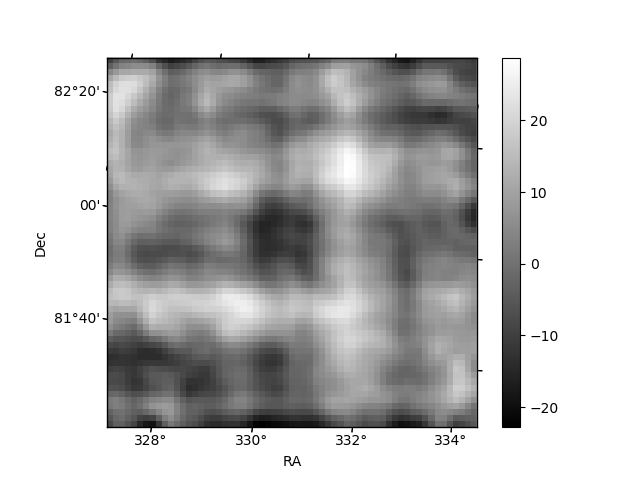
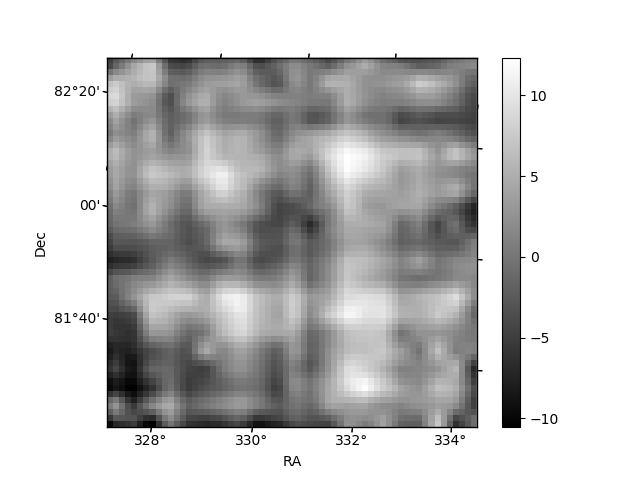
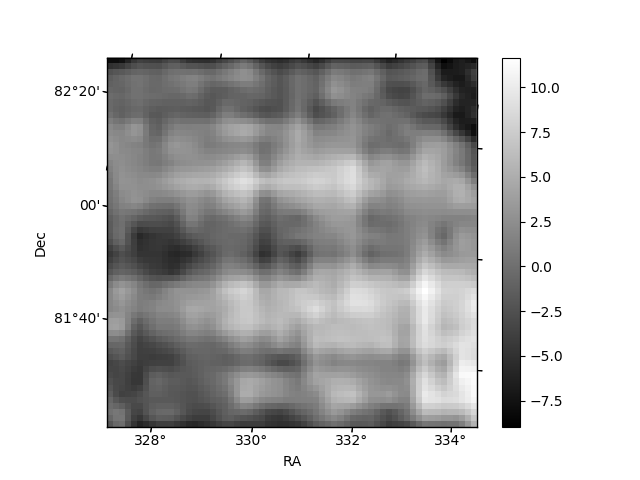
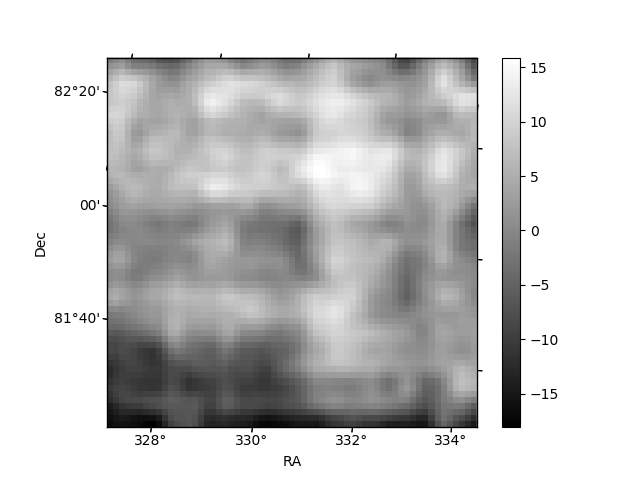
Histogram calculated using DETX and DETY for each event in the final _common_clean file
| Quadrant A | 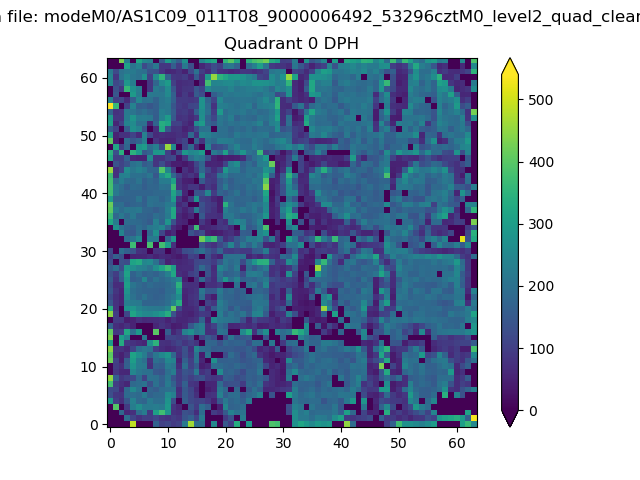 |
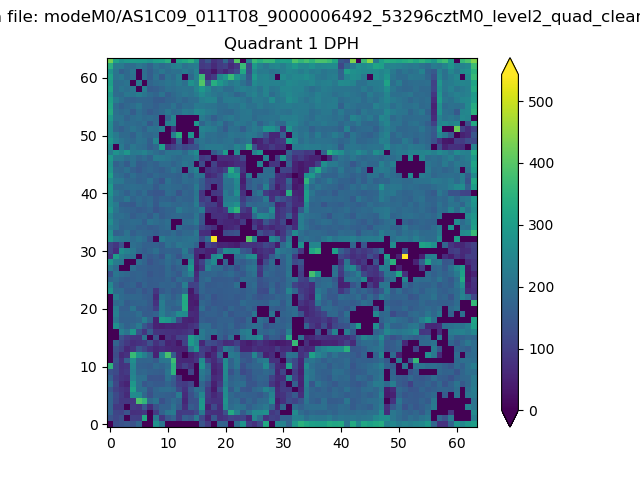 |
Quadrant B |
|---|---|---|---|
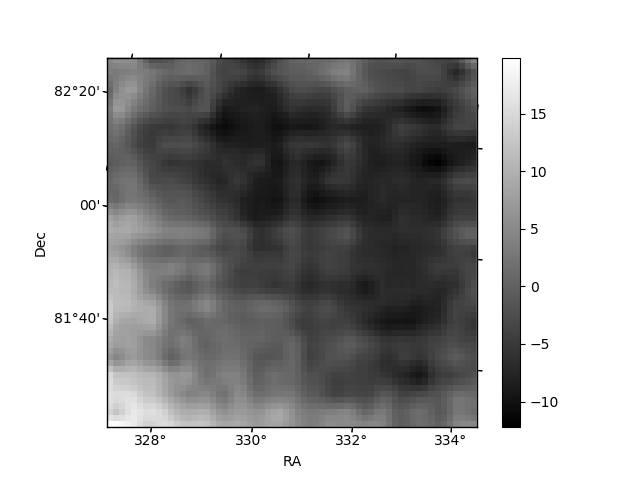
| Quadrant D | 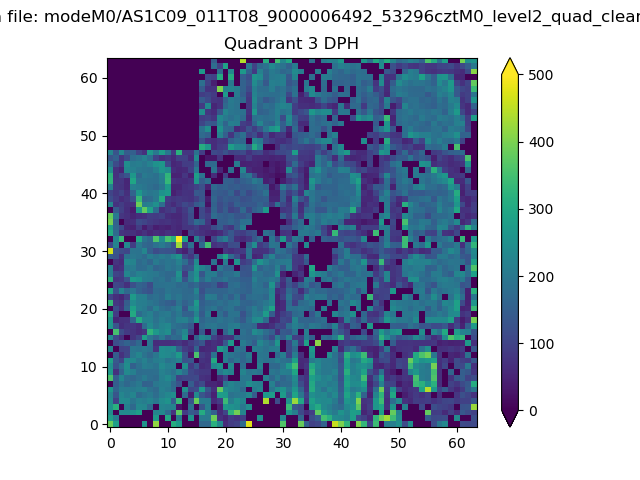 |
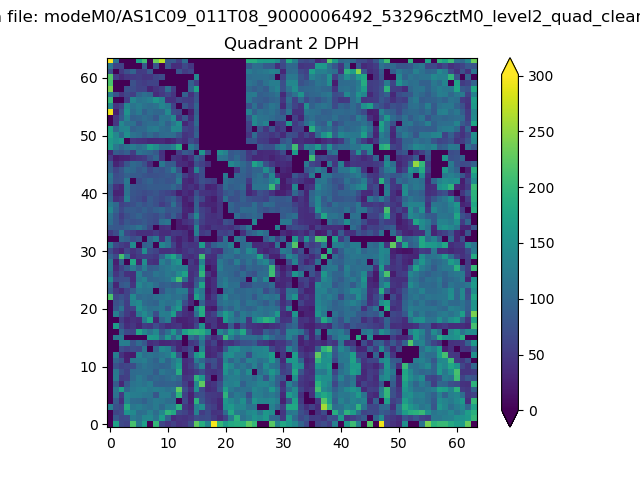 |
Quadrant C |
| Plot type | Count rate plots | Images |
|---|---|---|
| Comparison with Poisson distribution Blue bars denote a histogram of data divided into 1 sec bins. Red curve is a Poisson curve with rate = median count rate of data. |
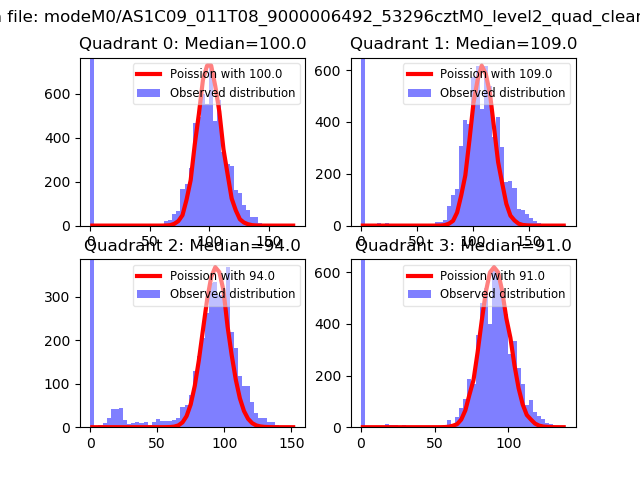 |
 |
| Quadrant-wise count rates Data is divided into 100 sec bins |
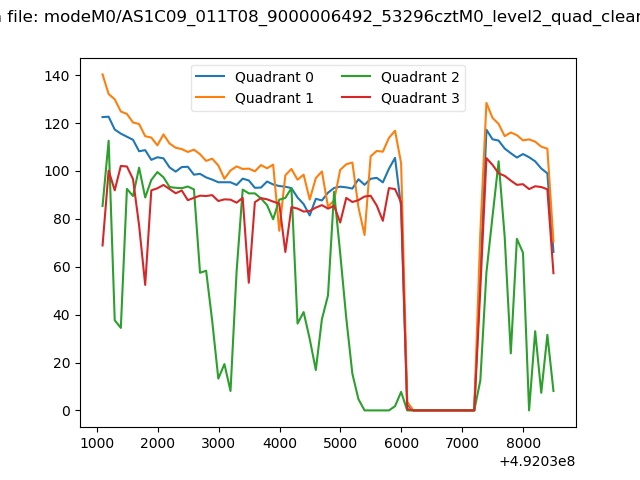 |
|
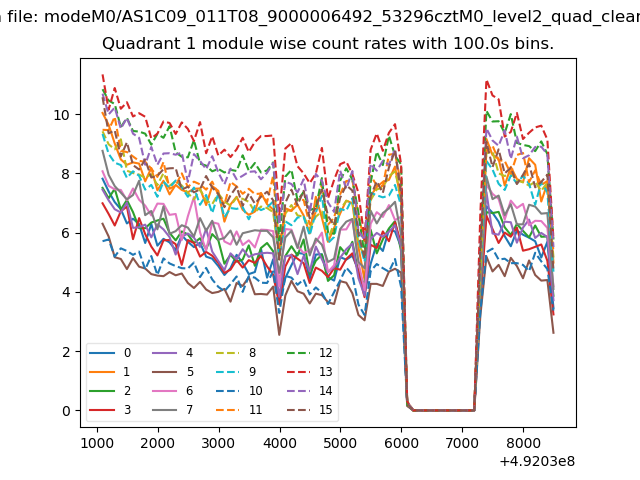
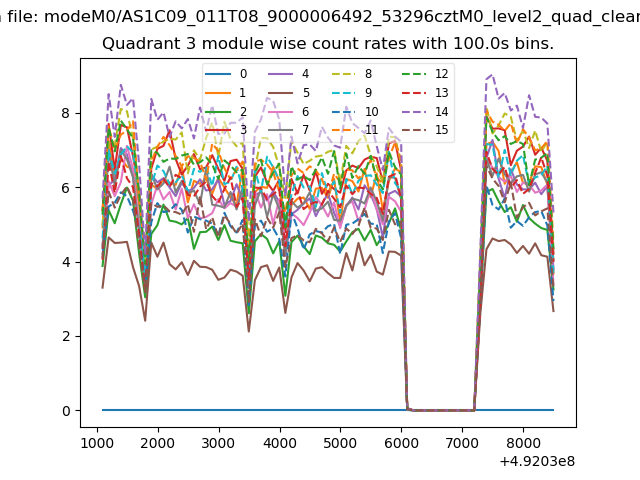
| Module-wise count rates for Quadrant A Data is divided into 100 sec bins |
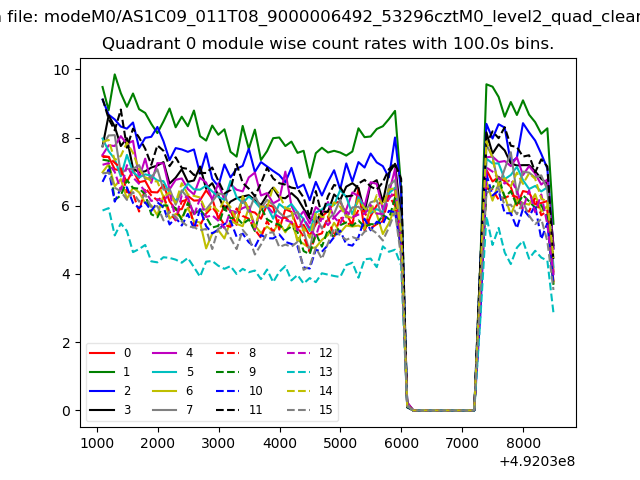 |
 |
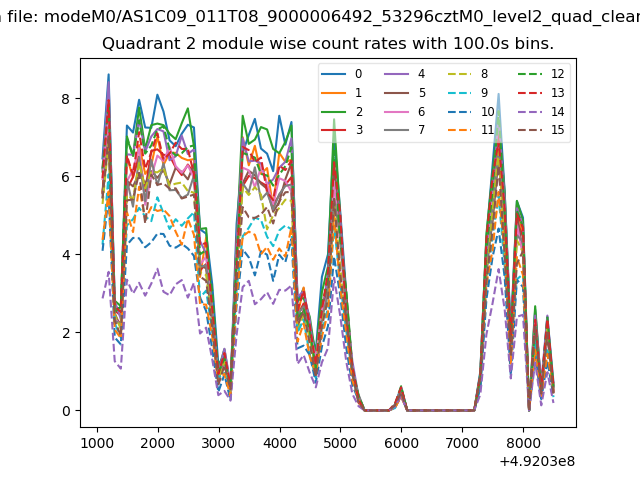
| Module-wise count rates for Quadrant B Data is divided into 100 sec bins |
 |
 |
| Module-wise count rates for Quadrant C Data is divided into 100 sec bins |
 |
 |
| Module-wise count rates for Quadrant D Data is divided into 100 sec bins |
 |
 |
| Parameter | Plot |
|---|---|
| CZT HV Monitor | 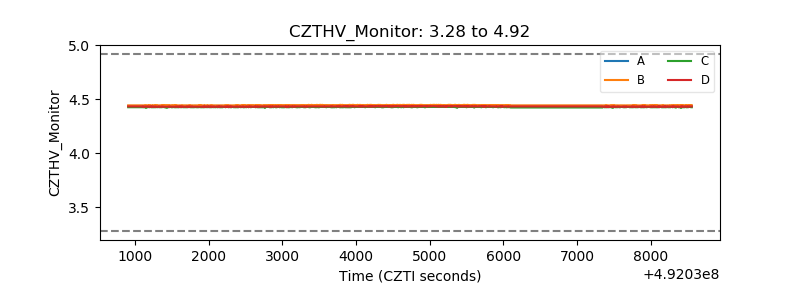 |
| D_VDD | 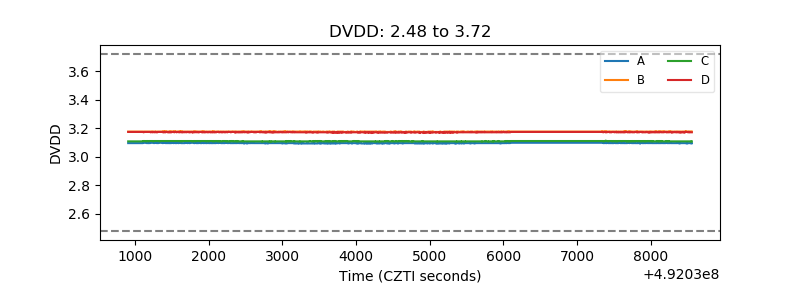 |
| Temperature 1 | 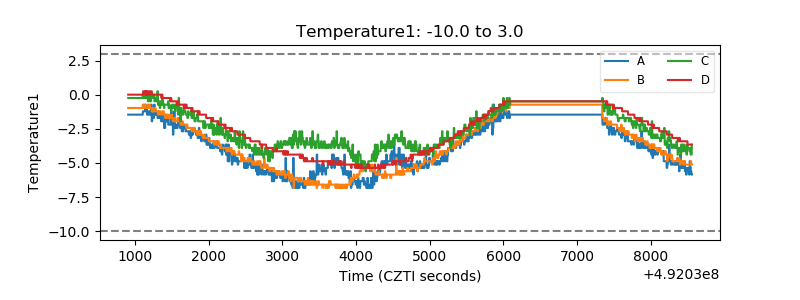 |
| Veto HV Monitor | 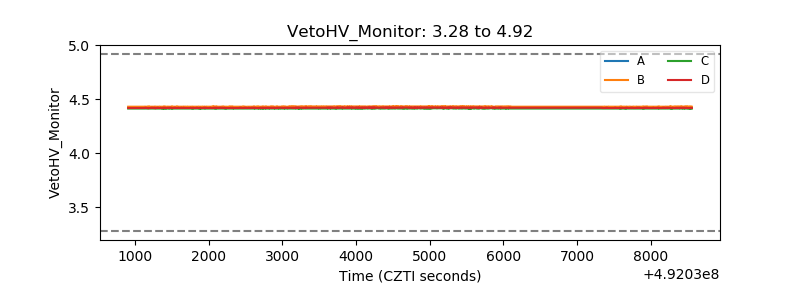 |
| Veto LLD | 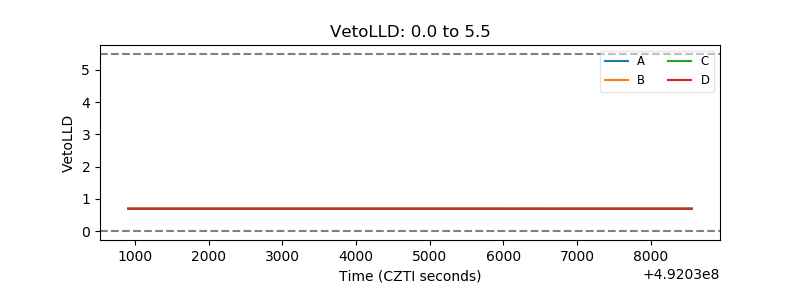 |
| Alpha Counter | 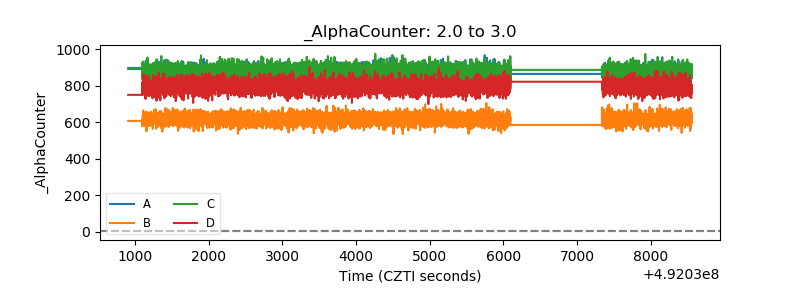 |
| _CPM_Rate | 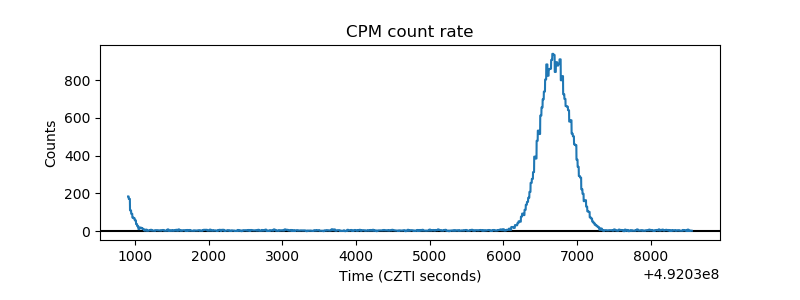 |
| CZT Counter | 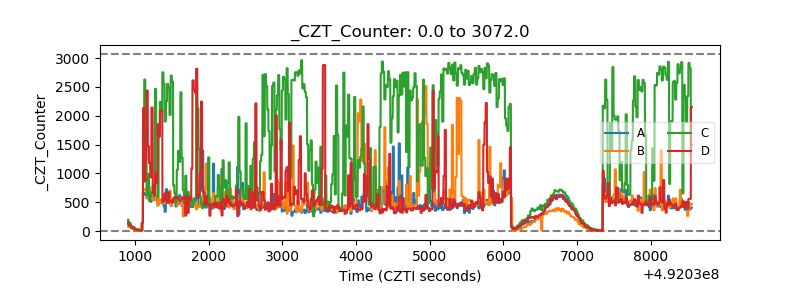 |
| +2.5 Volts monitor |  |
| +5 Volts monitor |  |
| _ROLL_ROT | 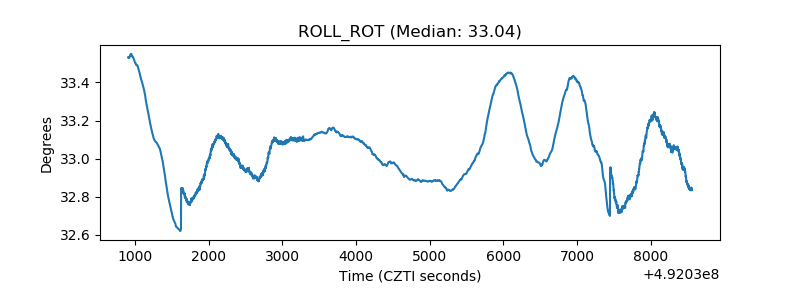 |
| _Roll_DEC | 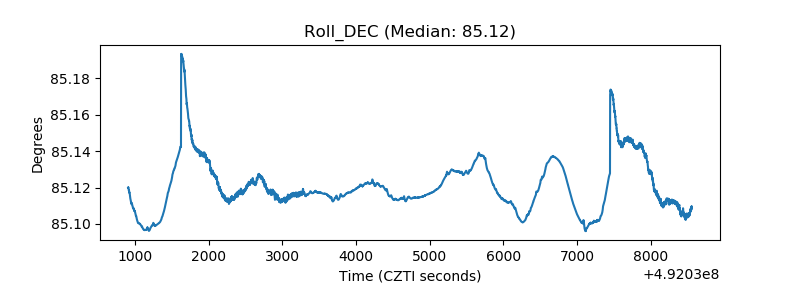 |
| _Roll_RA | 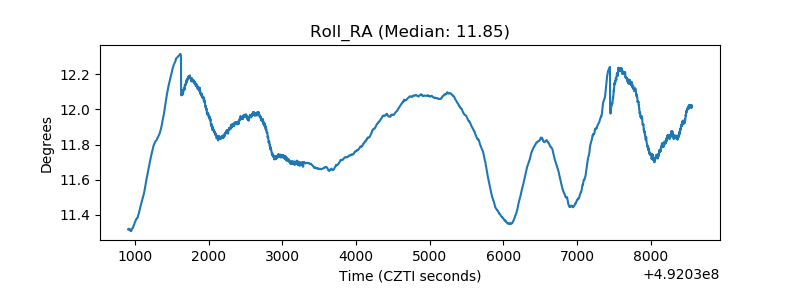 |
| Veto Counter | 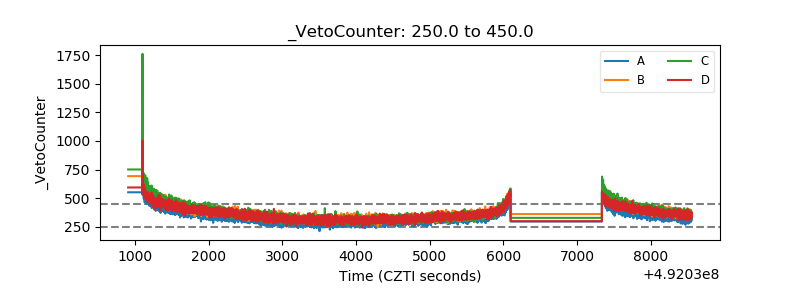 |