| Param | Original file | Final file |
|---|---|---|
| Filename | modeM0/AS1C09_011T08_9000006492_53297cztM0_level2.fits | modeM0/AS1C09_011T08_9000006492_53297cztM0_level2_quad_clean.evt |
| Size (bytes) | 594,210,240 | 88,974,720 |
| Size | 566.7 MB | 84.9 MB |
| Events in quadrant A | 3,123,514 | 632,529 |
| Events in quadrant B | 4,132,191 | 672,254 |
| Events in quadrant C | 10,618,414 | 366,360 |
| Events in quadrant D | 3,623,357 | 575,367 |
| Mode M0 | |||
|---|---|---|---|
| Quadrant | BADHDUFLAG | Total packets | Discarded packets |
| A | 0 | 14096 | 2 |
| B | 0 | 16714 | 3 |
| C | 0 | 35849 | 2 |
| D | 0 | 15471 | 2 |
| Mode M9 | |||
|---|---|---|---|
| Quadrant | BADHDUFLAG | Total packets | Discarded packets |
| A | 0 | 19 | 0 |
| B | 0 | 20 | 0 |
| C | 0 | 20 | 0 |
| D | 0 | 20 | 0 |
| Mode SS | |||
|---|---|---|---|
| Quadrant | BADHDUFLAG | Total packets | Discarded packets |
| A | 0 | 130 | 0 |
| B | 0 | 130 | 0 |
| C | 0 | 130 | 0 |
| D | 0 | 130 | 0 |
| Quadrant | Total seconds | Saturated seconds | Saturation percentage |
|---|---|---|---|
| A | 6418 | 77 | 1.199751% |
| B | 6417 | 247 | 3.849151% |
| C | 6417 | 2815 | 43.867851% |
| D | 6417 | 110 | 1.714197% |
Noise dominated data is calculated using 1-second bins in cleaned event files. If a bin has >2000 counts, and if more than 50% of those come from <1% of pixels, then it is considered to be noise-dominated and hence unusable.
| Quadrant | # 1 sec bins | Bins with >0 counts | Bins with >2000 counts | High rate bins dominated by noise | Noise dominated (total time) | Noise dominated (detector-on time) | Marked lightcurve |
|---|---|---|---|---|---|---|---|
| A | 7588 | 6419 | 40 | 40 | 0.53% | 0.62% | 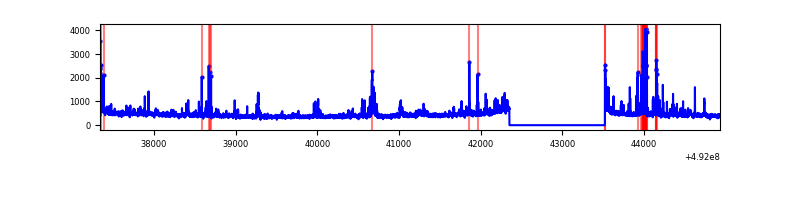 |
| B | 7587 | 6418 | 128 | 128 | 1.69% | 1.99% | 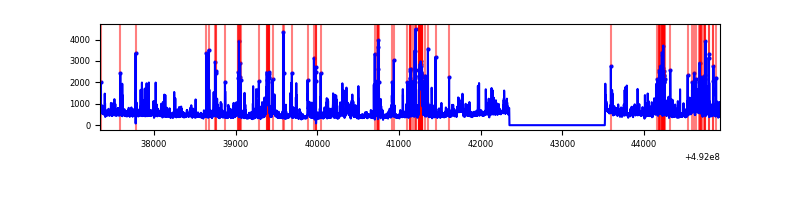 |
| C | 7587 | 6418 | 2516 | 2516 | 33.16% | 39.20% | 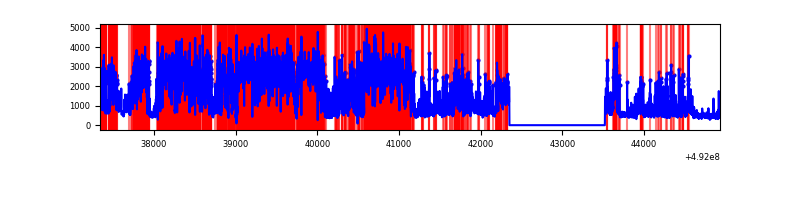 |
| D | 7587 | 6418 | 85 | 85 | 1.12% | 1.32% | 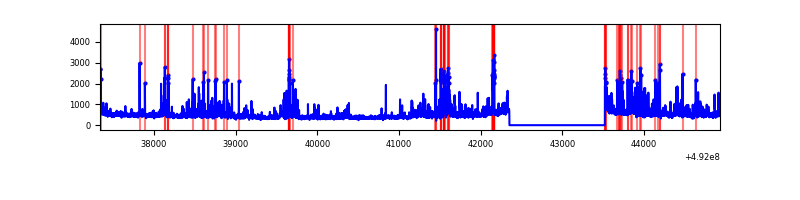 |
Top three noisy pixels from each quadrant. If the there are fewer than three noisy pixels in the level2.evt file, extra rows are filled as -1
| Pixel properties | Quadrant properties | ||||||
|---|---|---|---|---|---|---|---|
| Quadrant | DetID | PixID | Counts | Sigma | Mean | Median | Sigma |
| A | 0 | 8 | 141069 | 837.83 | 673 | 657 | 167.6 |
| A | 7 | 206 | 77998 | 461.49 | 673 | 657 | 167.6 |
| A | 15 | 174 | 72422 | 428.22 | 673 | 657 | 167.6 |
| B | 2 | 249 | 308889 | 2185.05 | 669 | 646 | 141.1 |
| B | 10 | 28 | 228305 | 1613.81 | 669 | 646 | 141.1 |
| B | 4 | 206 | 225855 | 1596.44 | 669 | 646 | 141.1 |
| C | 1 | 241 | 6159317 | 43757.06 | 510 | 507 | 140.8 |
| C | 15 | 224 | 1290319 | 9163.84 | 510 | 507 | 140.8 |
| C | 9 | 38 | 567874 | 4031.02 | 510 | 507 | 140.8 |
| D | 13 | 170 | 144455 | 772.32 | 655 | 628 | 186.2 |
| D | 3 | 12 | 139503 | 745.73 | 655 | 628 | 186.2 |
| D | 6 | 239 | 125700 | 671.61 | 655 | 628 | 186.2 |
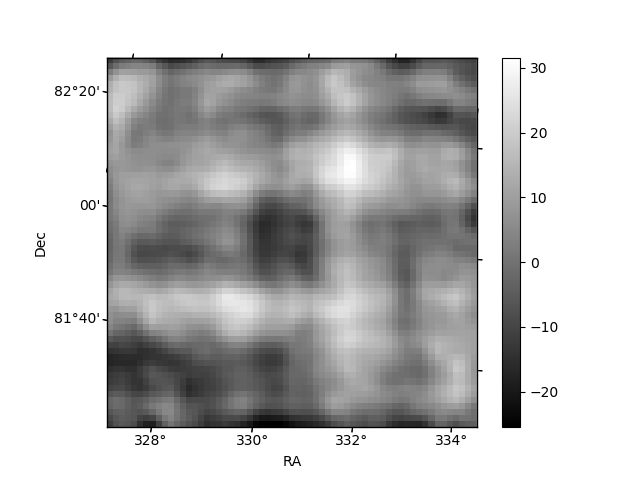
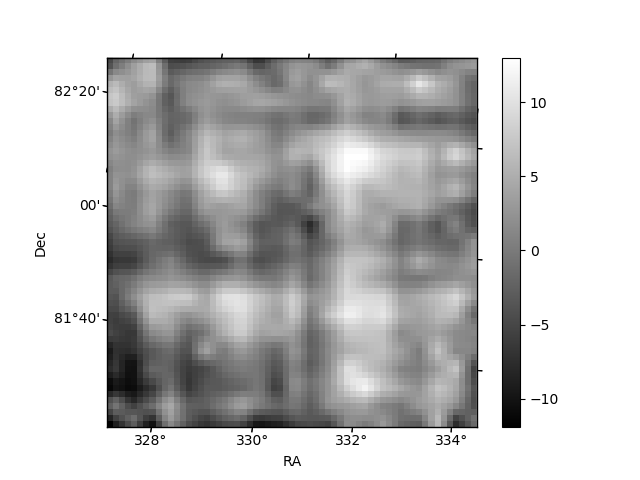
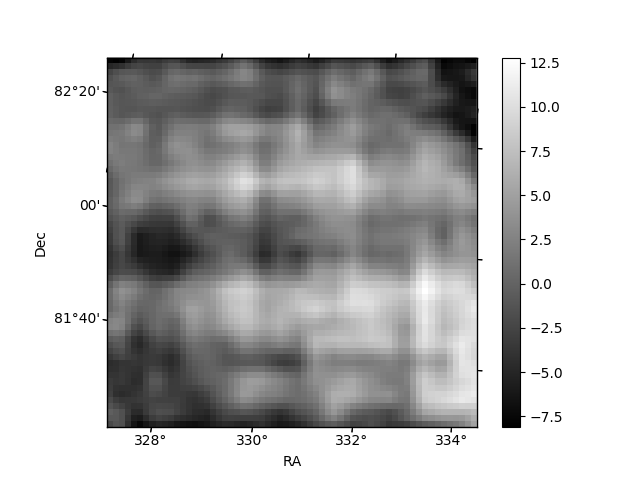
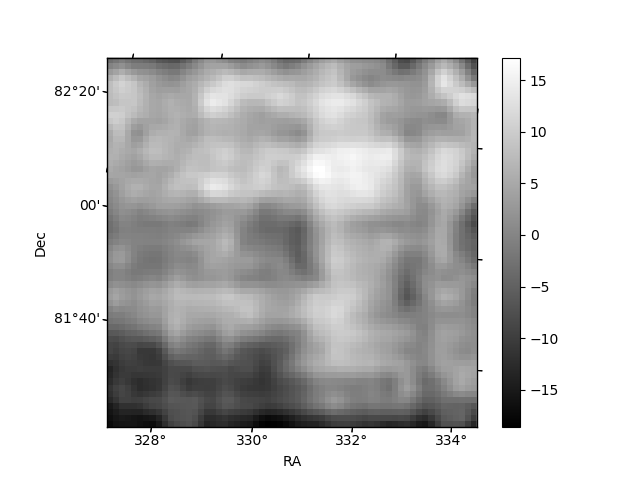
Histogram calculated using DETX and DETY for each event in the final _common_clean file
| Quadrant A | 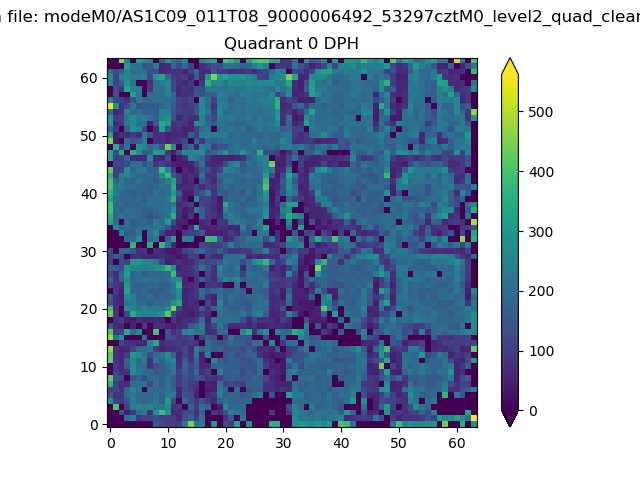 |
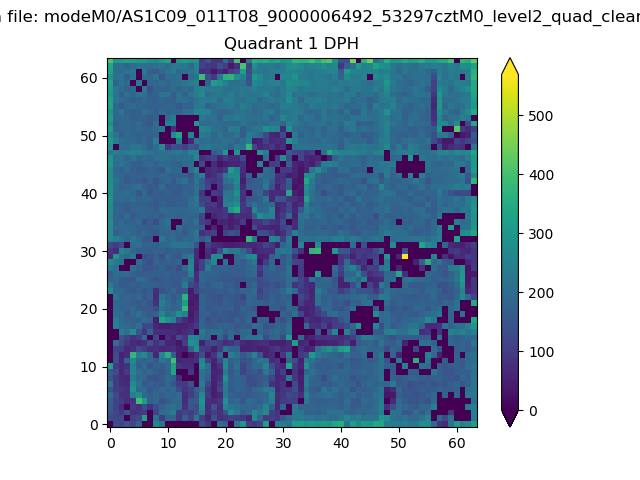 |
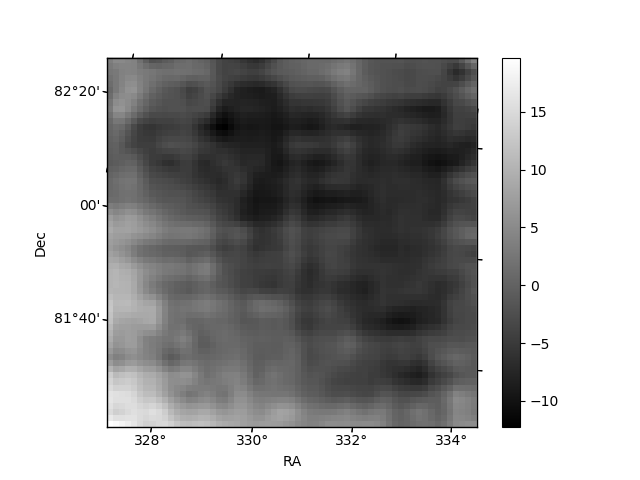
Quadrant B |
|---|---|---|---|
| Quadrant D | 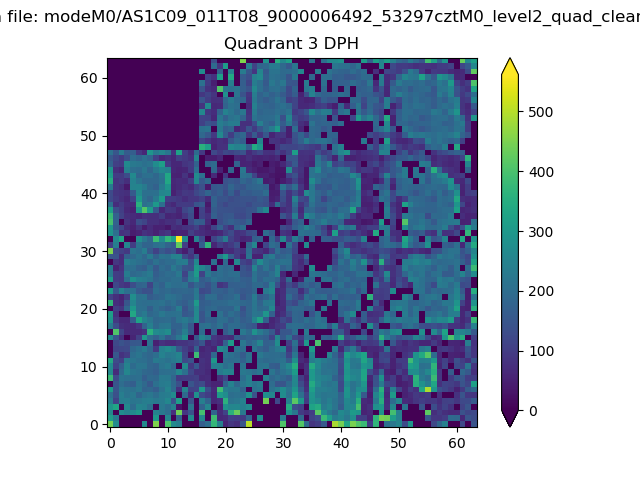 |
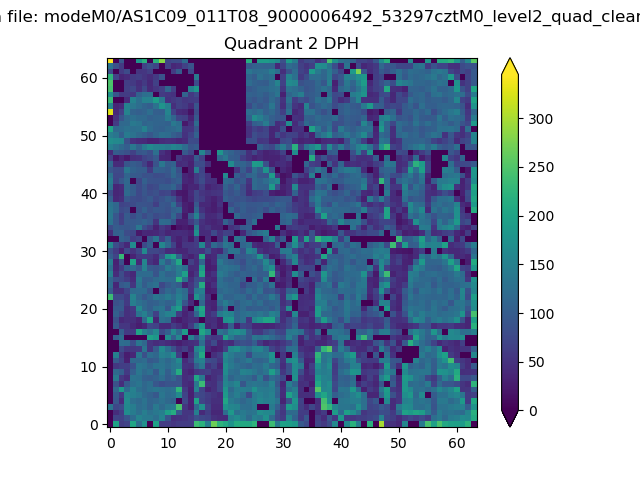 |
Quadrant C |
| Plot type | Count rate plots | Images |
|---|---|---|
| Comparison with Poisson distribution Blue bars denote a histogram of data divided into 1 sec bins. Red curve is a Poisson curve with rate = median count rate of data. |
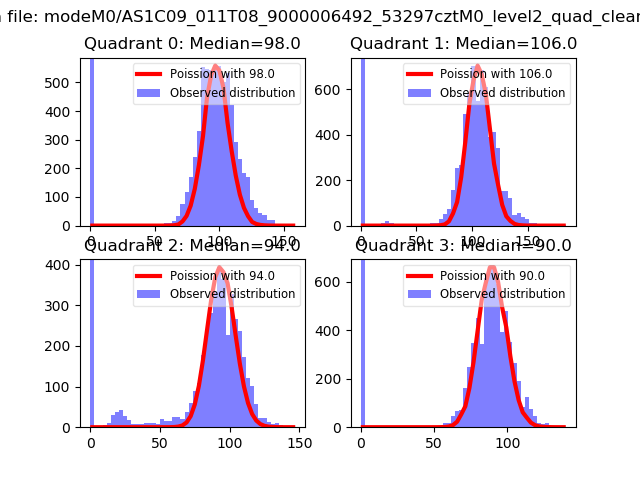 |
 |
| Quadrant-wise count rates Data is divided into 100 sec bins |
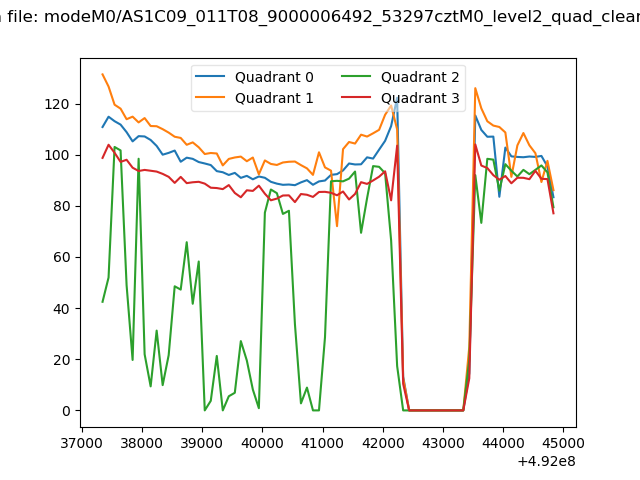 |
|
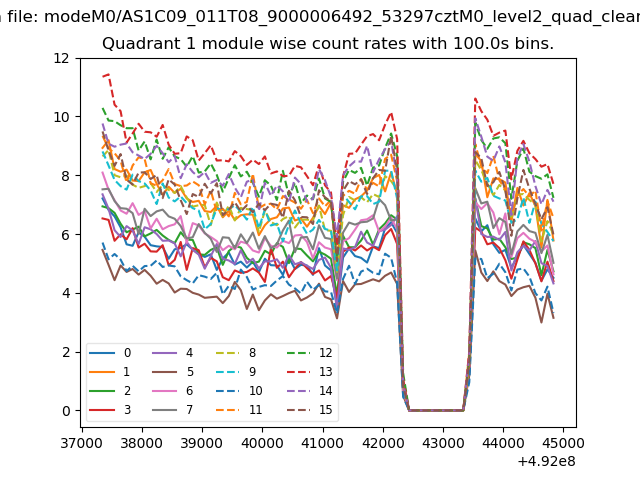
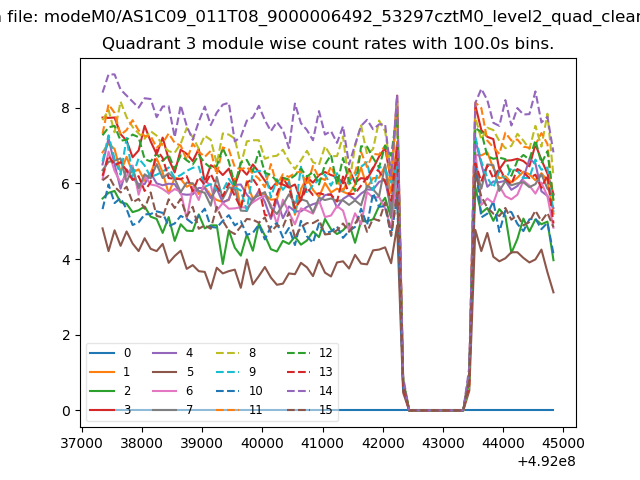
| Module-wise count rates for Quadrant A Data is divided into 100 sec bins |
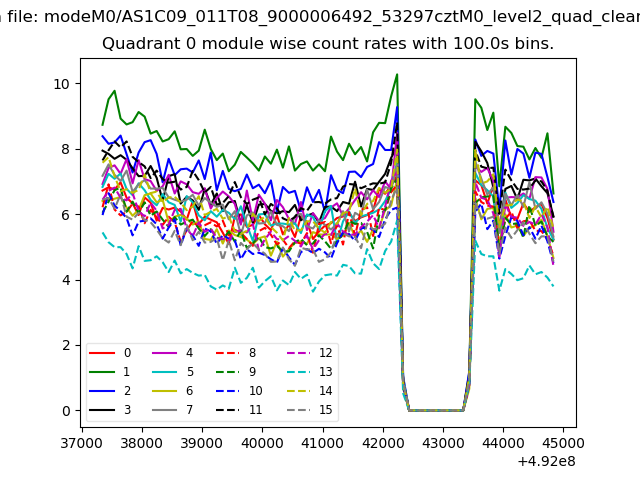 |
 |
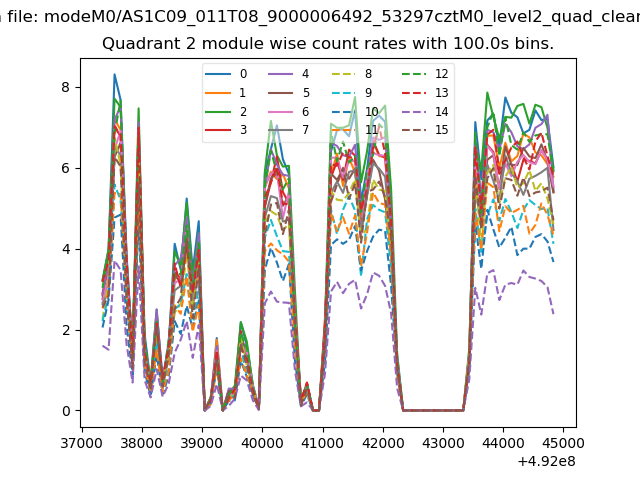
| Module-wise count rates for Quadrant B Data is divided into 100 sec bins |
 |
 |
| Module-wise count rates for Quadrant C Data is divided into 100 sec bins |
 |
 |
| Module-wise count rates for Quadrant D Data is divided into 100 sec bins |
 |
 |
| Parameter | Plot |
|---|---|
| CZT HV Monitor | 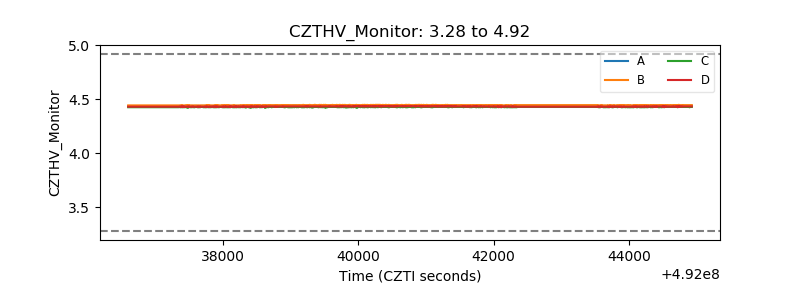 |
| D_VDD | 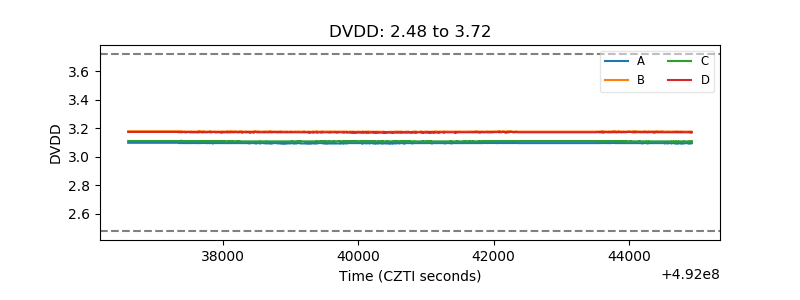 |
| Temperature 1 | 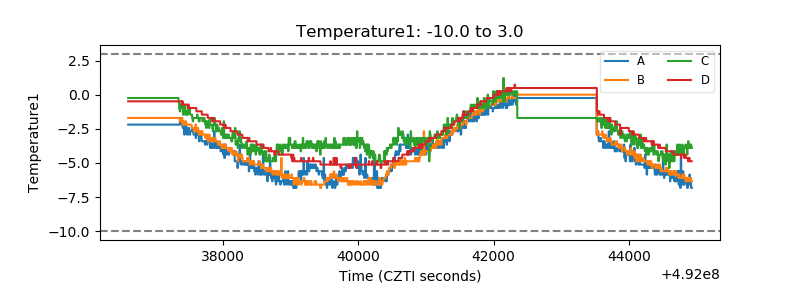 |
| Veto HV Monitor | 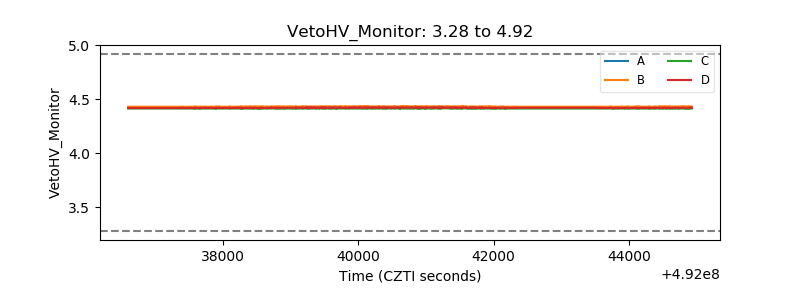 |
| Veto LLD | 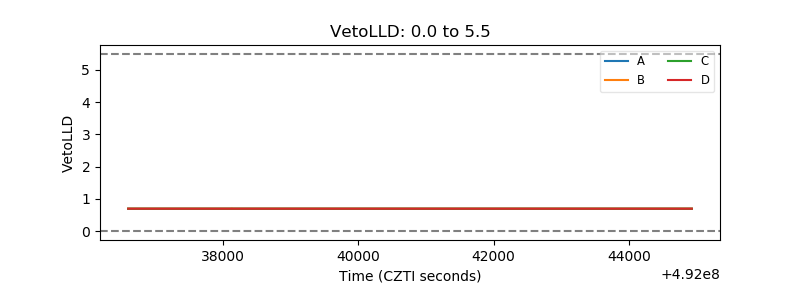 |
| Alpha Counter |  |
| _CPM_Rate | 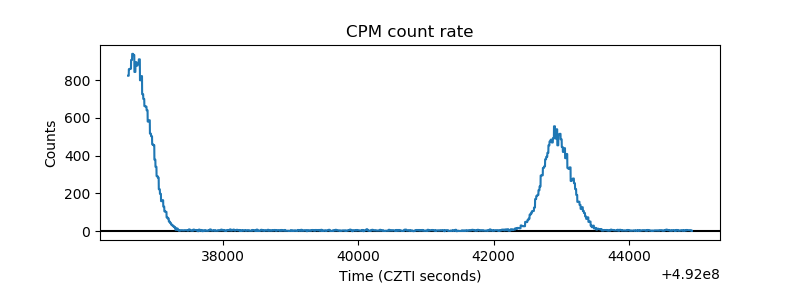 |
| CZT Counter | 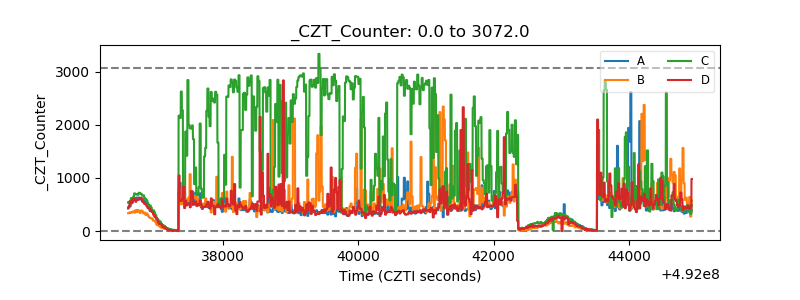 |
| +2.5 Volts monitor |  |
| +5 Volts monitor |  |
| _ROLL_ROT | 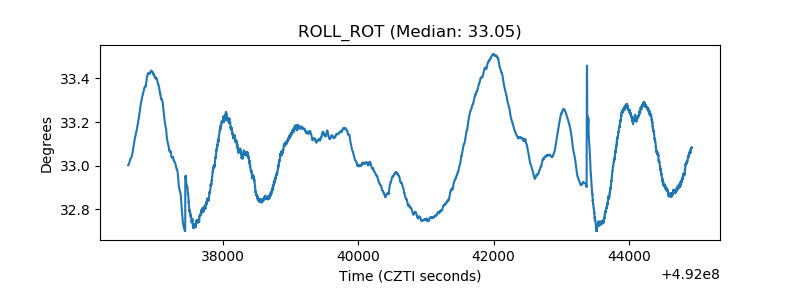 |
| _Roll_DEC | 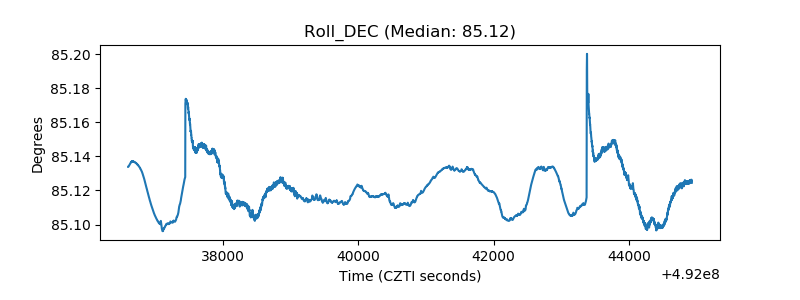 |
| _Roll_RA | 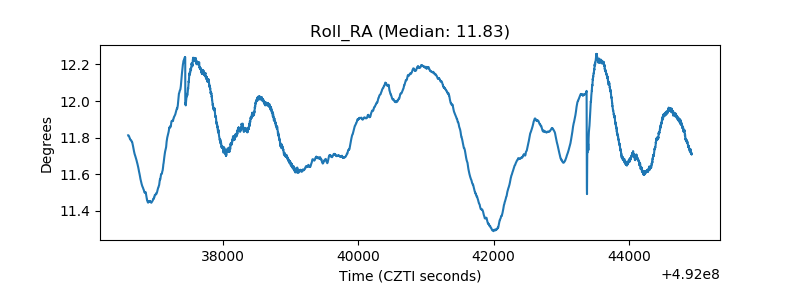 |
| Veto Counter | 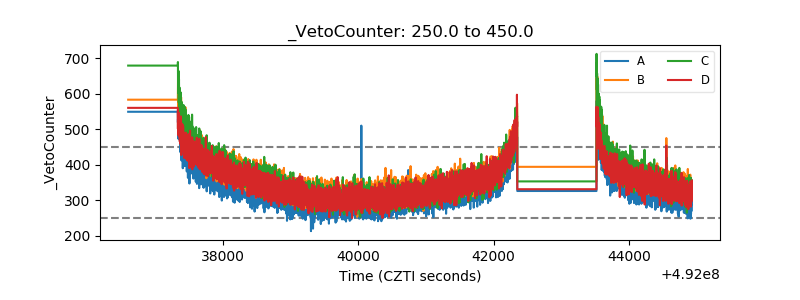 |