| Param | Original file | Final file |
|---|---|---|
| Filename | modeM0/AS1C09_011T08_9000006492_53298cztM0_level2.fits | modeM0/AS1C09_011T08_9000006492_53298cztM0_level2_quad_clean.evt |
| Size (bytes) | 575,248,320 | 94,714,560 |
| Size | 548.6 MB | 90.3 MB |
| Events in quadrant A | 4,226,581 | 619,906 |
| Events in quadrant B | 4,875,314 | 675,413 |
| Events in quadrant C | 7,642,126 | 528,324 |
| Events in quadrant D | 4,031,267 | 578,320 |
| Mode M0 | |||
|---|---|---|---|
| Quadrant | BADHDUFLAG | Total packets | Discarded packets |
| A | 0 | 17719 | 2 |
| B | 0 | 19105 | 2 |
| C | 0 | 27295 | 2 |
| D | 0 | 17050 | 2 |
| Mode M9 | |||
|---|---|---|---|
| Quadrant | BADHDUFLAG | Total packets | Discarded packets |
| A | 0 | 22 | 0 |
| B | 0 | 22 | 0 |
| C | 0 | 22 | 0 |
| D | 0 | 22 | 0 |
| Mode SS | |||
|---|---|---|---|
| Quadrant | BADHDUFLAG | Total packets | Discarded packets |
| A | 0 | 136 | 0 |
| B | 0 | 136 | 0 |
| C | 0 | 136 | 0 |
| D | 0 | 136 | 0 |
| Quadrant | Total seconds | Saturated seconds | Saturation percentage |
|---|---|---|---|
| A | 6685 | 374 | 5.594615% |
| B | 6685 | 333 | 4.981301% |
| C | 6686 | 1197 | 17.903081% |
| D | 6686 | 195 | 2.916542% |
Noise dominated data is calculated using 1-second bins in cleaned event files. If a bin has >2000 counts, and if more than 50% of those come from <1% of pixels, then it is considered to be noise-dominated and hence unusable.
| Quadrant | # 1 sec bins | Bins with >0 counts | Bins with >2000 counts | High rate bins dominated by noise | Noise dominated (total time) | Noise dominated (detector-on time) | Marked lightcurve |
|---|---|---|---|---|---|---|---|
| A | 8880 | 6687 | 279 | 279 | 3.14% | 4.17% | 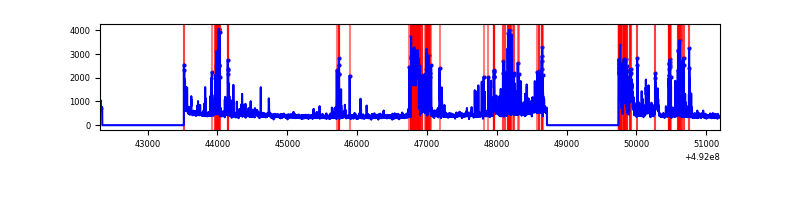 |
| B | 8880 | 6687 | 166 | 166 | 1.87% | 2.48% | 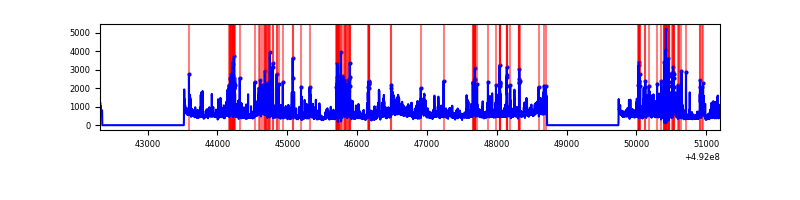 |
| C | 8881 | 6688 | 1070 | 1070 | 12.05% | 16.00% | 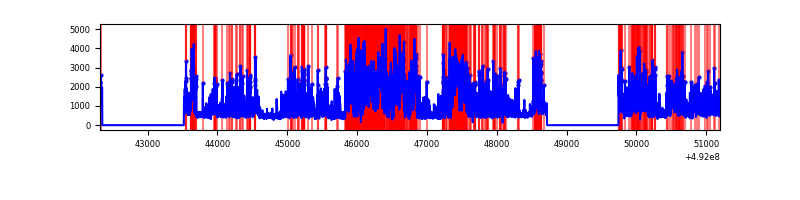 |
| D | 8881 | 6688 | 137 | 137 | 1.54% | 2.05% | 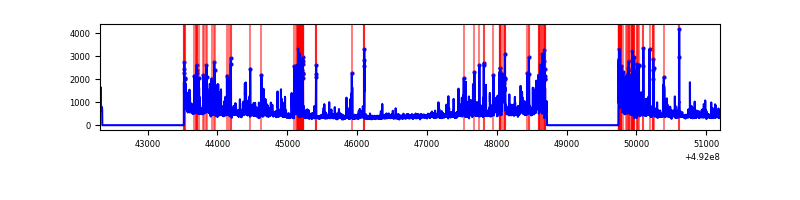 |
Top three noisy pixels from each quadrant. If the there are fewer than three noisy pixels in the level2.evt file, extra rows are filled as -1
| Pixel properties | Quadrant properties | ||||||
|---|---|---|---|---|---|---|---|
| Quadrant | DetID | PixID | Counts | Sigma | Mean | Median | Sigma |
| A | 15 | 174 | 594951 | 3520.06 | 679 | 661 | 168.8 |
| A | 8 | 231 | 414421 | 2450.75 | 679 | 661 | 168.8 |
| A | 0 | 8 | 213352 | 1259.8 | 679 | 661 | 168.8 |
| B | 4 | 81 | 460580 | 3191.52 | 683 | 657 | 144.1 |
| B | 10 | 28 | 419009 | 2903.05 | 683 | 657 | 144.1 |
| B | 4 | 206 | 338955 | 2347.54 | 683 | 657 | 144.1 |
| C | 1 | 241 | 2093517 | 12068.45 | 627 | 622 | 173.4 |
| C | 15 | 224 | 1896409 | 10931.84 | 627 | 622 | 173.4 |
| C | 15 | 178 | 305412 | 1757.54 | 627 | 622 | 173.4 |
| D | 11 | 245 | 395735 | 2062.41 | 666 | 636 | 191.6 |
| D | 13 | 170 | 169730 | 882.67 | 666 | 636 | 191.6 |
| D | 3 | 12 | 146512 | 761.47 | 666 | 636 | 191.6 |
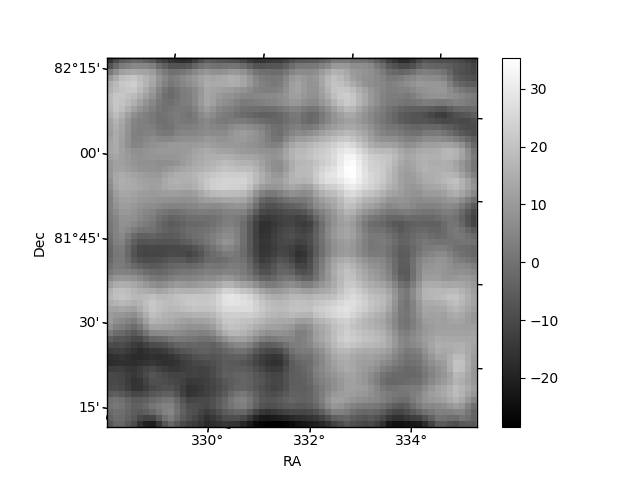
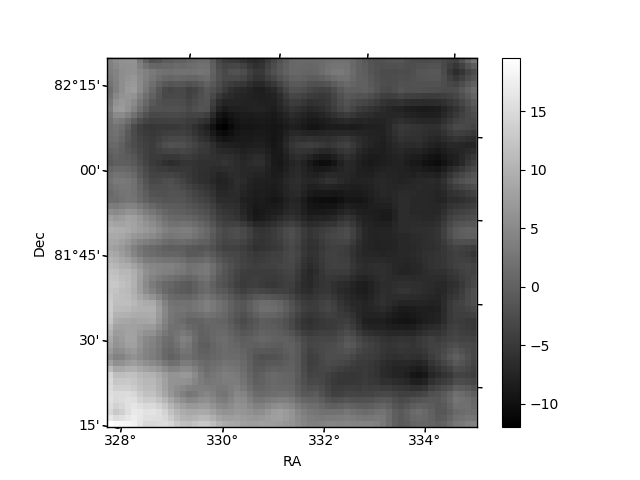
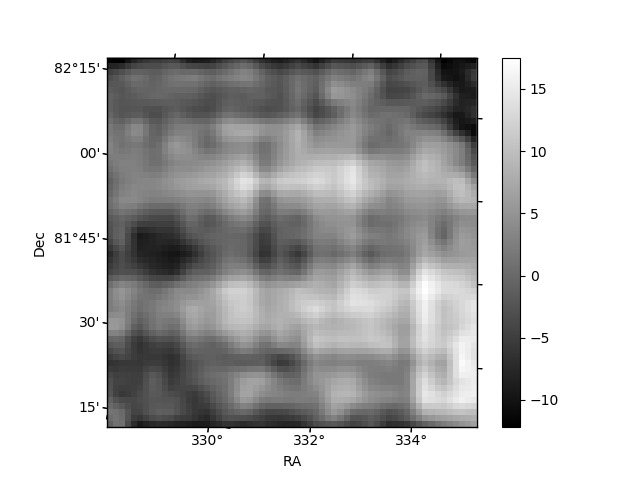
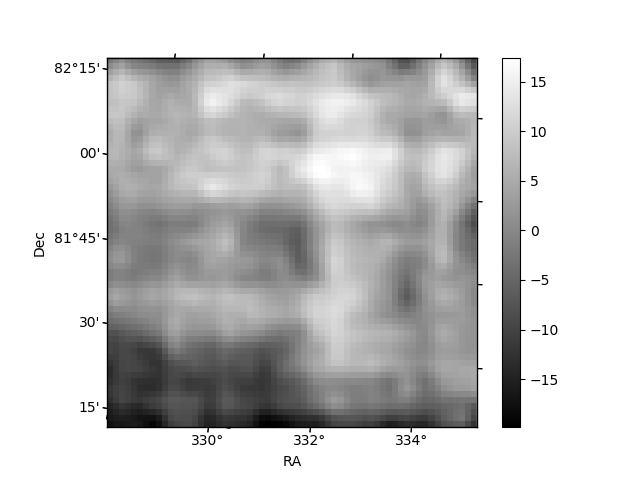
Histogram calculated using DETX and DETY for each event in the final _common_clean file
| Quadrant A | 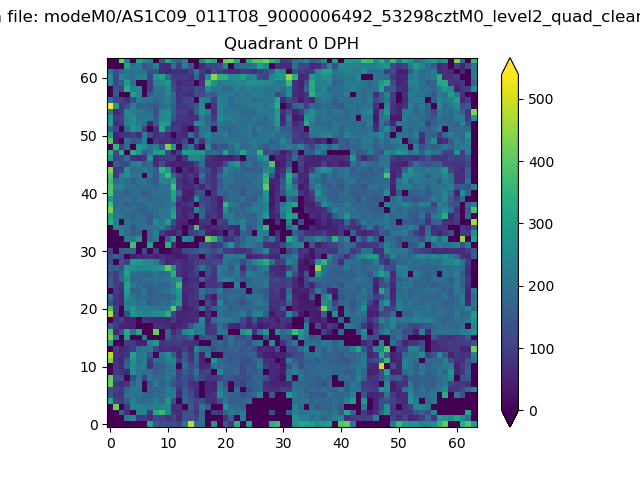 |
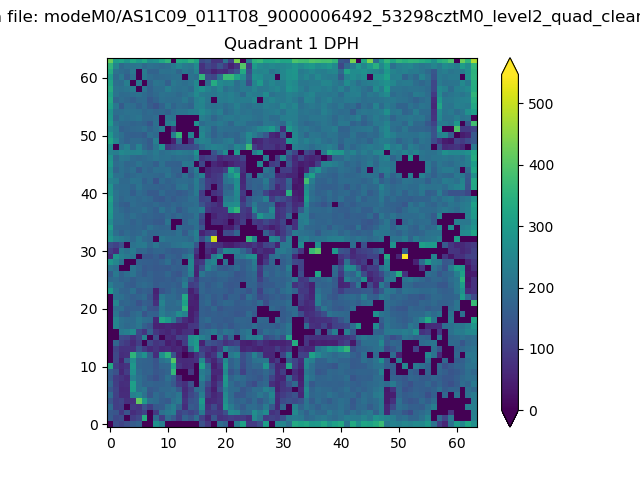 |
Quadrant B |
|---|---|---|---|
| Quadrant D |  |
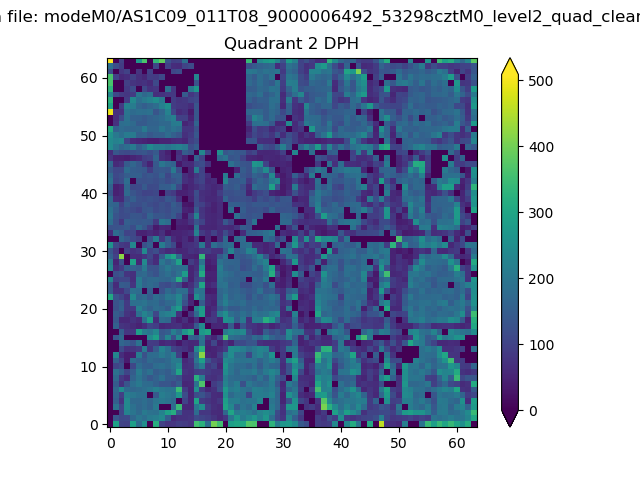 |
Quadrant C |
| Plot type | Count rate plots | Images |
|---|---|---|
| Comparison with Poisson distribution Blue bars denote a histogram of data divided into 1 sec bins. Red curve is a Poisson curve with rate = median count rate of data. |
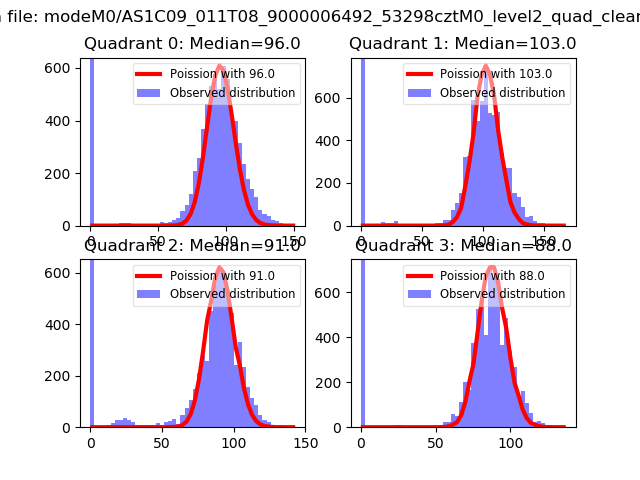 |
 |
| Quadrant-wise count rates Data is divided into 100 sec bins |
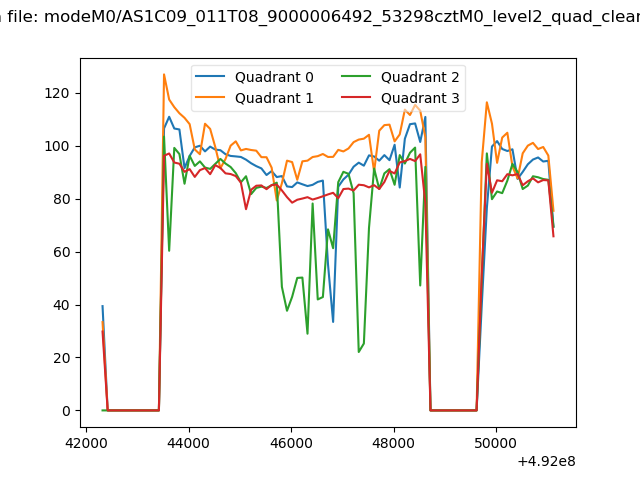 |
|
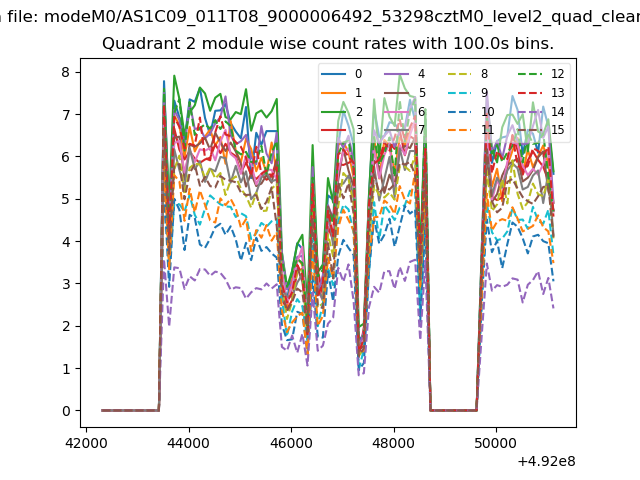
| Module-wise count rates for Quadrant A Data is divided into 100 sec bins |
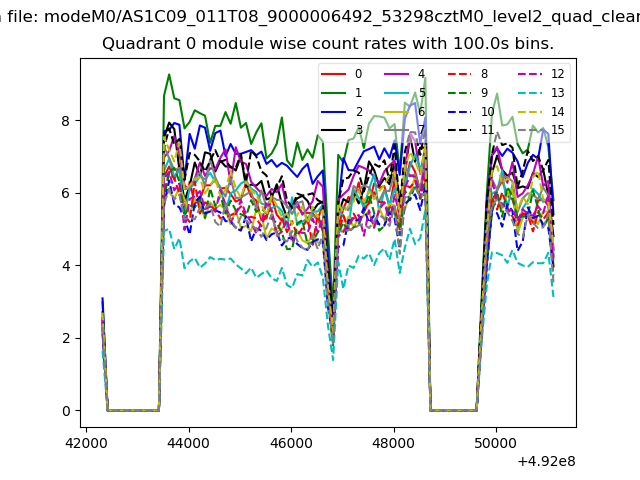 |
 |
| Module-wise count rates for Quadrant B Data is divided into 100 sec bins |
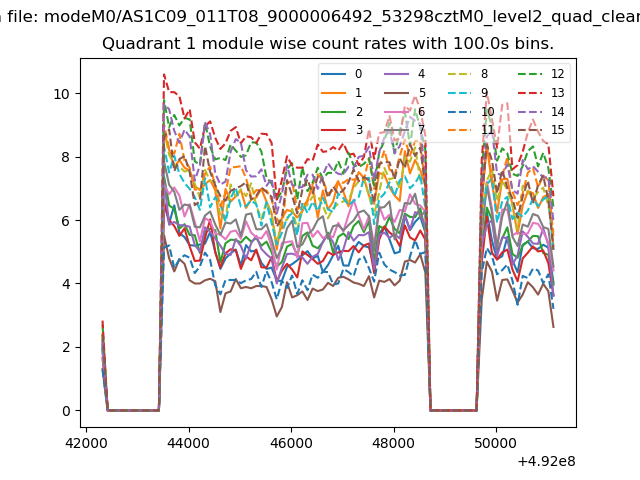 |
 |
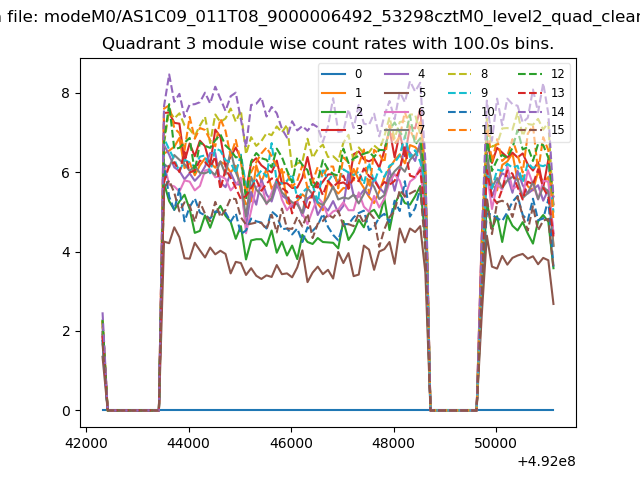
| Module-wise count rates for Quadrant C Data is divided into 100 sec bins |
 |
 |
| Module-wise count rates for Quadrant D Data is divided into 100 sec bins |
 |
 |
| Parameter | Plot |
|---|---|
| CZT HV Monitor | 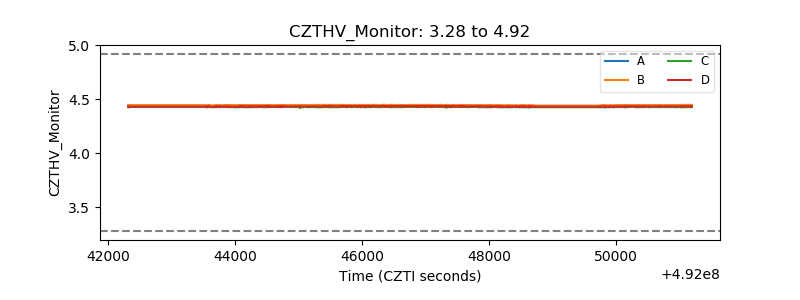 |
| D_VDD | 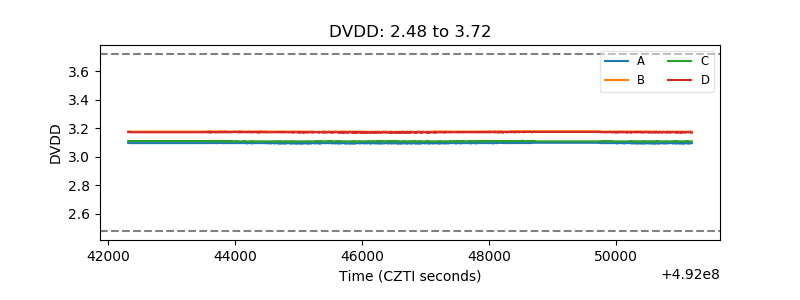 |
| Temperature 1 | 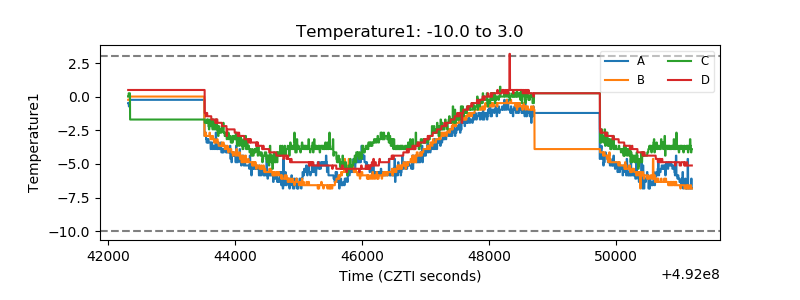 |
| Veto HV Monitor | 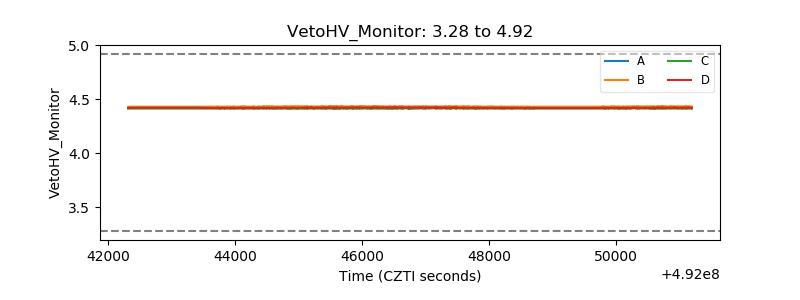 |
| Veto LLD | 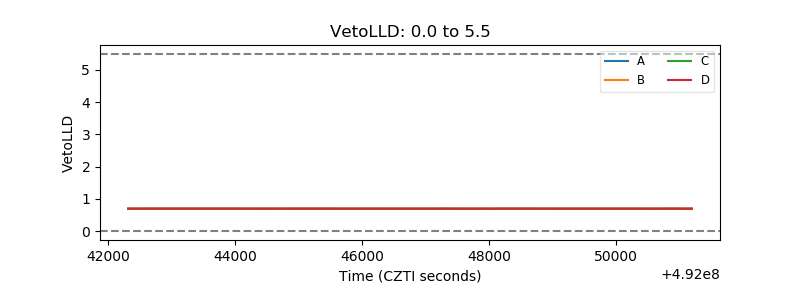 |
| Alpha Counter | 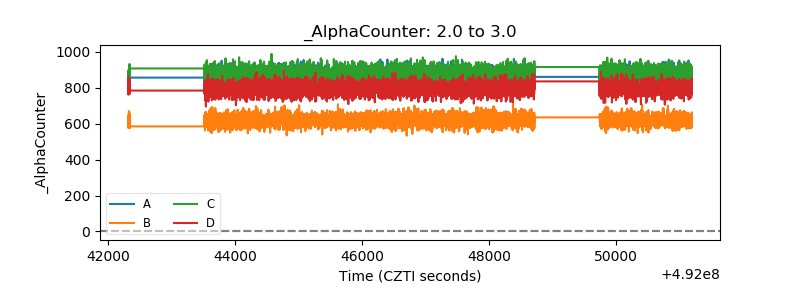 |
| _CPM_Rate | 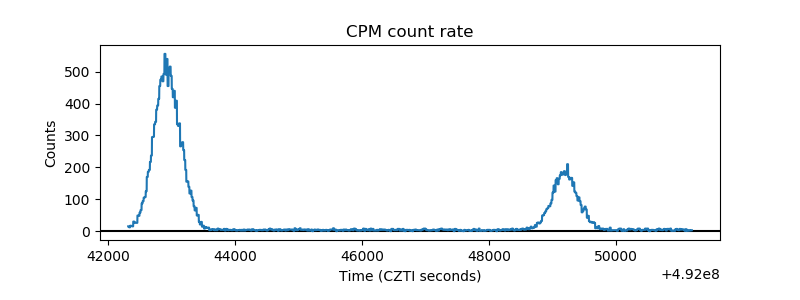 |
| CZT Counter | 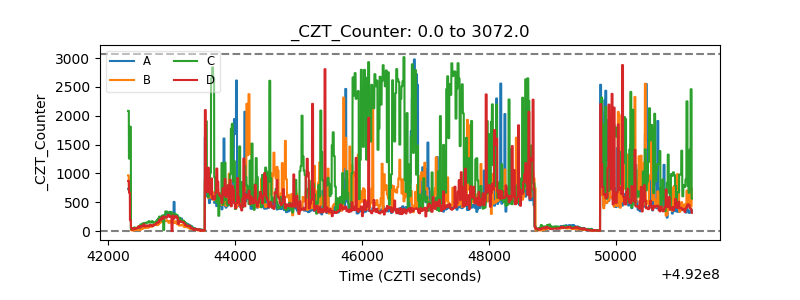 |
| +2.5 Volts monitor |  |
| +5 Volts monitor |  |
| _ROLL_ROT | 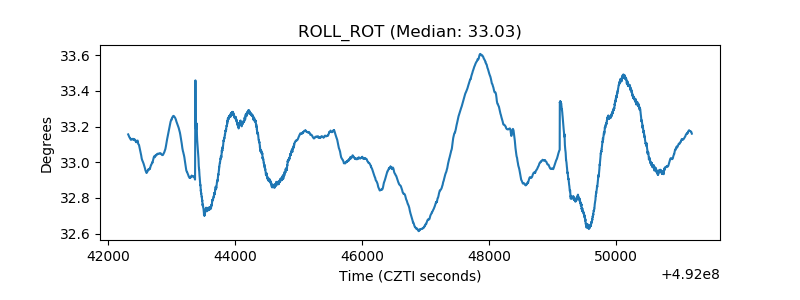 |
| _Roll_DEC | 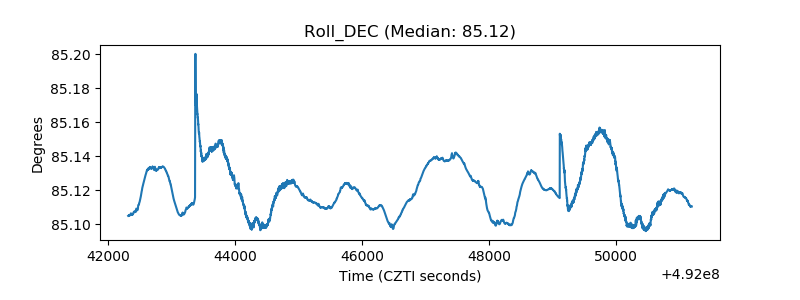 |
| _Roll_RA | 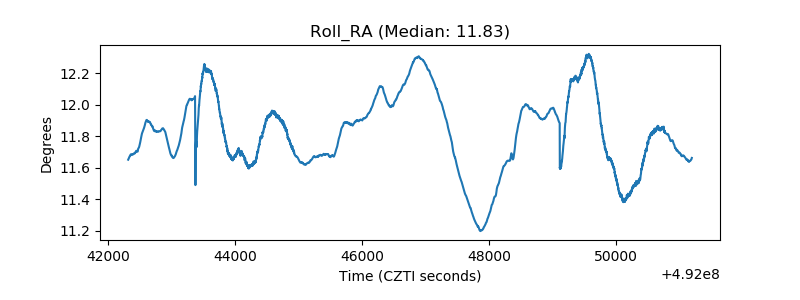 |
| Veto Counter | 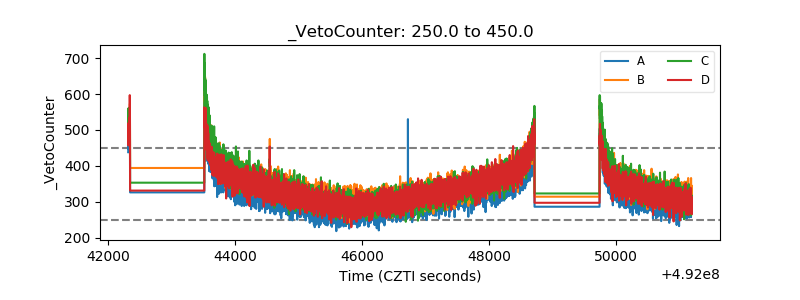 |