| Param | Original file | Final file |
|---|---|---|
| Filename | modeM0/AS1C09_011T08_9000006492_53300cztM0_level2.fits | modeM0/AS1C09_011T08_9000006492_53300cztM0_level2_quad_clean.evt |
| Size (bytes) | 812,836,800 | 104,135,040 |
| Size | 775.2 MB | 99.3 MB |
| Events in quadrant A | 3,902,717 | 745,109 |
| Events in quadrant B | 8,624,828 | 670,353 |
| Events in quadrant C | 11,384,441 | 516,145 |
| Events in quadrant D | 5,559,271 | 667,141 |
| Mode M0 | |||
|---|---|---|---|
| Quadrant | BADHDUFLAG | Total packets | Discarded packets |
| A | 0 | 17760 | 1 |
| B | 0 | 31253 | 1 |
| C | 0 | 39290 | 1 |
| D | 0 | 22340 | 1 |
| Mode M9 | |||
|---|---|---|---|
| Quadrant | BADHDUFLAG | Total packets | Discarded packets |
| A | 0 | 7 | 0 |
| B | 0 | 7 | 0 |
| C | 0 | 7 | 0 |
| D | 0 | 7 | 0 |
| Mode SS | |||
|---|---|---|---|
| Quadrant | BADHDUFLAG | Total packets | Discarded packets |
| A | 0 | 160 | 0 |
| B | 0 | 160 | 0 |
| C | 0 | 160 | 0 |
| D | 0 | 160 | 0 |
| Quadrant | Total seconds | Saturated seconds | Saturation percentage |
|---|---|---|---|
| A | 7972 | 139 | 1.743603% |
| B | 7973 | 1632 | 20.469083% |
| C | 7973 | 2564 | 32.158535% |
| D | 7973 | 344 | 4.314562% |
Noise dominated data is calculated using 1-second bins in cleaned event files. If a bin has >2000 counts, and if more than 50% of those come from <1% of pixels, then it is considered to be noise-dominated and hence unusable.
| Quadrant | # 1 sec bins | Bins with >0 counts | Bins with >2000 counts | High rate bins dominated by noise | Noise dominated (total time) | Noise dominated (detector-on time) | Marked lightcurve |
|---|---|---|---|---|---|---|---|
| A | 8607 | 7973 | 64 | 64 | 0.74% | 0.80% | 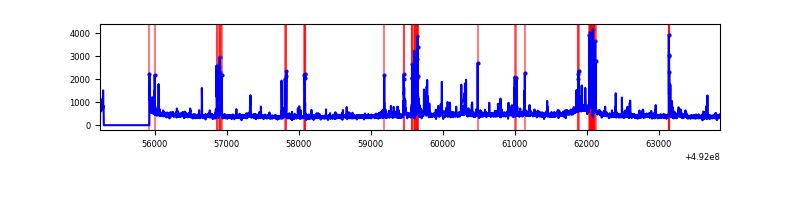 |
| B | 8608 | 7974 | 1005 | 1005 | 11.68% | 12.60% |  |
| C | 8608 | 7974 | 2305 | 2305 | 26.78% | 28.91% | 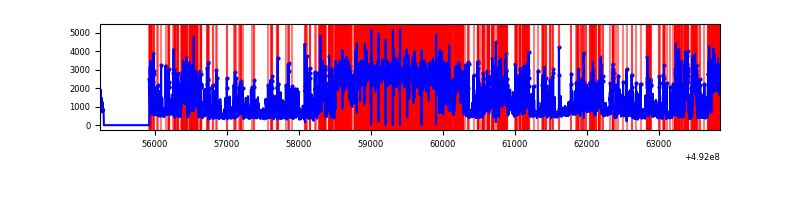 |
| D | 8608 | 7974 | 252 | 252 | 2.93% | 3.16% | 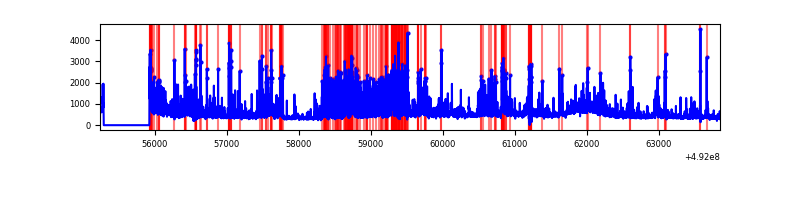 |
Top three noisy pixels from each quadrant. If the there are fewer than three noisy pixels in the level2.evt file, extra rows are filled as -1
| Pixel properties | Quadrant properties | ||||||
|---|---|---|---|---|---|---|---|
| Quadrant | DetID | PixID | Counts | Sigma | Mean | Median | Sigma |
| A | 4 | 249 | 160501 | 769.81 | 830 | 805 | 207.4 |
| A | 0 | 8 | 128225 | 614.23 | 830 | 805 | 207.4 |
| A | 7 | 206 | 97726 | 467.21 | 830 | 805 | 207.4 |
| B | 4 | 206 | 3974941 | 24472.15 | 766 | 741 | 162.4 |
| B | 4 | 81 | 756009 | 4650.75 | 766 | 741 | 162.4 |
| B | 10 | 28 | 258681 | 1588.33 | 766 | 741 | 162.4 |
| C | 1 | 241 | 5383336 | 28982.32 | 680 | 672 | 185.7 |
| C | 15 | 224 | 1700604 | 9153.08 | 680 | 672 | 185.7 |
| C | 15 | 178 | 295586 | 1587.93 | 680 | 672 | 185.7 |
| D | 13 | 46 | 750981 | 3314.05 | 794 | 757 | 226.4 |
| D | 6 | 239 | 572198 | 2524.29 | 794 | 757 | 226.4 |
| D | 2 | 249 | 264105 | 1163.32 | 794 | 757 | 226.4 |
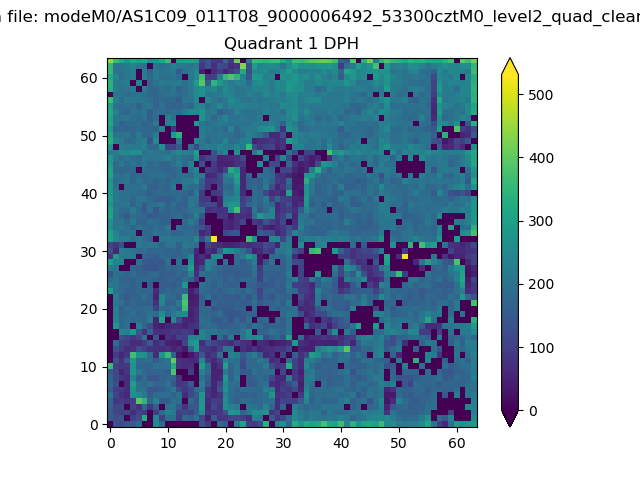
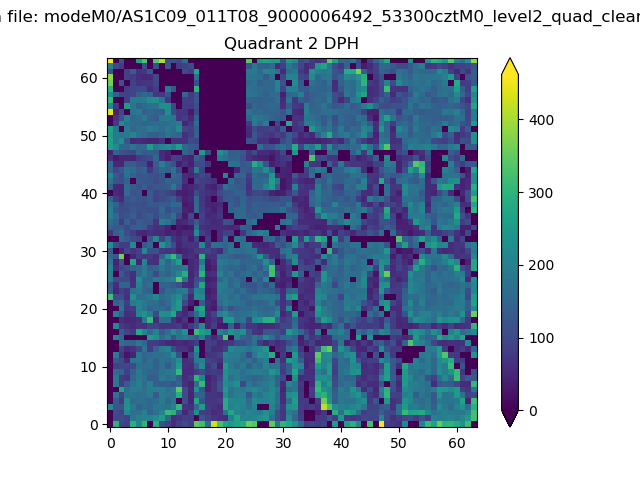
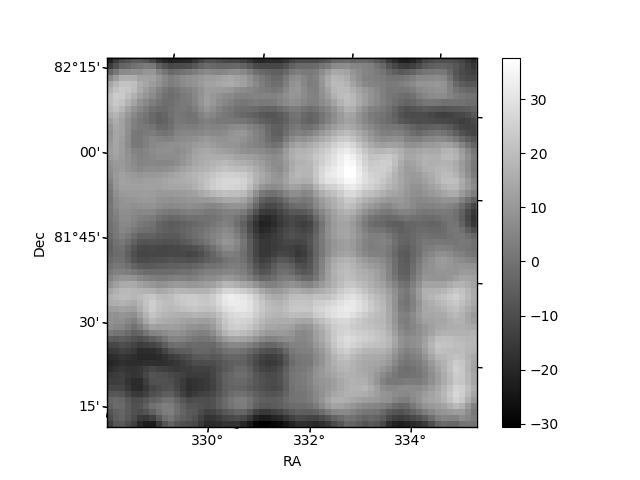
Histogram calculated using DETX and DETY for each event in the final _common_clean file
| Quadrant A | 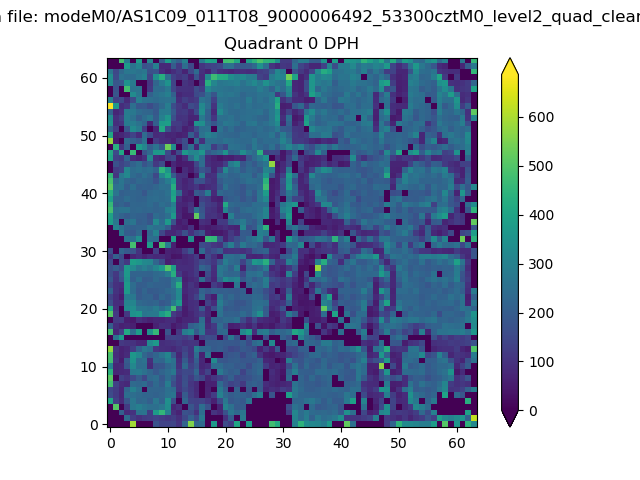 |
 |
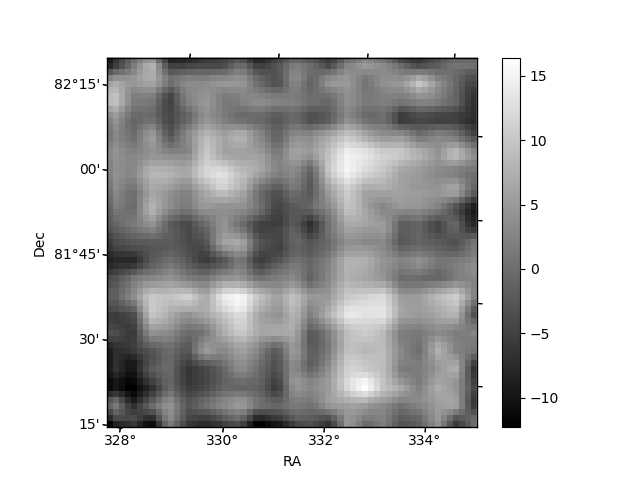
Quadrant B |
|---|---|---|---|
| Quadrant D | 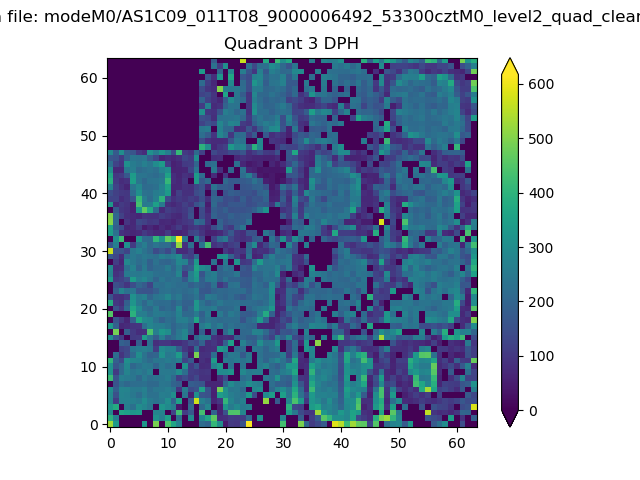 |
 |
Quadrant C |
| Plot type | Count rate plots | Images |
|---|---|---|
| Comparison with Poisson distribution Blue bars denote a histogram of data divided into 1 sec bins. Red curve is a Poisson curve with rate = median count rate of data. |
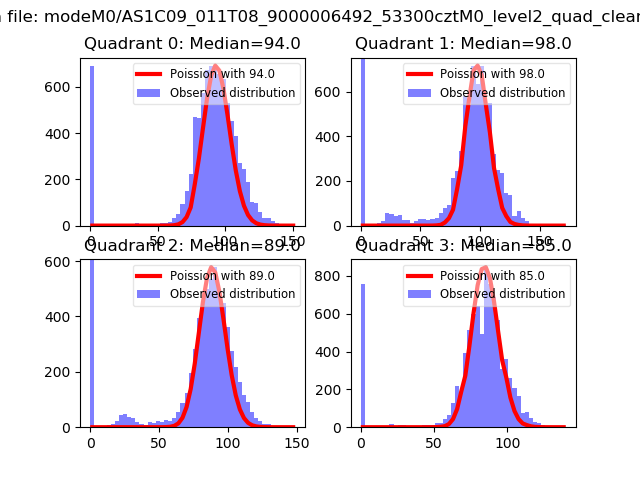 |
 |
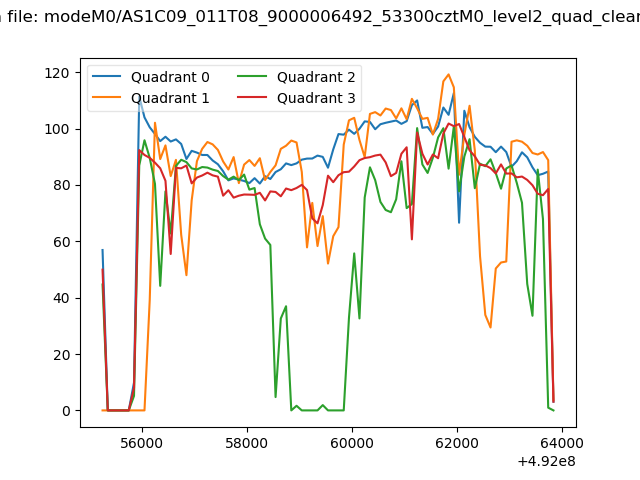
| Quadrant-wise count rates Data is divided into 100 sec bins |
 |
|
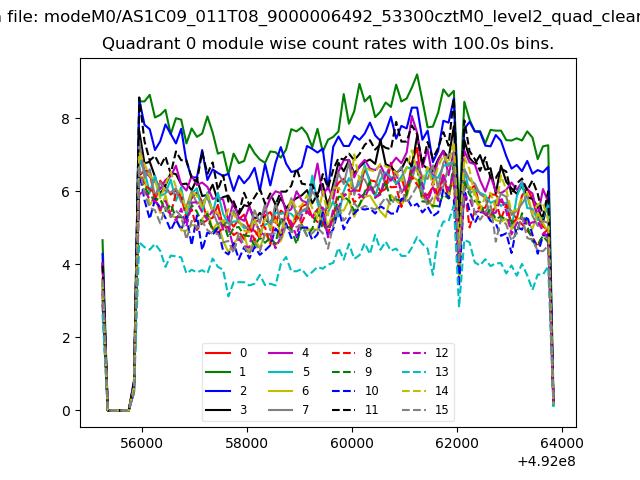
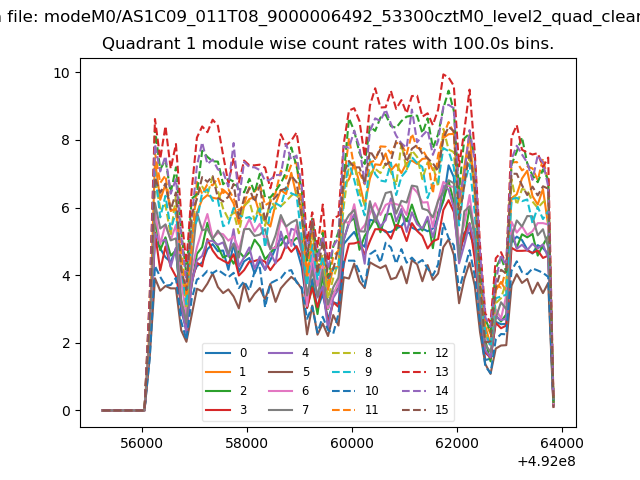
| Module-wise count rates for Quadrant A Data is divided into 100 sec bins |
 |
 |
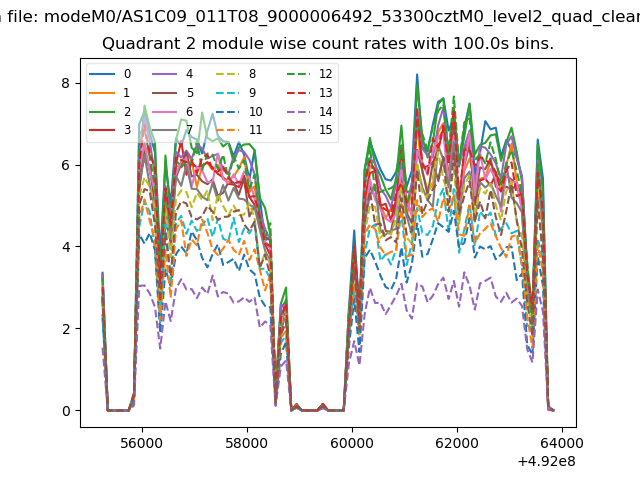
| Module-wise count rates for Quadrant B Data is divided into 100 sec bins |
 |
 |
| Module-wise count rates for Quadrant C Data is divided into 100 sec bins |
 |
 |
| Module-wise count rates for Quadrant D Data is divided into 100 sec bins |
 |
 |
| Parameter | Plot |
|---|---|
| CZT HV Monitor | 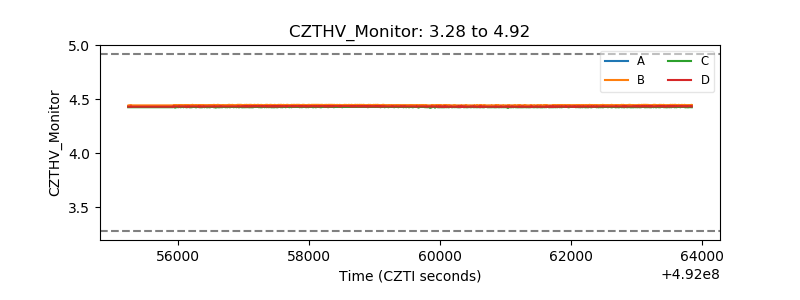 |
| D_VDD | 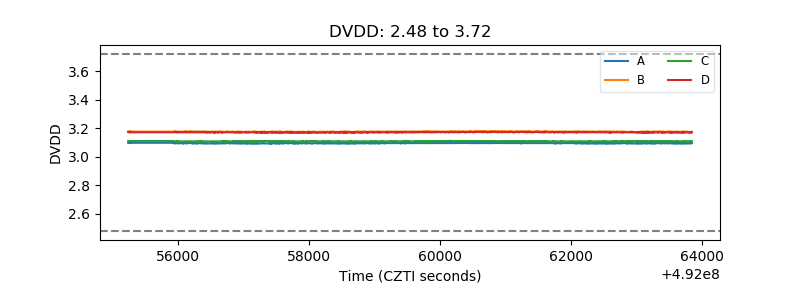 |
| Temperature 1 | 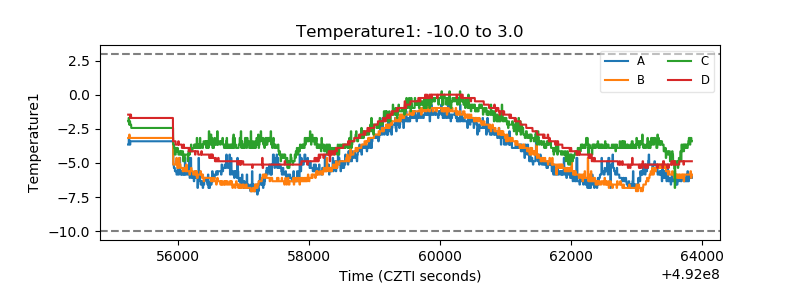 |
| Veto HV Monitor | 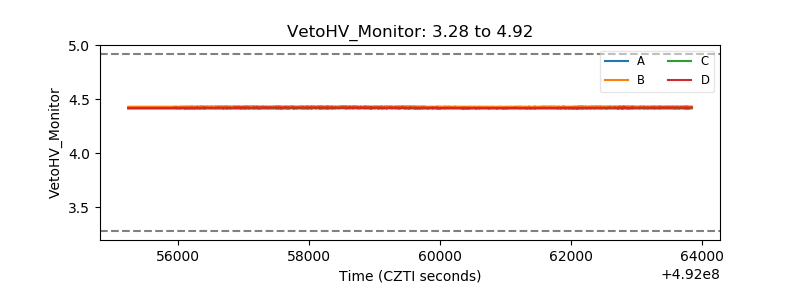 |
| Veto LLD | 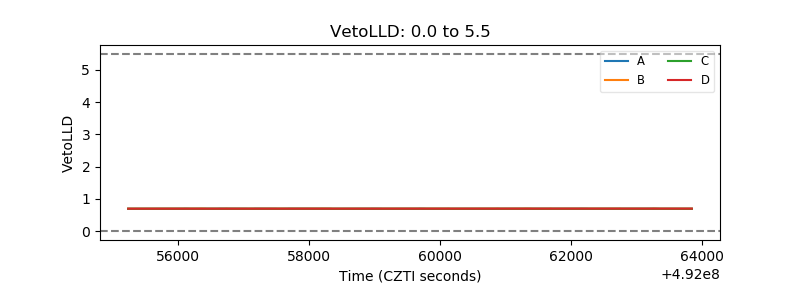 |
| Alpha Counter | 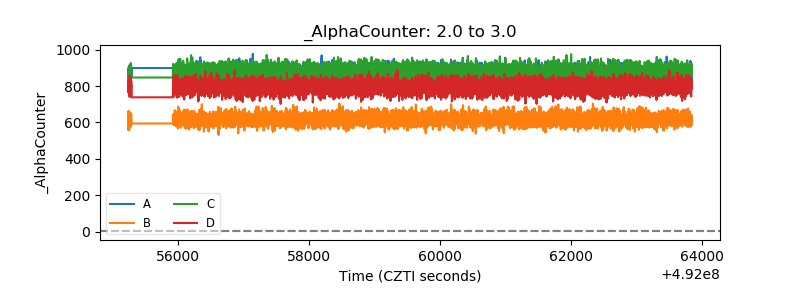 |
| _CPM_Rate | 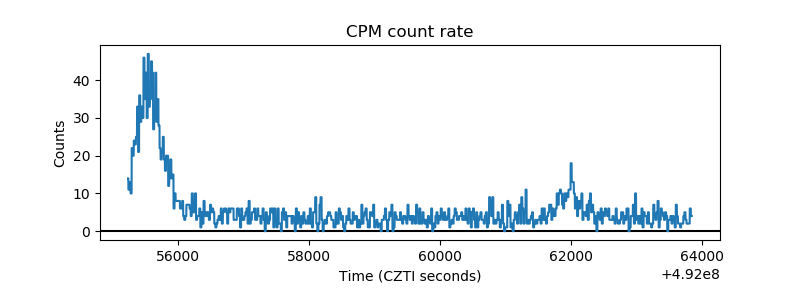 |
| CZT Counter | 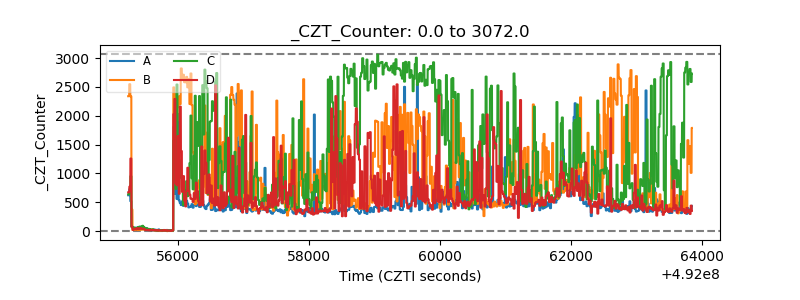 |
| +2.5 Volts monitor |  |
| +5 Volts monitor |  |
| _ROLL_ROT | 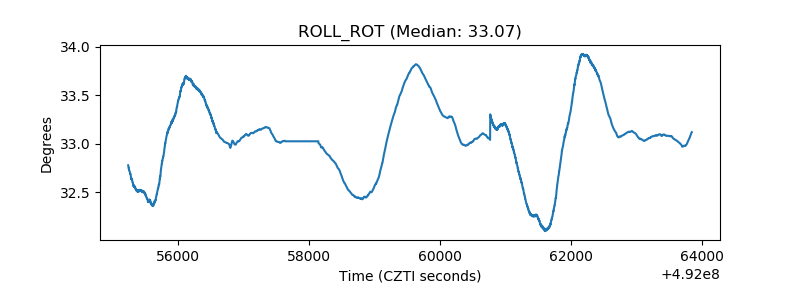 |
| _Roll_DEC | 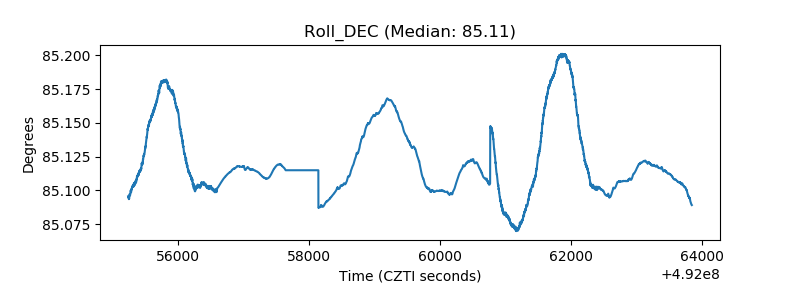 |
| _Roll_RA | 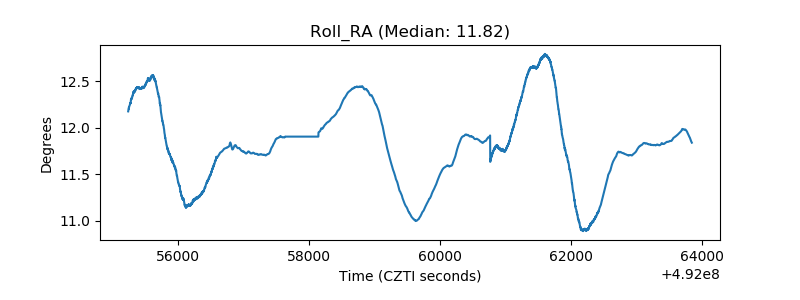 |
| Veto Counter | 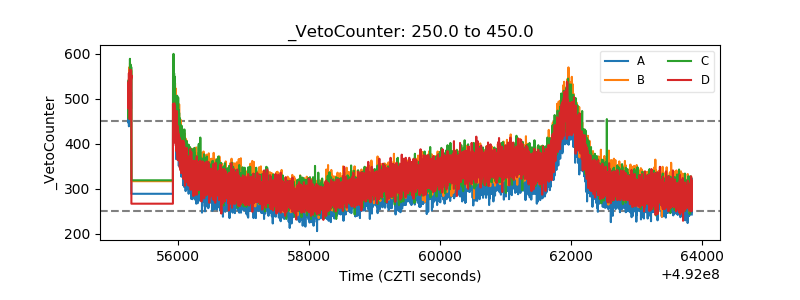 |