| Param | Original file | Final file |
|---|---|---|
| Filename | modeM0/AS1C09_011T08_9000006492_53301cztM0_level2.fits | modeM0/AS1C09_011T08_9000006492_53301cztM0_level2_quad_clean.evt |
| Size (bytes) | 737,700,480 | 88,536,960 |
| Size | 703.5 MB | 84.4 MB |
| Events in quadrant A | 3,507,783 | 644,278 |
| Events in quadrant B | 5,201,367 | 659,730 |
| Events in quadrant C | 12,895,141 | 320,491 |
| Events in quadrant D | 5,163,495 | 570,782 |
| Mode M0 | |||
|---|---|---|---|
| Quadrant | BADHDUFLAG | Total packets | Discarded packets |
| A | 0 | 15647 | 0 |
| B | 0 | 20341 | 0 |
| C | 0 | 43066 | 0 |
| D | 0 | 20487 | 0 |
| Mode SS | |||
|---|---|---|---|
| Quadrant | BADHDUFLAG | Total packets | Discarded packets |
| A | 0 | 140 | 0 |
| B | 0 | 140 | 0 |
| C | 0 | 140 | 0 |
| D | 0 | 140 | 0 |
| Quadrant | Total seconds | Saturated seconds | Saturation percentage |
|---|---|---|---|
| A | 6962 | 109 | 1.565642% |
| B | 6962 | 517 | 7.426027% |
| C | 6962 | 3643 | 52.326918% |
| D | 6961 | 345 | 4.956184% |
Noise dominated data is calculated using 1-second bins in cleaned event files. If a bin has >2000 counts, and if more than 50% of those come from <1% of pixels, then it is considered to be noise-dominated and hence unusable.
| Quadrant | # 1 sec bins | Bins with >0 counts | Bins with >2000 counts | High rate bins dominated by noise | Noise dominated (total time) | Noise dominated (detector-on time) | Marked lightcurve |
|---|---|---|---|---|---|---|---|
| A | 6963 | 6963 | 88 | 88 | 1.26% | 1.26% | 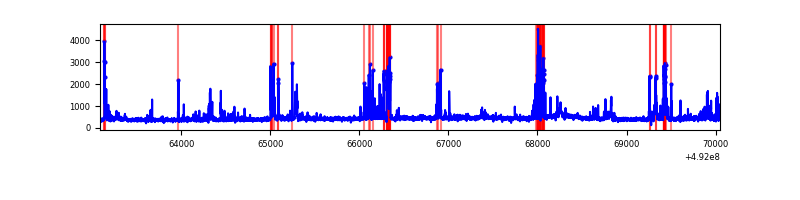 |
| B | 6963 | 6963 | 259 | 259 | 3.72% | 3.72% | 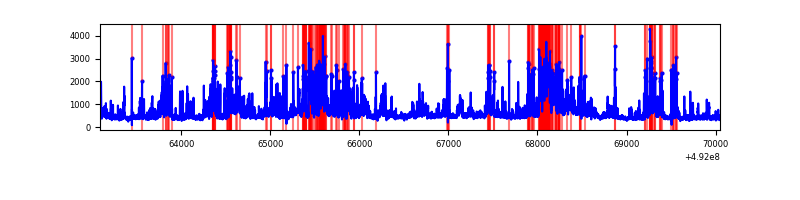 |
| C | 6963 | 6963 | 3338 | 3338 | 47.94% | 47.94% | 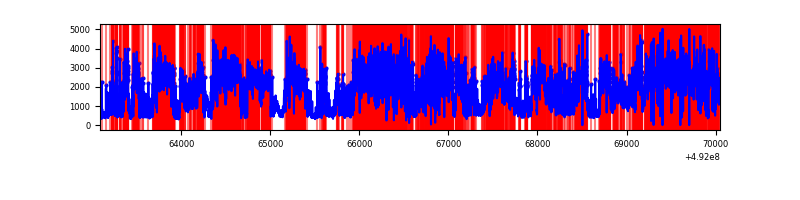 |
| D | 6962 | 6962 | 329 | 329 | 4.73% | 4.73% | 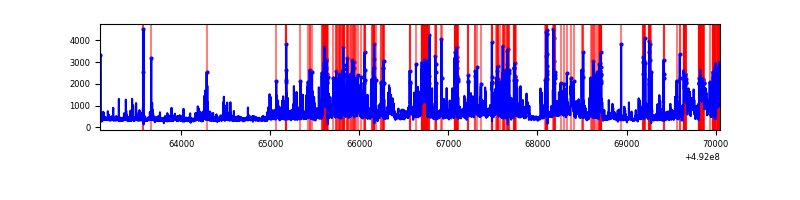 |
Top three noisy pixels from each quadrant. If the there are fewer than three noisy pixels in the level2.evt file, extra rows are filled as -1
| Pixel properties | Quadrant properties | ||||||
|---|---|---|---|---|---|---|---|
| Quadrant | DetID | PixID | Counts | Sigma | Mean | Median | Sigma |
| A | 7 | 206 | 259134 | 1444.78 | 714 | 694 | 178.9 |
| A | 0 | 8 | 163630 | 910.87 | 714 | 694 | 178.9 |
| A | 4 | 159 | 131738 | 732.58 | 714 | 694 | 178.9 |
| B | 4 | 206 | 1107459 | 7486.65 | 698 | 675 | 147.8 |
| B | 4 | 81 | 396375 | 2676.65 | 698 | 675 | 147.8 |
| B | 10 | 28 | 317812 | 2145.22 | 698 | 675 | 147.8 |
| C | 1 | 241 | 7634753 | 53821.8 | 514 | 510 | 141.8 |
| C | 15 | 224 | 991346 | 6985.44 | 514 | 510 | 141.8 |
| C | 15 | 147 | 819883 | 5776.62 | 514 | 510 | 141.8 |
| D | 11 | 245 | 1280647 | 6588.3 | 682 | 652 | 194.3 |
| D | 3 | 12 | 472548 | 2428.91 | 682 | 652 | 194.3 |
| D | 2 | 249 | 167596 | 859.28 | 682 | 652 | 194.3 |
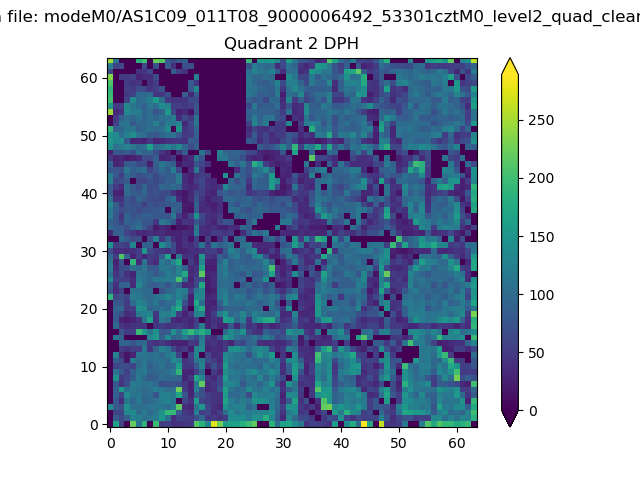
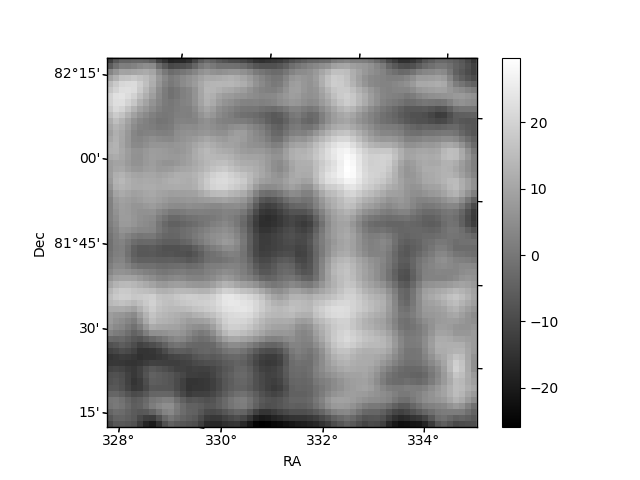
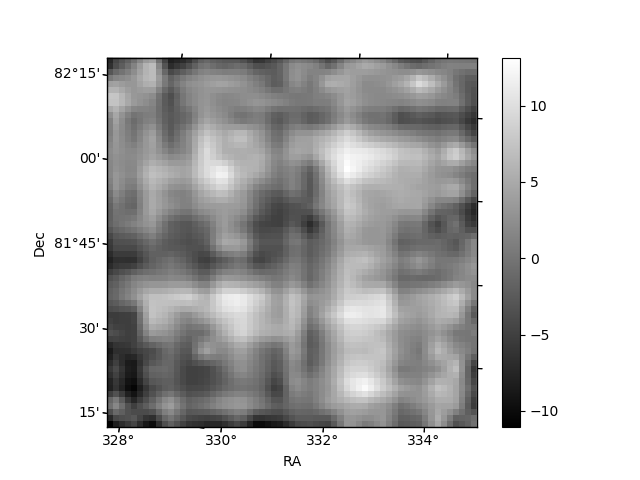
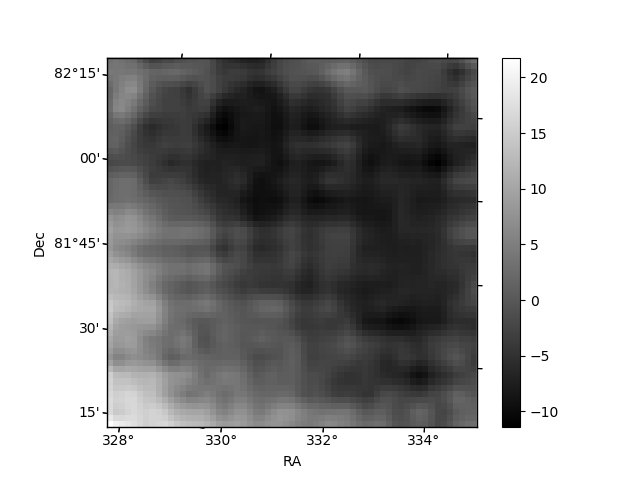
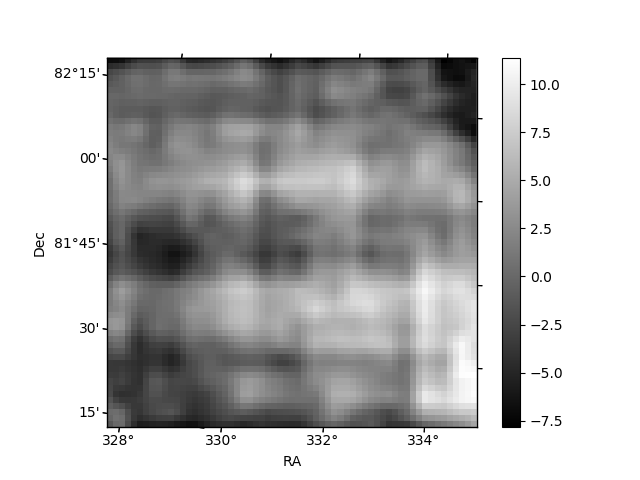
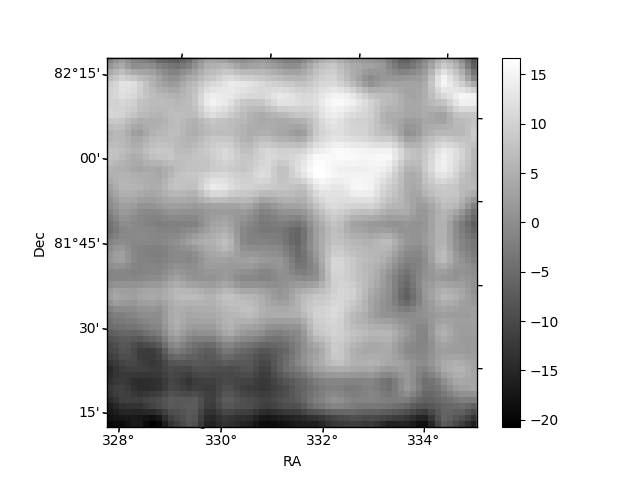
Histogram calculated using DETX and DETY for each event in the final _common_clean file
| Quadrant A | 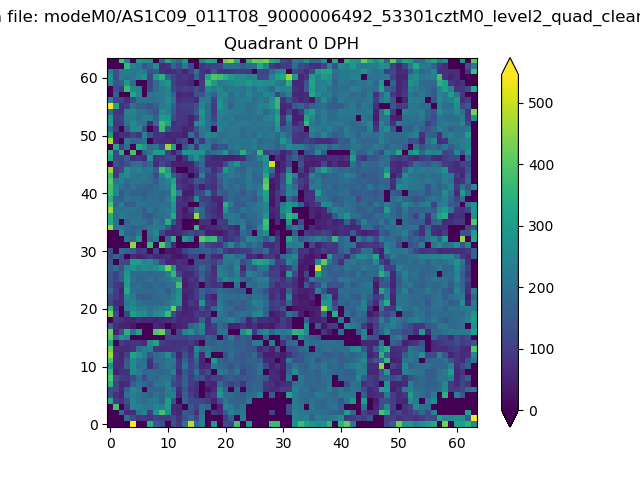 |
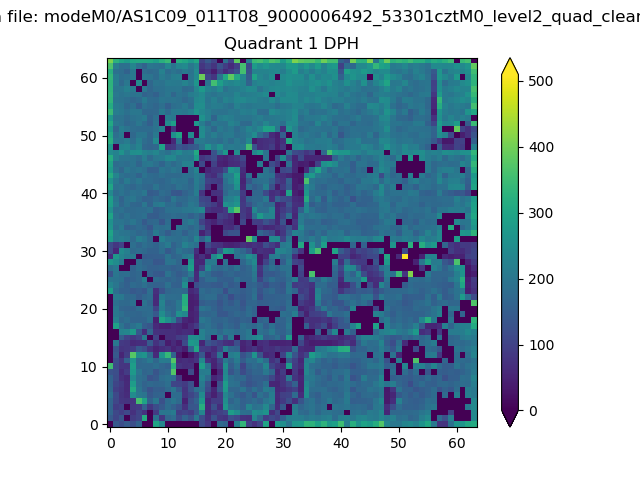 |
Quadrant B |
|---|---|---|---|
| Quadrant D | 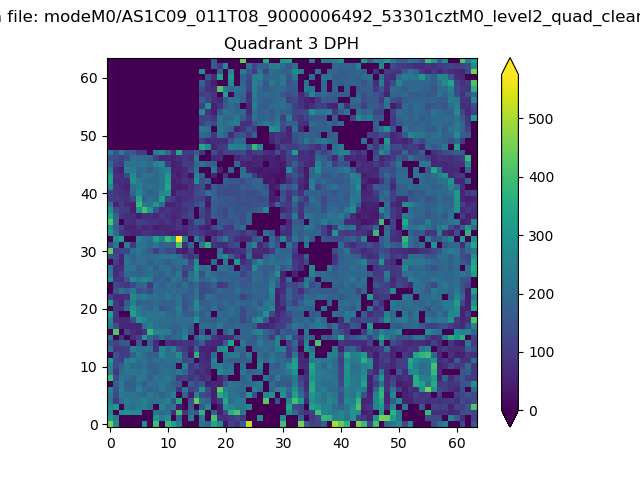 |
 |
Quadrant C |
| Plot type | Count rate plots | Images |
|---|---|---|
| Comparison with Poisson distribution Blue bars denote a histogram of data divided into 1 sec bins. Red curve is a Poisson curve with rate = median count rate of data. |
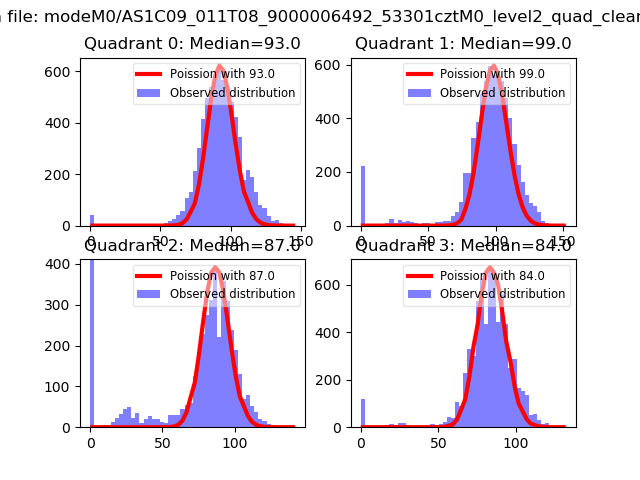 |
 |
| Quadrant-wise count rates Data is divided into 100 sec bins |
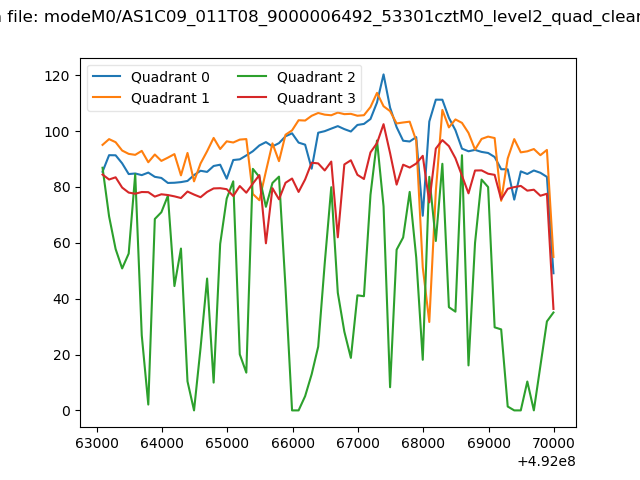 |
|
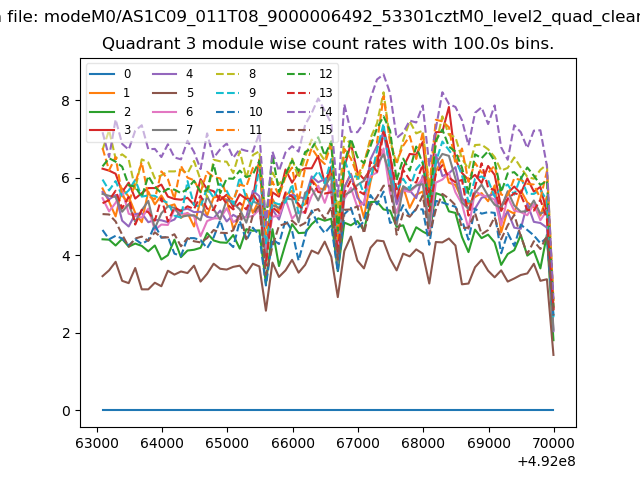
| Module-wise count rates for Quadrant A Data is divided into 100 sec bins |
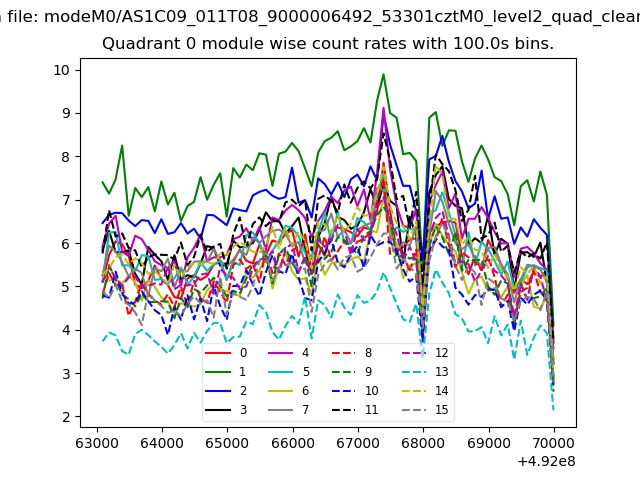 |
 |
| Module-wise count rates for Quadrant B Data is divided into 100 sec bins |
 |
 |
| Module-wise count rates for Quadrant C Data is divided into 100 sec bins |
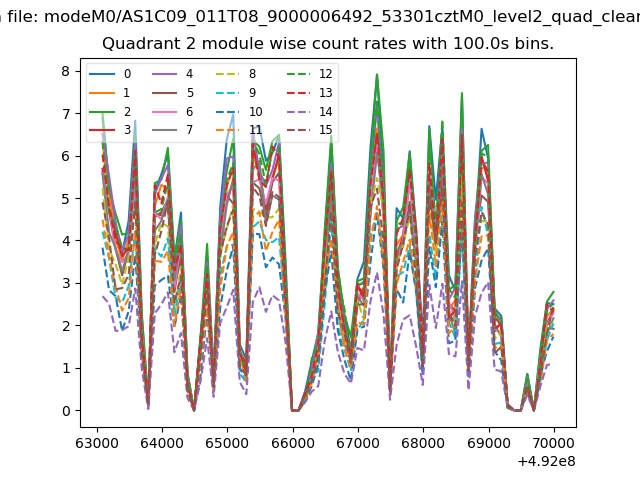 |
 |
| Module-wise count rates for Quadrant D Data is divided into 100 sec bins |
 |
 |
| Parameter | Plot |
|---|---|
| CZT HV Monitor | 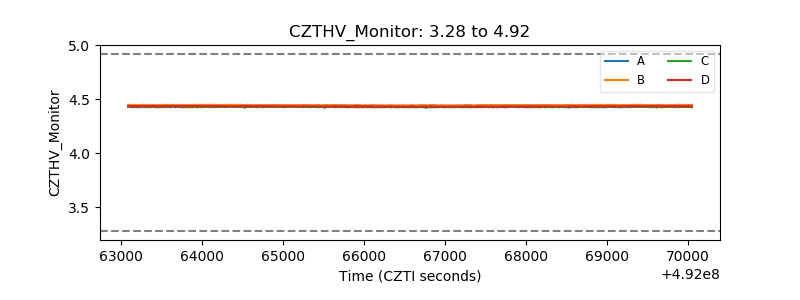 |
| D_VDD | 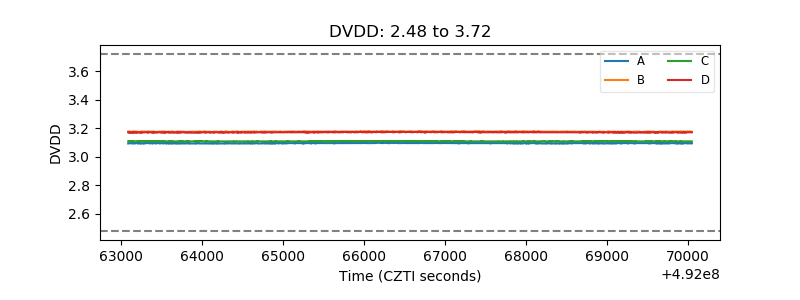 |
| Temperature 1 | 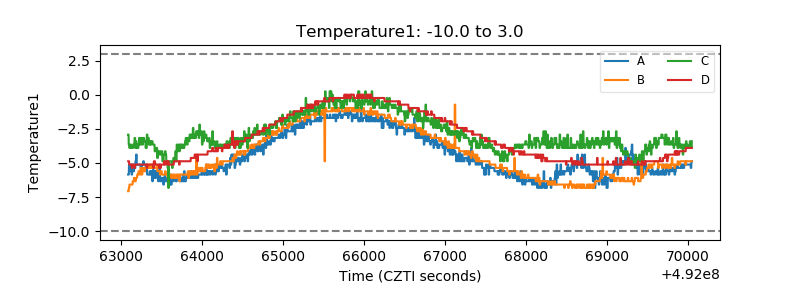 |
| Veto HV Monitor |  |
| Veto LLD | 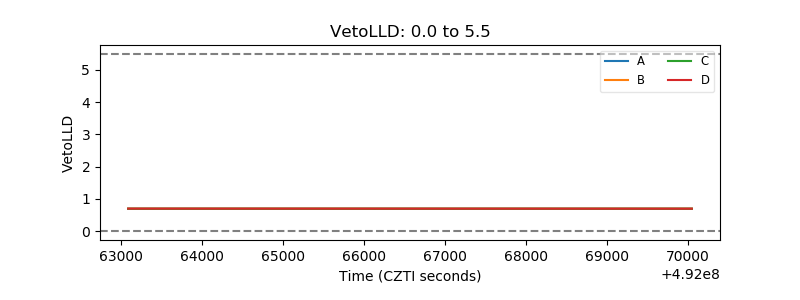 |
| Alpha Counter | 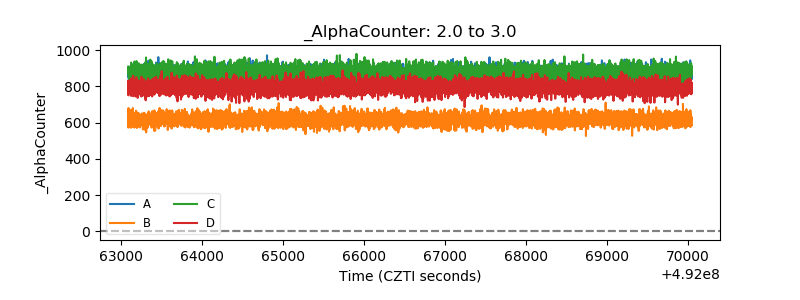 |
| _CPM_Rate | 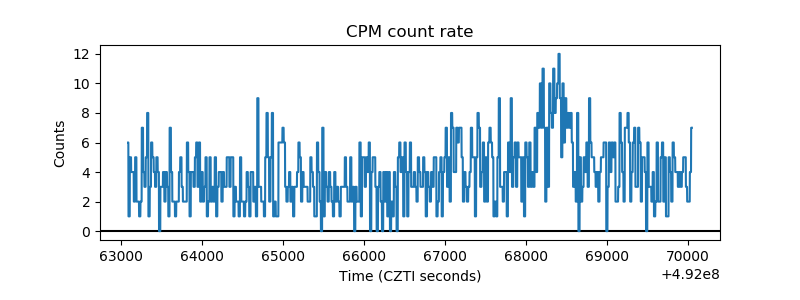 |
| CZT Counter | 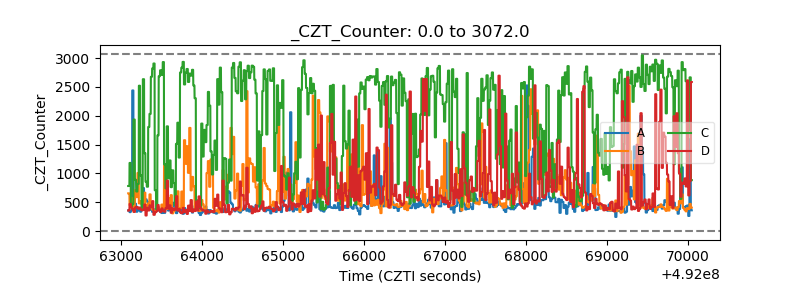 |
| +2.5 Volts monitor |  |
| +5 Volts monitor |  |
| _ROLL_ROT | 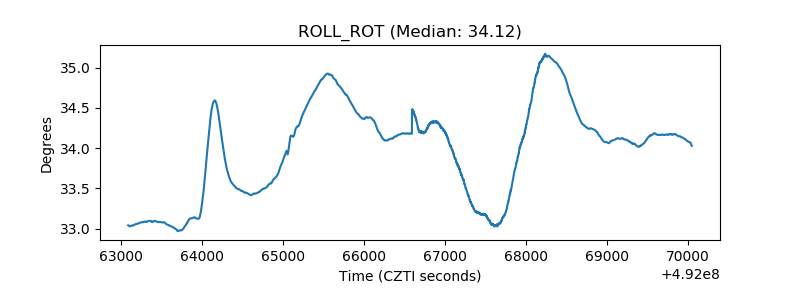 |
| _Roll_DEC | 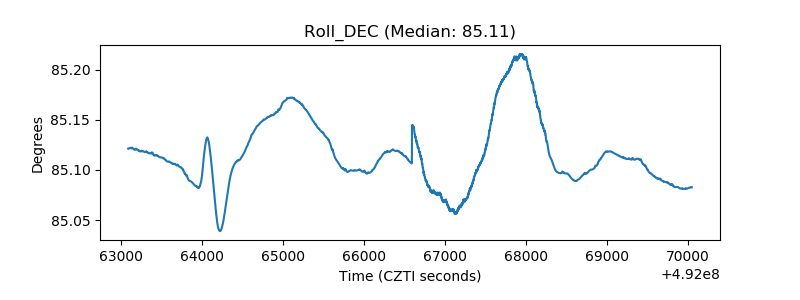 |
| _Roll_RA | 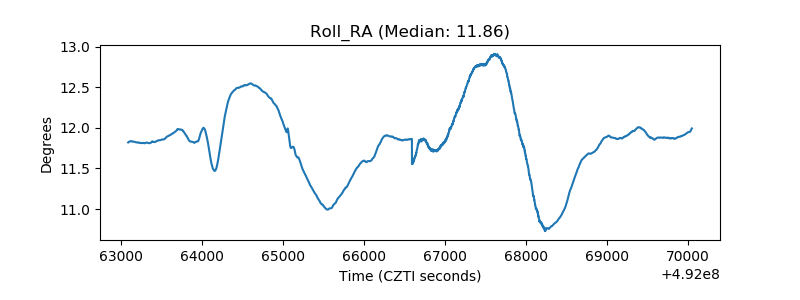 |
| Veto Counter | 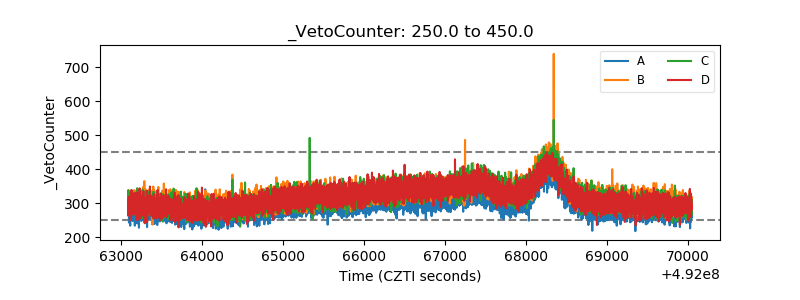 |