| Param | Original file | Final file |
|---|---|---|
| Filename | modeM0/AS1C09_011T08_9000006492_53313cztM0_level2.fits | modeM0/AS1C09_011T08_9000006492_53313cztM0_level2_quad_clean.evt |
| Size (bytes) | 616,772,160 | 94,956,480 |
| Size | 588.2 MB | 90.6 MB |
| Events in quadrant A | 3,979,065 | 629,813 |
| Events in quadrant B | 5,321,961 | 686,118 |
| Events in quadrant C | 8,943,335 | 493,015 |
| Events in quadrant D | 4,054,018 | 587,387 |
| Mode M0 | |||
|---|---|---|---|
| Quadrant | BADHDUFLAG | Total packets | Discarded packets |
| A | 0 | 16931 | 2 |
| B | 0 | 20643 | 2 |
| C | 0 | 31324 | 2 |
| D | 0 | 17178 | 2 |
| Mode M9 | |||
|---|---|---|---|
| Quadrant | BADHDUFLAG | Total packets | Discarded packets |
| A | 0 | 15 | 0 |
| B | 0 | 16 | 0 |
| C | 0 | 16 | 0 |
| D | 0 | 16 | 0 |
| Mode SS | |||
|---|---|---|---|
| Quadrant | BADHDUFLAG | Total packets | Discarded packets |
| A | 0 | 140 | 0 |
| B | 0 | 140 | 0 |
| C | 0 | 140 | 0 |
| D | 0 | 140 | 0 |
| Quadrant | Total seconds | Saturated seconds | Saturation percentage |
|---|---|---|---|
| A | 6866 | 321 | 4.675211% |
| B | 6866 | 392 | 5.709292% |
| C | 6865 | 1824 | 26.569556% |
| D | 6865 | 223 | 3.248361% |
Noise dominated data is calculated using 1-second bins in cleaned event files. If a bin has >2000 counts, and if more than 50% of those come from <1% of pixels, then it is considered to be noise-dominated and hence unusable.
| Quadrant | # 1 sec bins | Bins with >0 counts | Bins with >2000 counts | High rate bins dominated by noise | Noise dominated (total time) | Noise dominated (detector-on time) | Marked lightcurve |
|---|---|---|---|---|---|---|---|
| A | 7691 | 6867 | 245 | 245 | 3.19% | 3.57% | 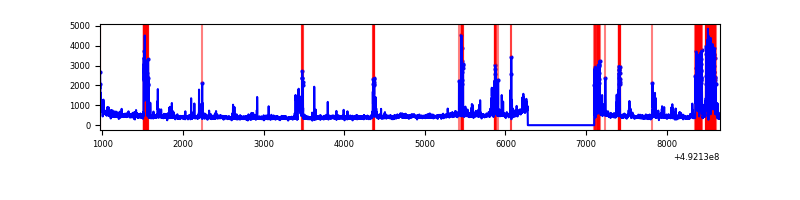 |
| B | 7691 | 6867 | 224 | 224 | 2.91% | 3.26% | 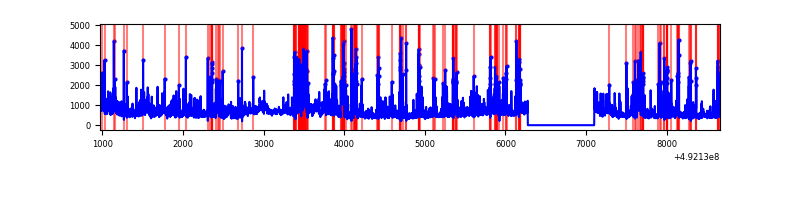 |
| C | 7689 | 6865 | 1556 | 1556 | 20.24% | 22.67% | 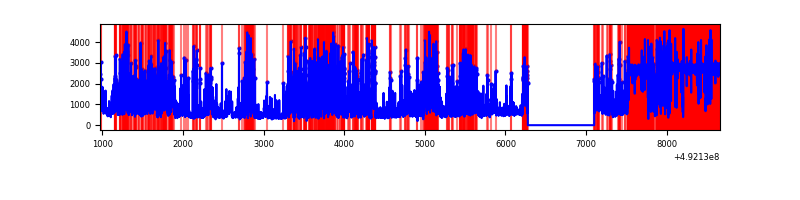 |
| D | 7690 | 6866 | 173 | 173 | 2.25% | 2.52% | 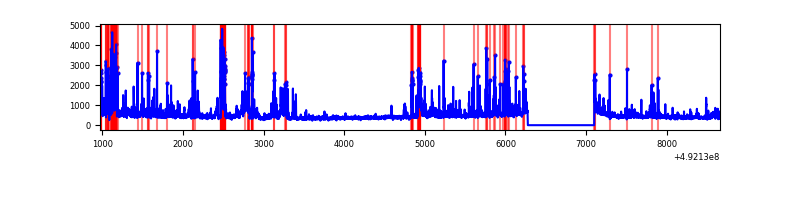 |
Top three noisy pixels from each quadrant. If the there are fewer than three noisy pixels in the level2.evt file, extra rows are filled as -1
| Pixel properties | Quadrant properties | ||||||
|---|---|---|---|---|---|---|---|
| Quadrant | DetID | PixID | Counts | Sigma | Mean | Median | Sigma |
| A | 12 | 115 | 721018 | 4112.67 | 697 | 678 | 175.2 |
| A | 3 | 14 | 103055 | 584.5 | 697 | 678 | 175.2 |
| A | 4 | 249 | 86628 | 490.72 | 697 | 678 | 175.2 |
| B | 2 | 249 | 642175 | 4369.71 | 697 | 673 | 146.8 |
| B | 13 | 245 | 420113 | 2857.09 | 697 | 673 | 146.8 |
| B | 0 | 197 | 359010 | 2440.88 | 697 | 673 | 146.8 |
| C | 15 | 224 | 3114822 | 18544.3 | 604 | 599 | 167.9 |
| C | 1 | 241 | 2627533 | 15642.63 | 604 | 599 | 167.9 |
| C | 12 | 254 | 232930 | 1383.46 | 604 | 599 | 167.9 |
| D | 3 | 12 | 420560 | 2140.31 | 683 | 651 | 196.2 |
| D | 8 | 48 | 236257 | 1200.9 | 683 | 651 | 196.2 |
| D | 2 | 120 | 163788 | 831.52 | 683 | 651 | 196.2 |
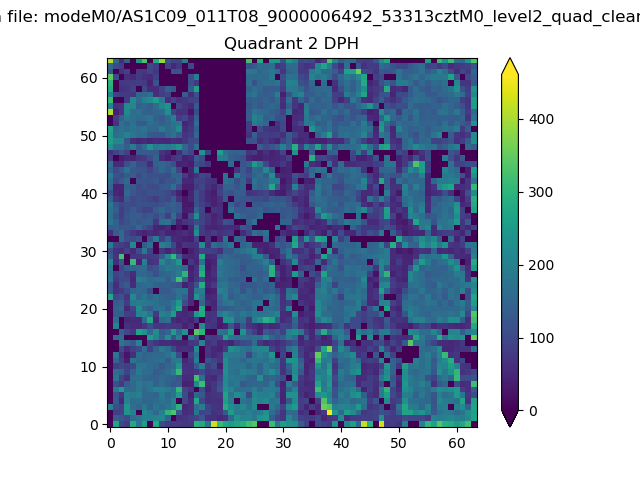
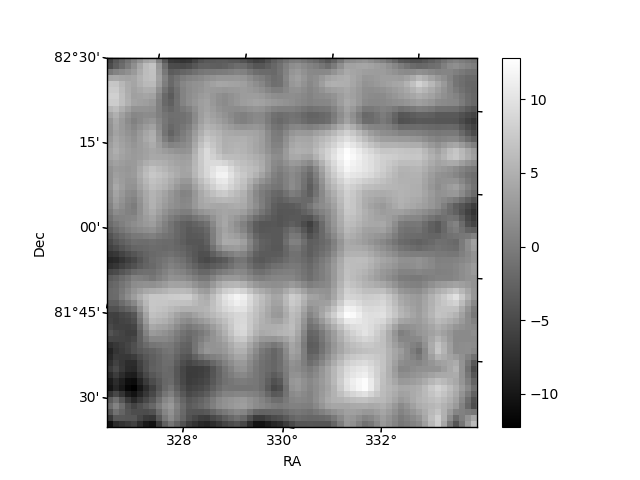
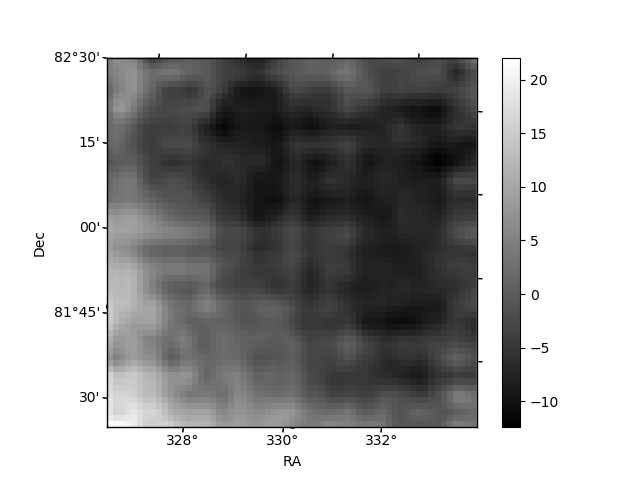
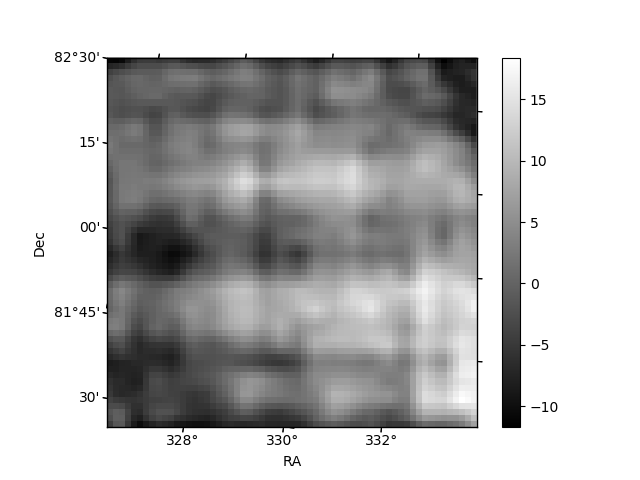
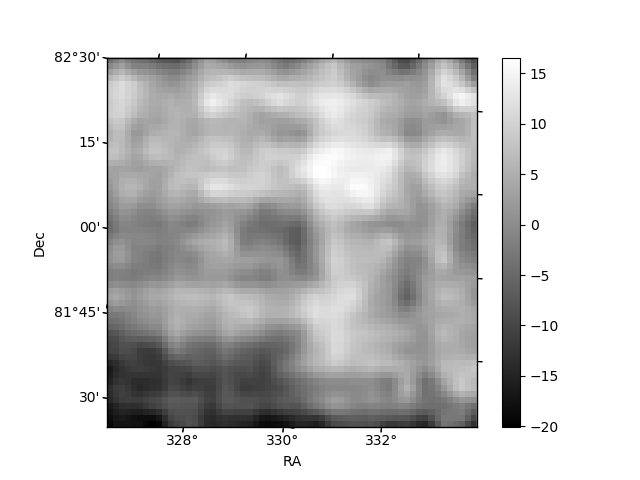
Histogram calculated using DETX and DETY for each event in the final _common_clean file
| Quadrant A | 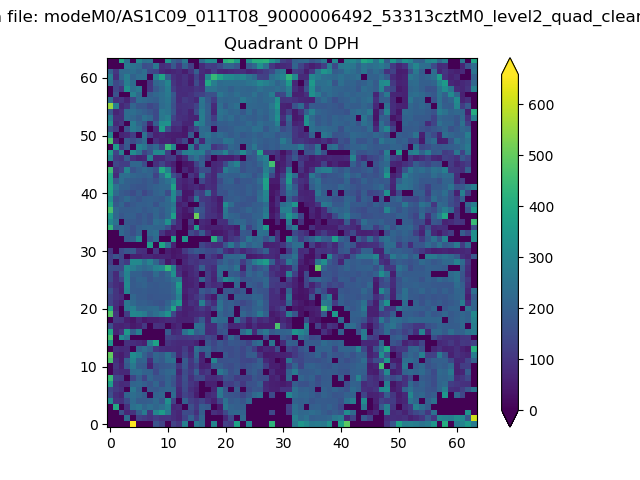 |
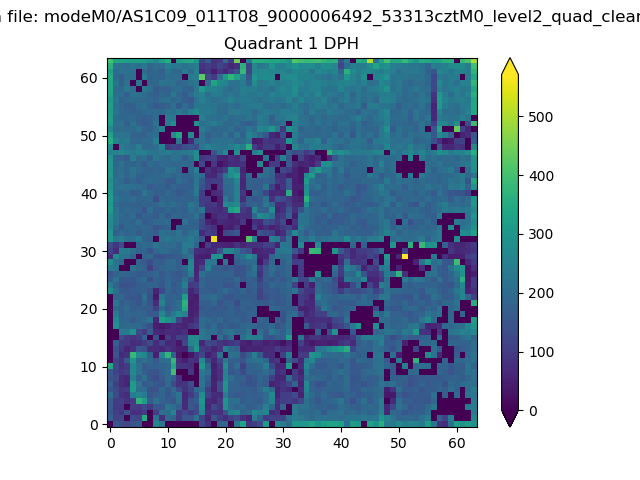 |
Quadrant B |
|---|---|---|---|
| Quadrant D | 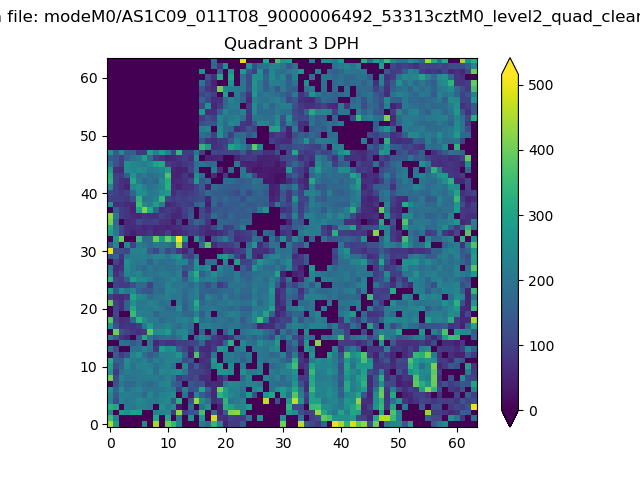 |
 |
Quadrant C |
| Plot type | Count rate plots | Images |
|---|---|---|
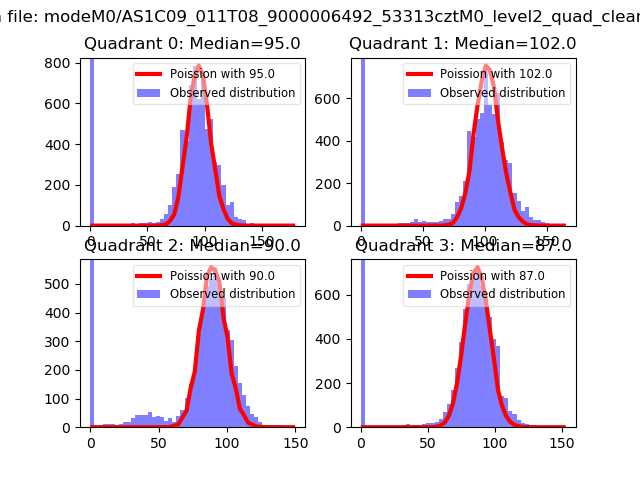
| Comparison with Poisson distribution Blue bars denote a histogram of data divided into 1 sec bins. Red curve is a Poisson curve with rate = median count rate of data. |
 |
 |
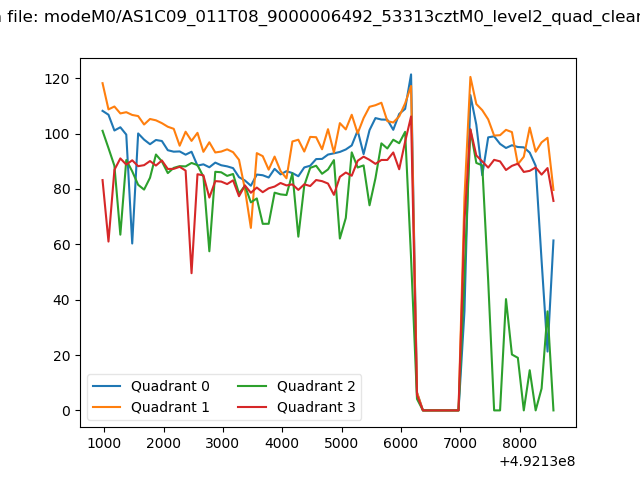
| Quadrant-wise count rates Data is divided into 100 sec bins |
 |
|
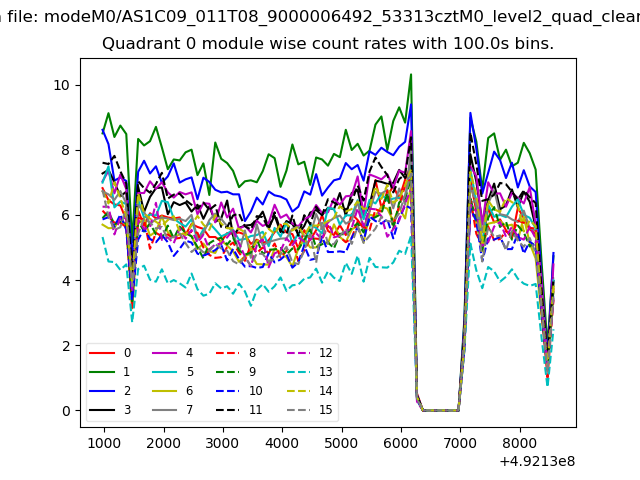
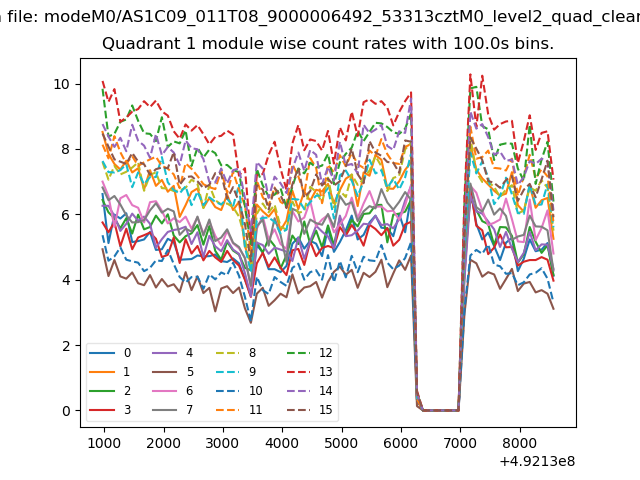
| Module-wise count rates for Quadrant A Data is divided into 100 sec bins |
 |
 |
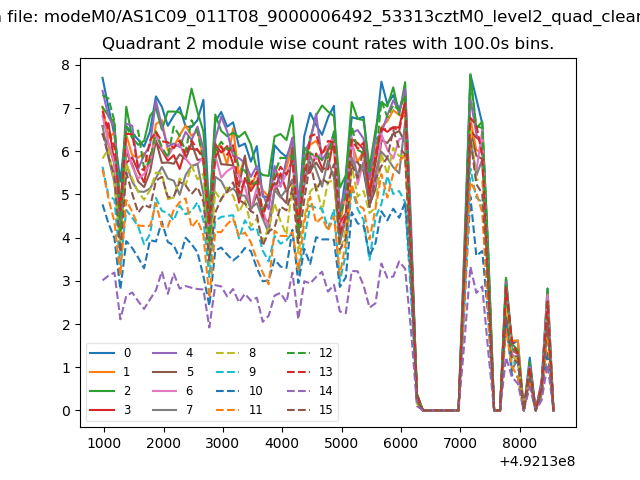
| Module-wise count rates for Quadrant B Data is divided into 100 sec bins |
 |
 |
| Module-wise count rates for Quadrant C Data is divided into 100 sec bins |
 |
 |
| Module-wise count rates for Quadrant D Data is divided into 100 sec bins |
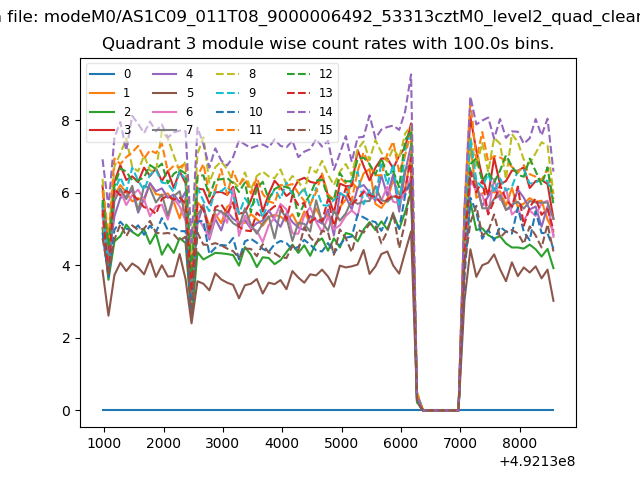 |
 |
| Parameter | Plot |
|---|---|
| CZT HV Monitor | 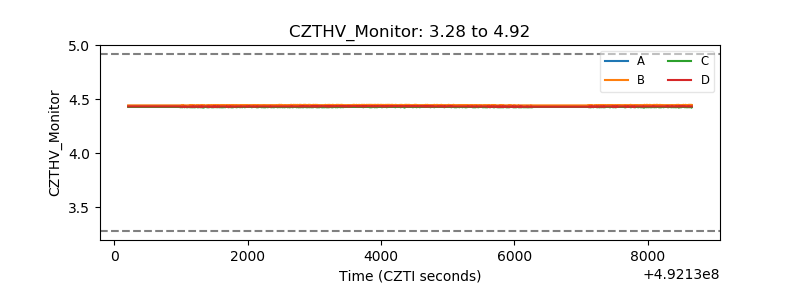 |
| D_VDD | 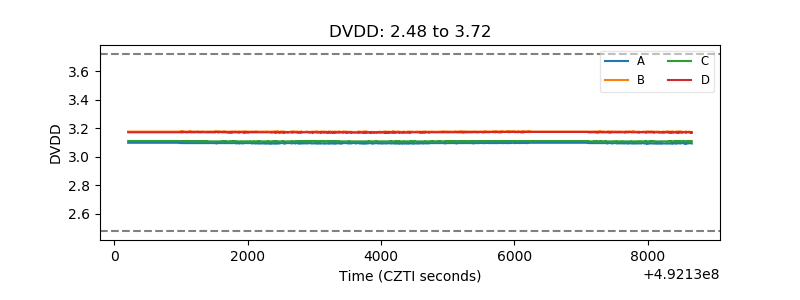 |
| Temperature 1 | 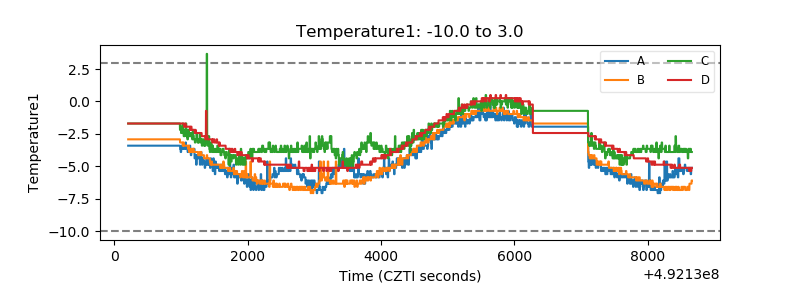 |
| Veto HV Monitor | 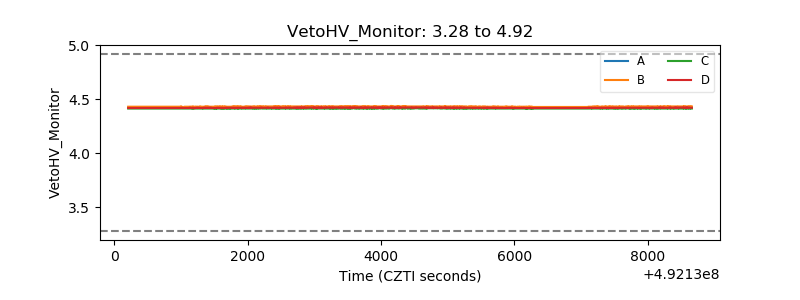 |
| Veto LLD | 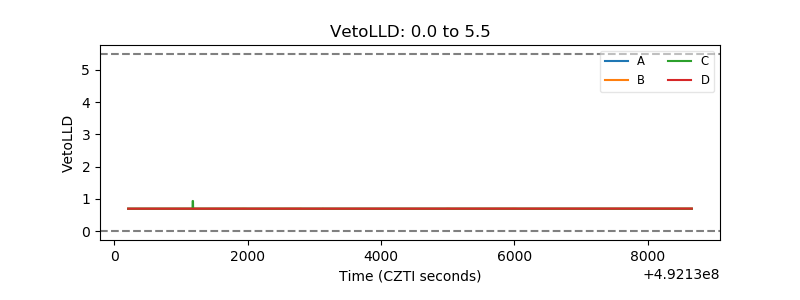 |
| Alpha Counter | 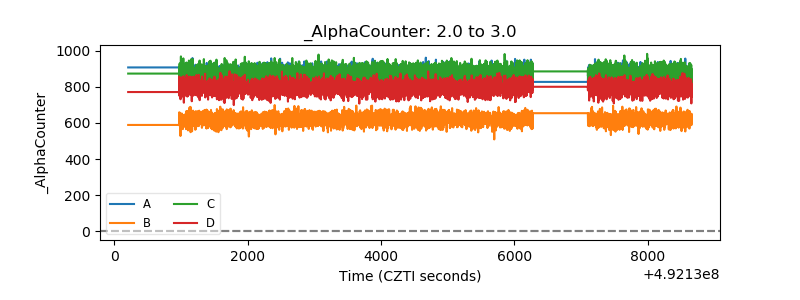 |
| _CPM_Rate | 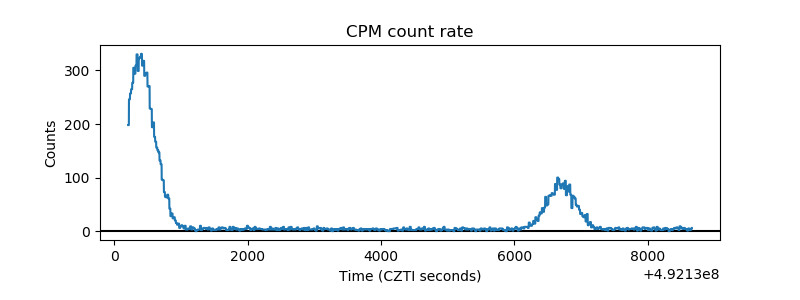 |
| CZT Counter | 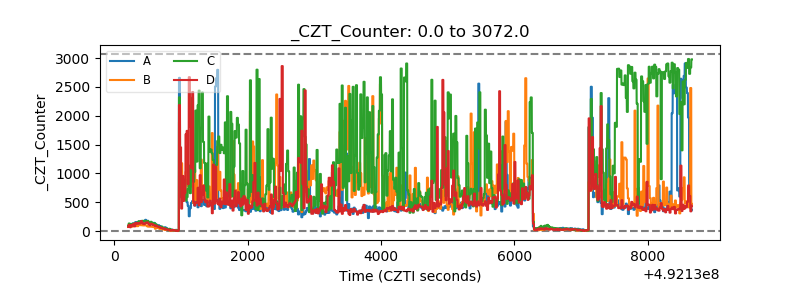 |
| +2.5 Volts monitor | 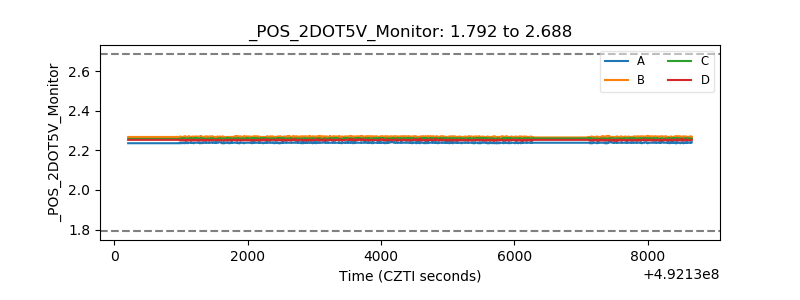 |
| +5 Volts monitor | 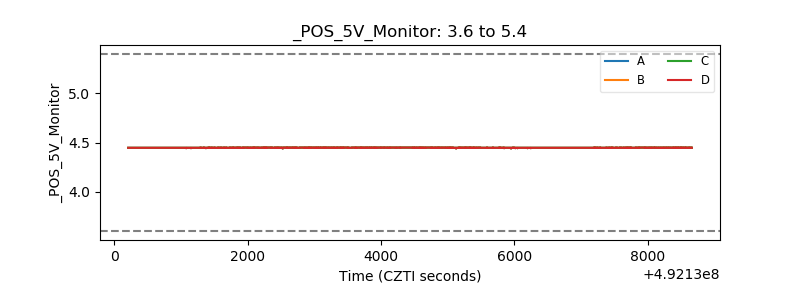 |
| _ROLL_ROT | 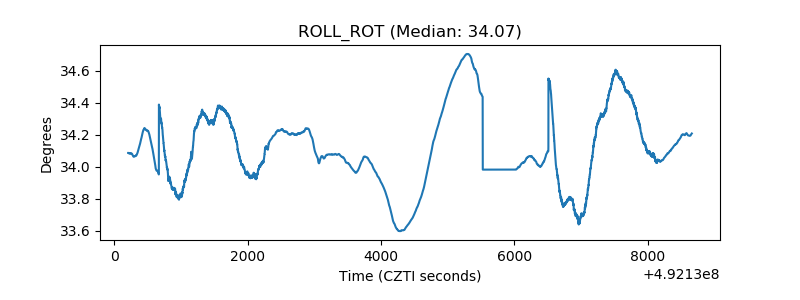 |
| _Roll_DEC | 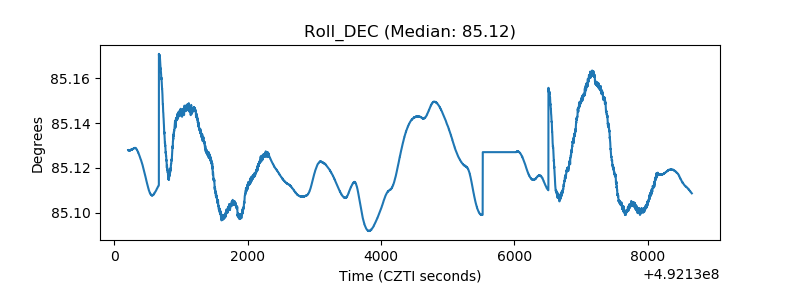 |
| _Roll_RA | 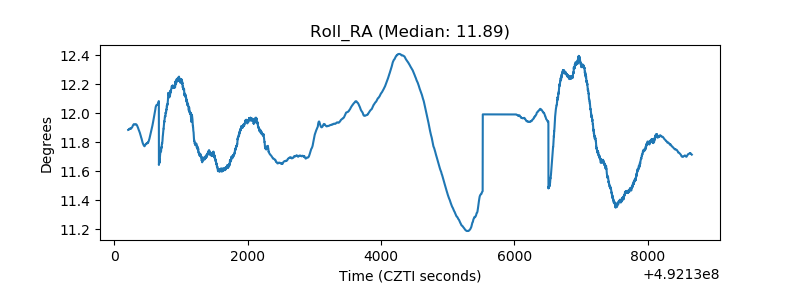 |
| Veto Counter | 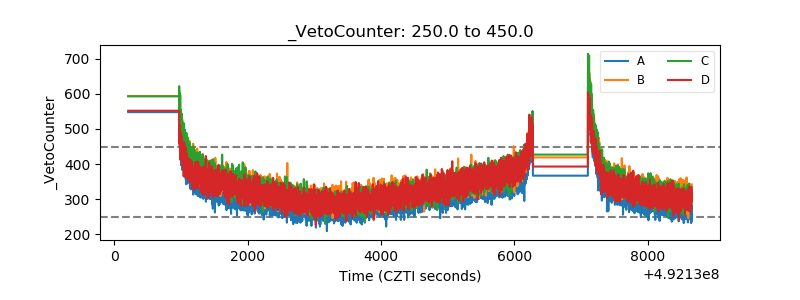 |