| Param | Original file | Final file |
|---|---|---|
| Filename | modeM0/AS1C09_011T08_9000006492_53314cztM0_level2.fits | modeM0/AS1C09_011T08_9000006492_53314cztM0_level2_quad_clean.evt |
| Size (bytes) | 674,303,040 | 109,304,640 |
| Size | 643.1 MB | 104.2 MB |
| Events in quadrant A | 4,322,571 | 739,402 |
| Events in quadrant B | 5,930,714 | 775,240 |
| Events in quadrant C | 10,139,052 | 554,144 |
| Events in quadrant D | 3,951,903 | 688,370 |
| Mode M0 | |||
|---|---|---|---|
| Quadrant | BADHDUFLAG | Total packets | Discarded packets |
| A | 0 | 18766 | 3 |
| B | 0 | 23353 | 3 |
| C | 0 | 35515 | 3 |
| D | 0 | 17840 | 4 |
| Mode M9 | |||
|---|---|---|---|
| Quadrant | BADHDUFLAG | Total packets | Discarded packets |
| A | 0 | 10 | 0 |
| B | 0 | 10 | 0 |
| C | 0 | 10 | 0 |
| D | 0 | 10 | 0 |
| Mode SS | |||
|---|---|---|---|
| Quadrant | BADHDUFLAG | Total packets | Discarded packets |
| A | 0 | 164 | 0 |
| B | 0 | 164 | 0 |
| C | 0 | 164 | 0 |
| D | 0 | 164 | 0 |
| Quadrant | Total seconds | Saturated seconds | Saturation percentage |
|---|---|---|---|
| A | 7941 | 307 | 3.866012% |
| B | 7942 | 599 | 7.542181% |
| C | 7942 | 2177 | 27.411231% |
| D | 7941 | 110 | 1.385216% |
Noise dominated data is calculated using 1-second bins in cleaned event files. If a bin has >2000 counts, and if more than 50% of those come from <1% of pixels, then it is considered to be noise-dominated and hence unusable.
| Quadrant | # 1 sec bins | Bins with >0 counts | Bins with >2000 counts | High rate bins dominated by noise | Noise dominated (total time) | Noise dominated (detector-on time) | Marked lightcurve |
|---|---|---|---|---|---|---|---|
| A | 9061 | 7944 | 179 | 179 | 1.98% | 2.25% | 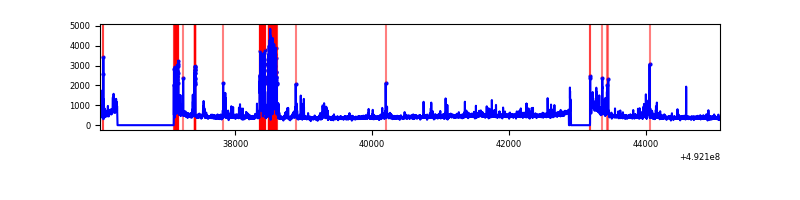 |
| B | 9062 | 7945 | 263 | 263 | 2.90% | 3.31% | 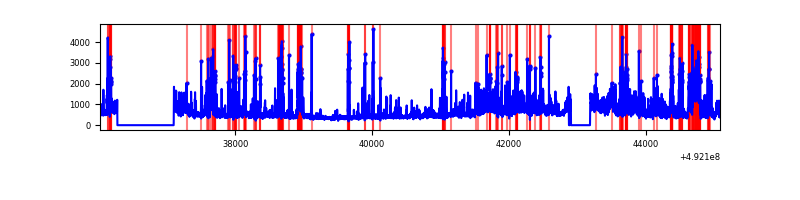 |
| C | 9061 | 7944 | 1812 | 1812 | 20.00% | 22.81% | 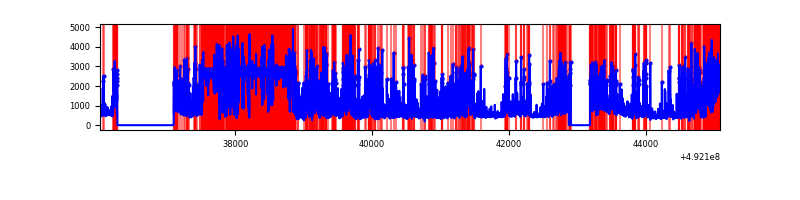 |
| D | 9061 | 7944 | 68 | 68 | 0.75% | 0.86% | 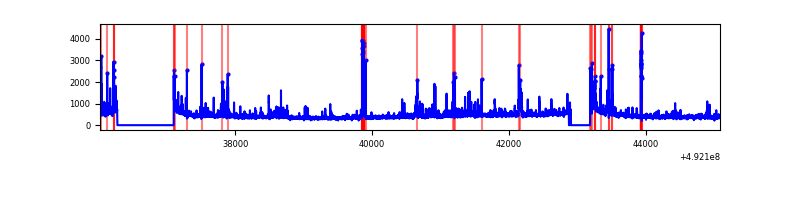 |
Top three noisy pixels from each quadrant. If the there are fewer than three noisy pixels in the level2.evt file, extra rows are filled as -1
| Pixel properties | Quadrant properties | ||||||
|---|---|---|---|---|---|---|---|
| Quadrant | DetID | PixID | Counts | Sigma | Mean | Median | Sigma |
| A | 12 | 115 | 553492 | 2668.4 | 830 | 806 | 207.1 |
| A | 8 | 229 | 94557 | 452.63 | 830 | 806 | 207.1 |
| A | 3 | 14 | 90139 | 431.3 | 830 | 806 | 207.1 |
| B | 13 | 245 | 562780 | 3263.17 | 821 | 792 | 172.2 |
| B | 4 | 206 | 452595 | 2623.39 | 821 | 792 | 172.2 |
| B | 2 | 249 | 450431 | 2610.82 | 821 | 792 | 172.2 |
| C | 1 | 241 | 3223433 | 16392.88 | 709 | 701 | 196.6 |
| C | 15 | 224 | 2578603 | 13112.86 | 709 | 701 | 196.6 |
| C | 12 | 254 | 535959 | 2722.66 | 709 | 701 | 196.6 |
| D | 3 | 12 | 200317 | 860.67 | 815 | 779 | 231.8 |
| D | 14 | 52 | 96197 | 411.57 | 815 | 779 | 231.8 |
| D | 5 | 173 | 64237 | 273.72 | 815 | 779 | 231.8 |
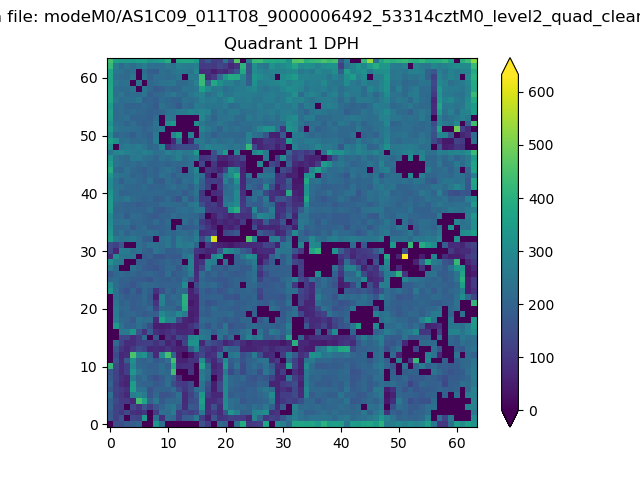
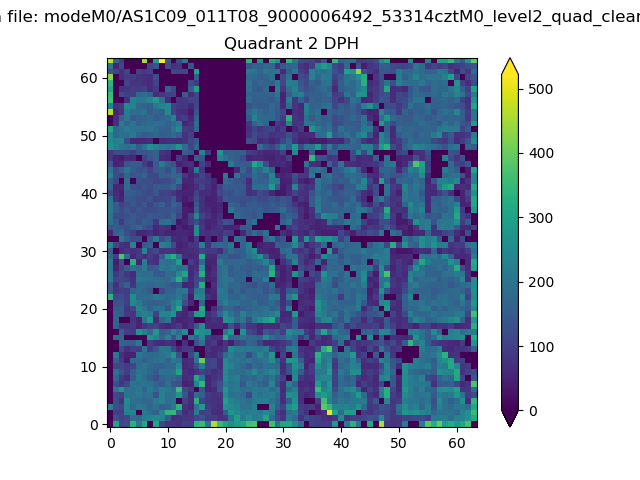
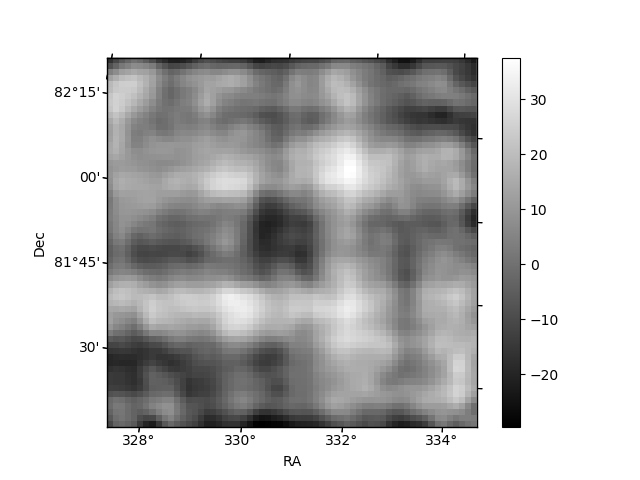
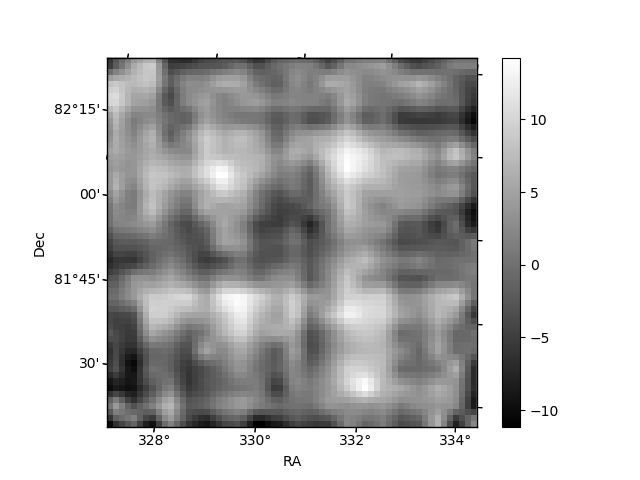
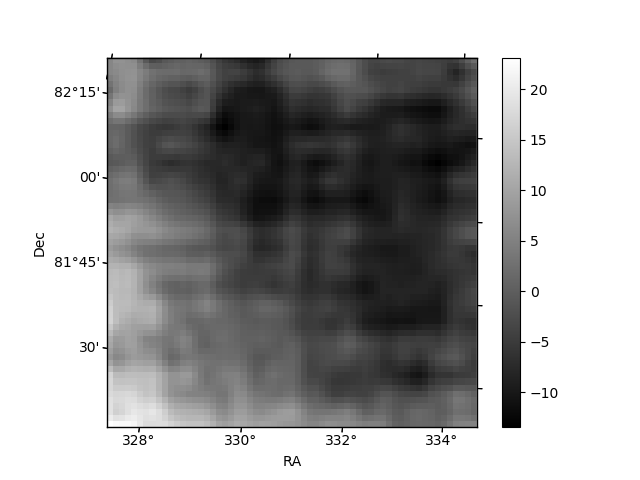
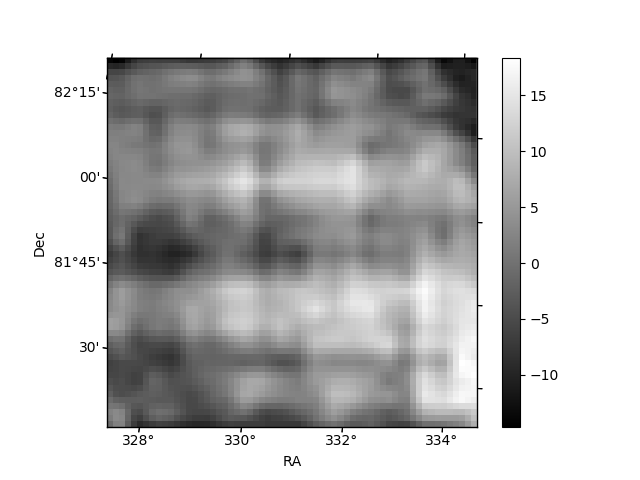
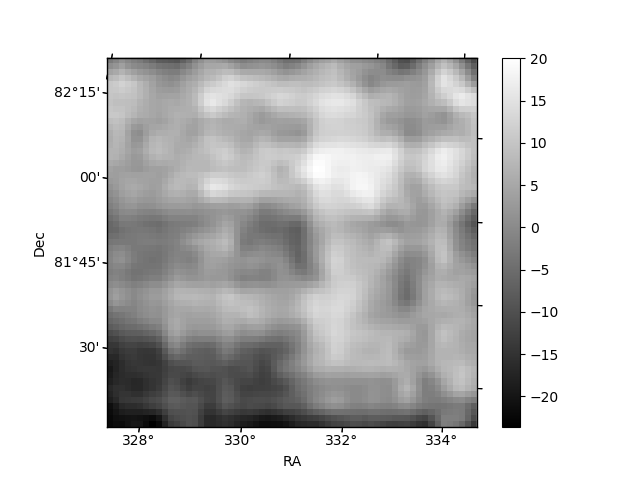
Histogram calculated using DETX and DETY for each event in the final _common_clean file
| Quadrant A |  |
 |
Quadrant B |
|---|---|---|---|
| Quadrant D | 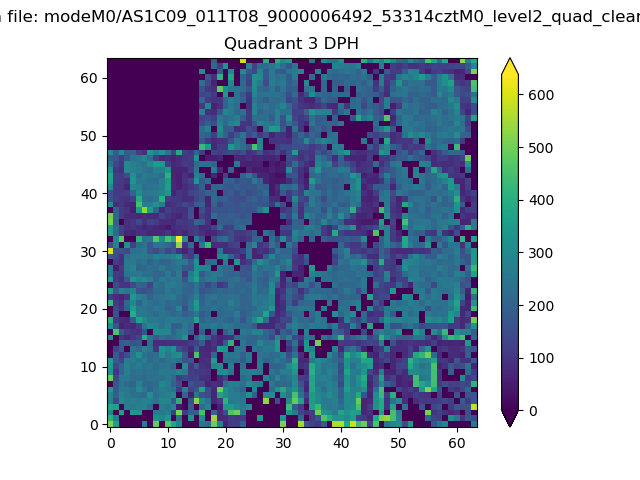 |
 |
Quadrant C |
| Plot type | Count rate plots | Images |
|---|---|---|
| Comparison with Poisson distribution Blue bars denote a histogram of data divided into 1 sec bins. Red curve is a Poisson curve with rate = median count rate of data. |
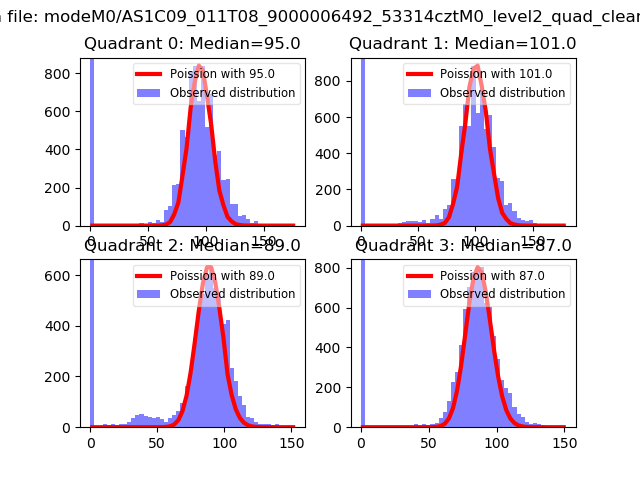 |
 |
| Quadrant-wise count rates Data is divided into 100 sec bins |
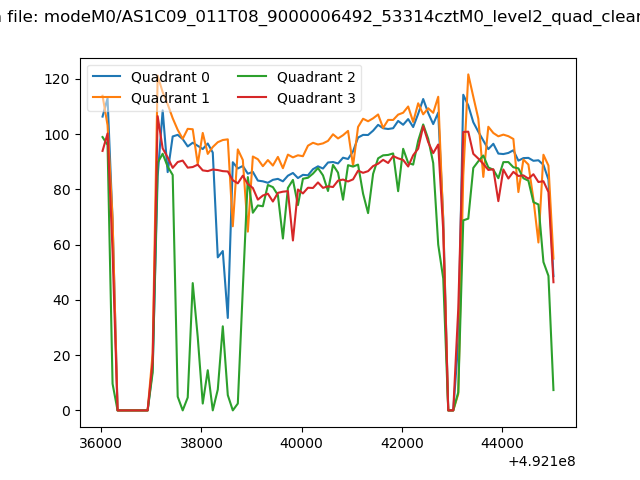 |
|
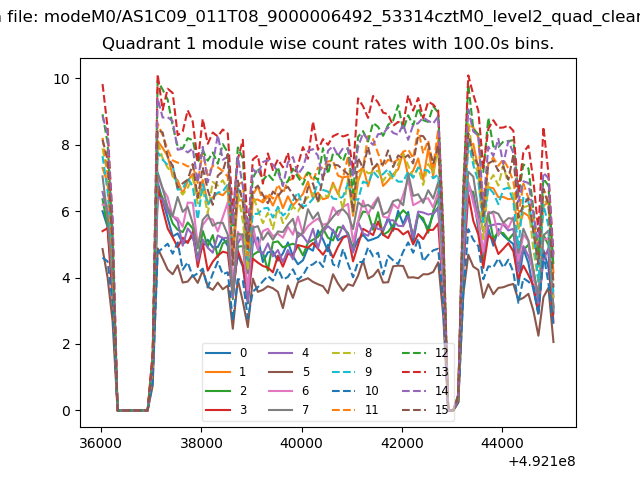
| Module-wise count rates for Quadrant A Data is divided into 100 sec bins |
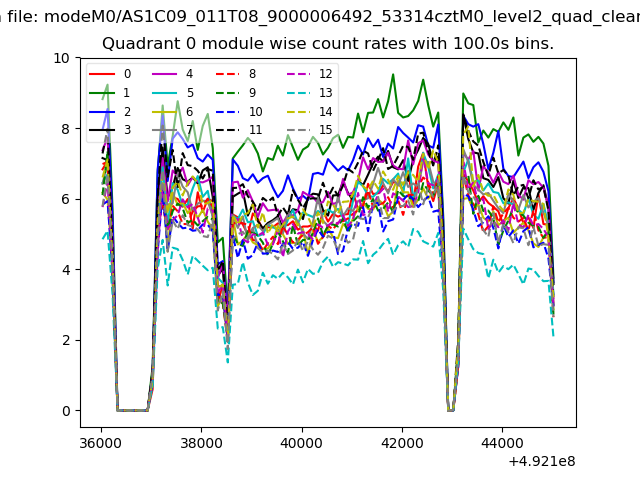 |
 |
| Module-wise count rates for Quadrant B Data is divided into 100 sec bins |
 |
 |
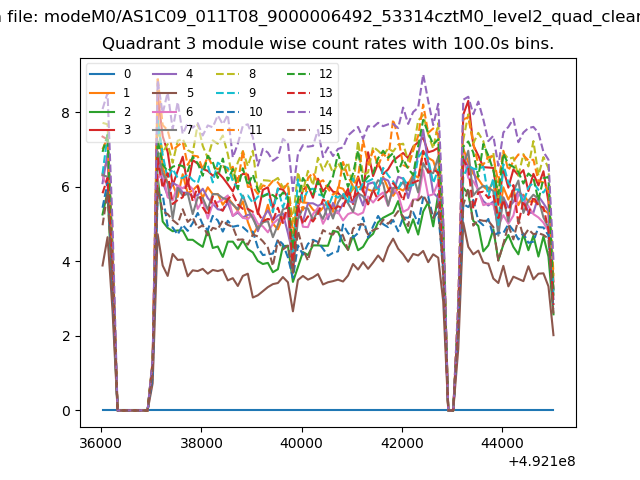
| Module-wise count rates for Quadrant C Data is divided into 100 sec bins |
 |
 |
| Module-wise count rates for Quadrant D Data is divided into 100 sec bins |
 |
 |
| Parameter | Plot |
|---|---|
| CZT HV Monitor | 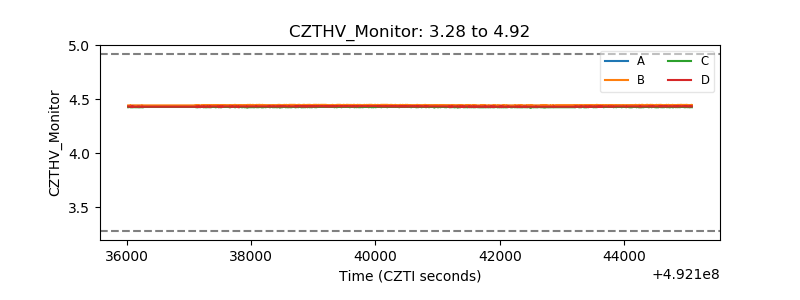 |
| D_VDD | 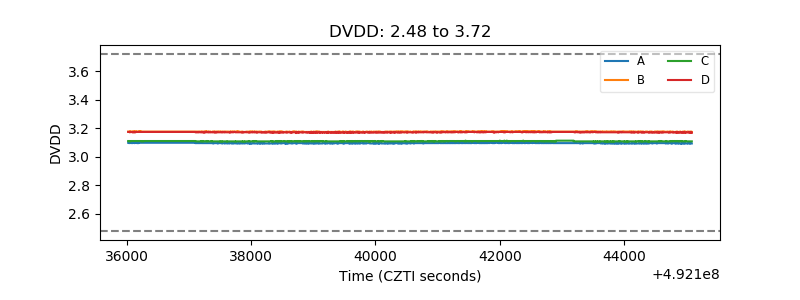 |
| Temperature 1 | 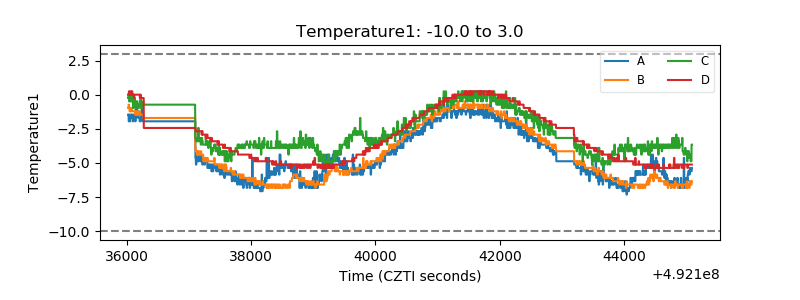 |
| Veto HV Monitor | 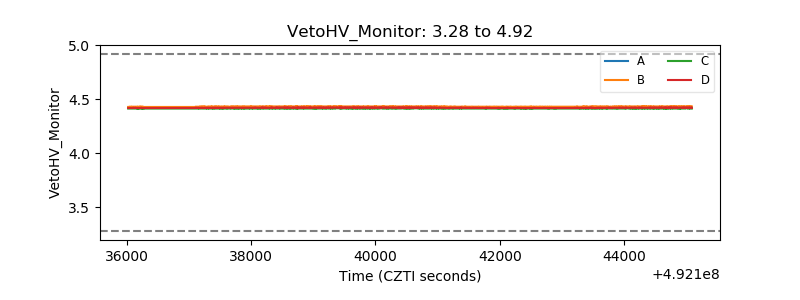 |
| Veto LLD | 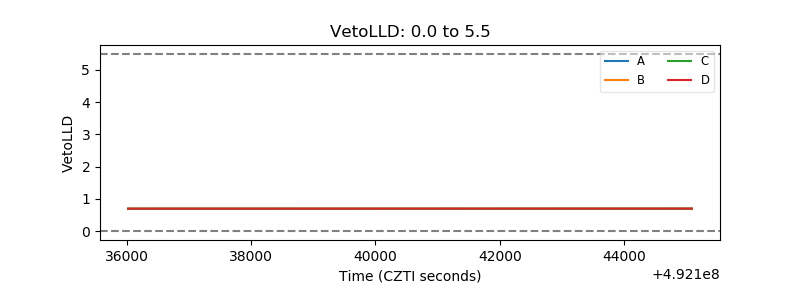 |
| Alpha Counter | 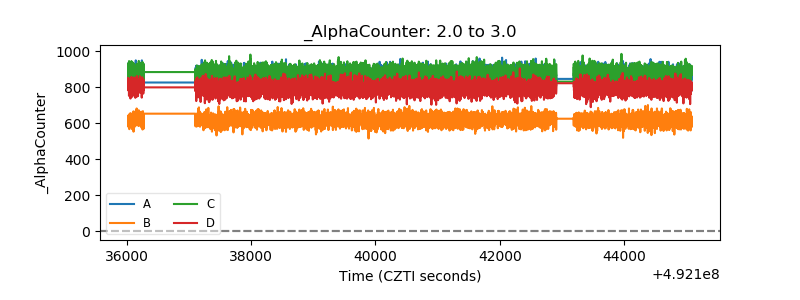 |
| _CPM_Rate | 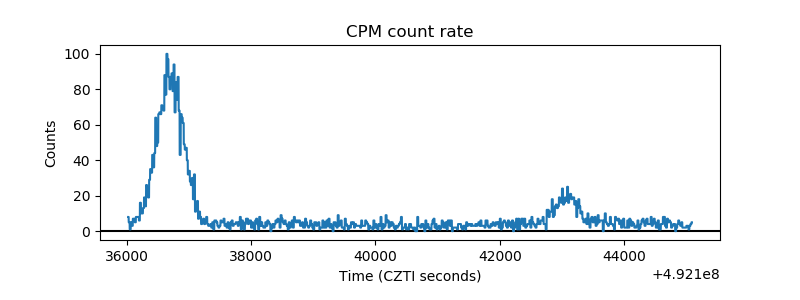 |
| CZT Counter | 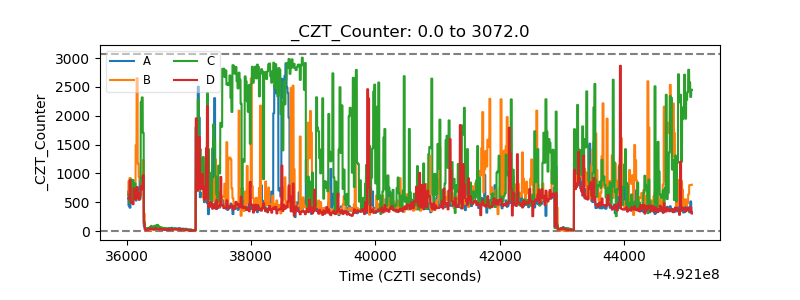 |
| +2.5 Volts monitor |  |
| +5 Volts monitor |  |
| _ROLL_ROT | 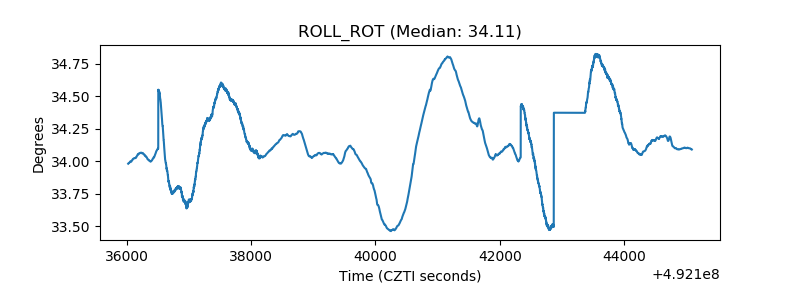 |
| _Roll_DEC | 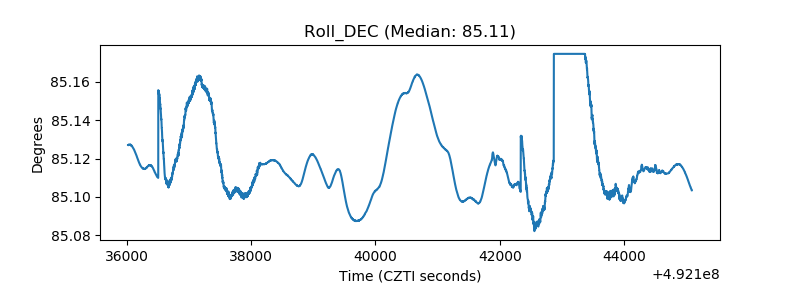 |
| _Roll_RA | 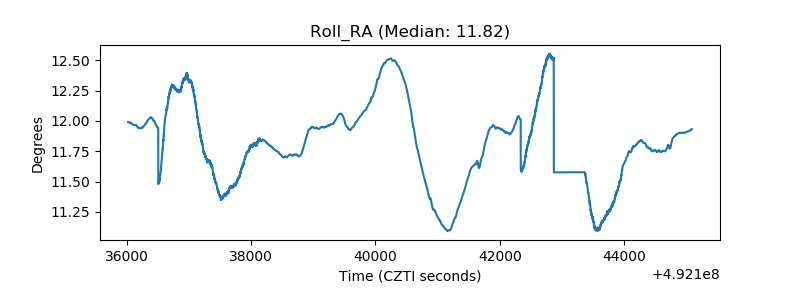 |
| Veto Counter | 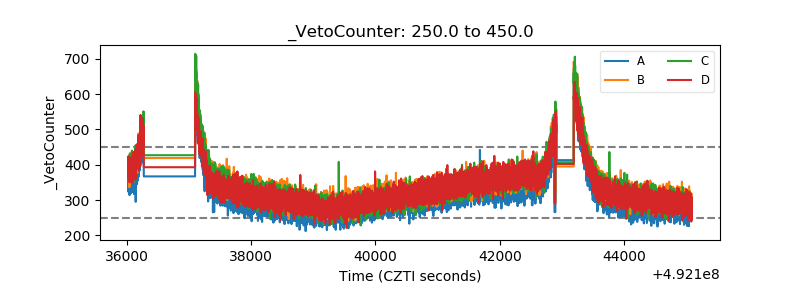 |