| Param | Original file | Final file |
|---|---|---|
| Filename | modeM0/AS1C09_011T08_9000006492_53335cztM0_level2.fits | modeM0/AS1C09_011T08_9000006492_53335cztM0_level2_quad_clean.evt |
| Size (bytes) | 618,232,320 | 98,850,240 |
| Size | 589.6 MB | 94.3 MB |
| Events in quadrant A | 5,070,478 | 653,457 |
| Events in quadrant B | 4,123,622 | 713,653 |
| Events in quadrant C | 8,894,591 | 533,048 |
| Events in quadrant D | 4,252,424 | 603,725 |
| Mode M0 | |||
|---|---|---|---|
| Quadrant | BADHDUFLAG | Total packets | Discarded packets |
| A | 0 | 19802 | 2 |
| B | 0 | 17068 | 2 |
| C | 0 | 31354 | 2 |
| D | 0 | 17369 | 2 |
| Mode M9 | |||
|---|---|---|---|
| Quadrant | BADHDUFLAG | Total packets | Discarded packets |
| A | 0 | 11 | 0 |
| B | 0 | 12 | 0 |
| C | 0 | 12 | 0 |
| D | 0 | 12 | 0 |
| Mode SS | |||
|---|---|---|---|
| Quadrant | BADHDUFLAG | Total packets | Discarded packets |
| A | 0 | 142 | 0 |
| B | 0 | 142 | 0 |
| C | 0 | 142 | 0 |
| D | 0 | 142 | 0 |
| Quadrant | Total seconds | Saturated seconds | Saturation percentage |
|---|---|---|---|
| A | 7020 | 322 | 4.586895% |
| B | 7020 | 173 | 2.464387% |
| C | 7020 | 1447 | 20.612536% |
| D | 7020 | 116 | 1.652422% |
Noise dominated data is calculated using 1-second bins in cleaned event files. If a bin has >2000 counts, and if more than 50% of those come from <1% of pixels, then it is considered to be noise-dominated and hence unusable.
| Quadrant | # 1 sec bins | Bins with >0 counts | Bins with >2000 counts | High rate bins dominated by noise | Noise dominated (total time) | Noise dominated (detector-on time) | Marked lightcurve |
|---|---|---|---|---|---|---|---|
| A | 7915 | 7021 | 275 | 275 | 3.47% | 3.92% | 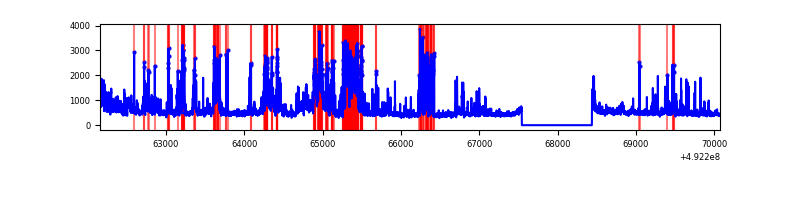 |
| B | 7915 | 7021 | 87 | 87 | 1.10% | 1.24% | 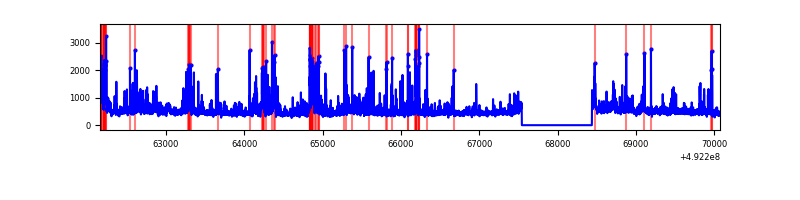 |
| C | 7915 | 7021 | 1257 | 1257 | 15.88% | 17.90% | 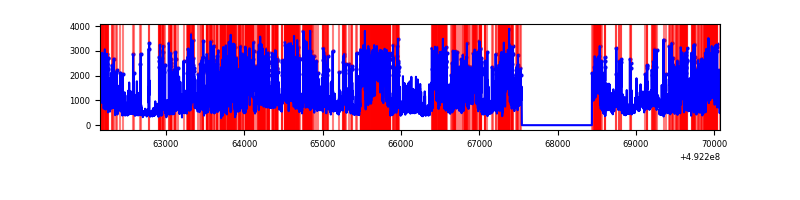 |
| D | 7915 | 7021 | 72 | 72 | 0.91% | 1.03% | 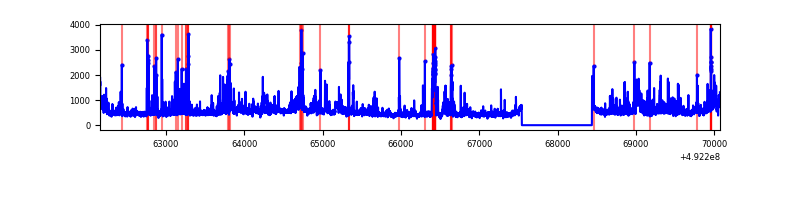 |
Top three noisy pixels from each quadrant. If the there are fewer than three noisy pixels in the level2.evt file, extra rows are filled as -1
| Pixel properties | Quadrant properties | ||||||
|---|---|---|---|---|---|---|---|
| Quadrant | DetID | PixID | Counts | Sigma | Mean | Median | Sigma |
| A | 15 | 174 | 732171 | 3927.05 | 747 | 726 | 186.3 |
| A | 12 | 115 | 523528 | 2806.87 | 747 | 726 | 186.3 |
| A | 0 | 8 | 308967 | 1654.91 | 747 | 726 | 186.3 |
| B | 1 | 255 | 182126 | 1149.82 | 740 | 715 | 157.8 |
| B | 4 | 81 | 177174 | 1118.43 | 740 | 715 | 157.8 |
| B | 10 | 28 | 121266 | 764.08 | 740 | 715 | 157.8 |
| C | 15 | 224 | 2814955 | 15023.46 | 674 | 668 | 187.3 |
| C | 1 | 241 | 1168514 | 6234.29 | 674 | 668 | 187.3 |
| C | 15 | 158 | 955698 | 5098.22 | 674 | 668 | 187.3 |
| D | 2 | 62 | 350049 | 1661.24 | 730 | 698 | 210.3 |
| D | 1 | 3 | 179905 | 852.17 | 730 | 698 | 210.3 |
| D | 2 | 249 | 139029 | 657.79 | 730 | 698 | 210.3 |
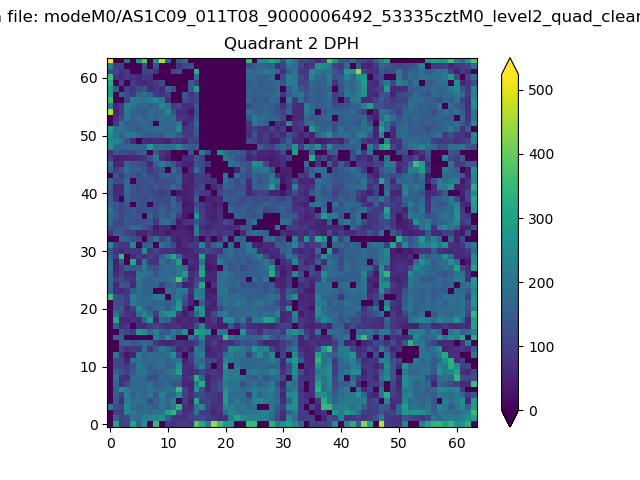
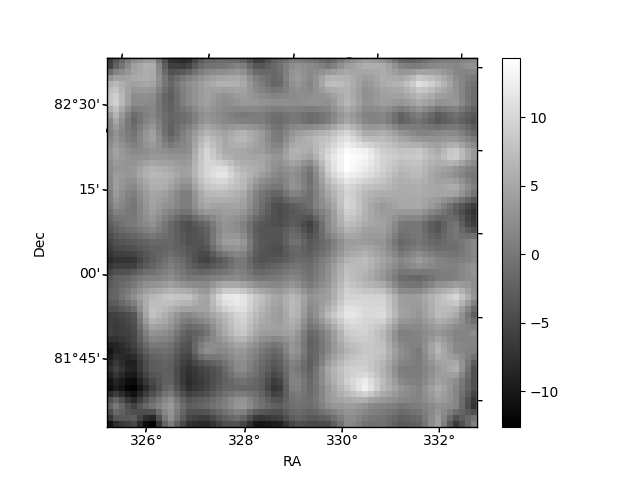
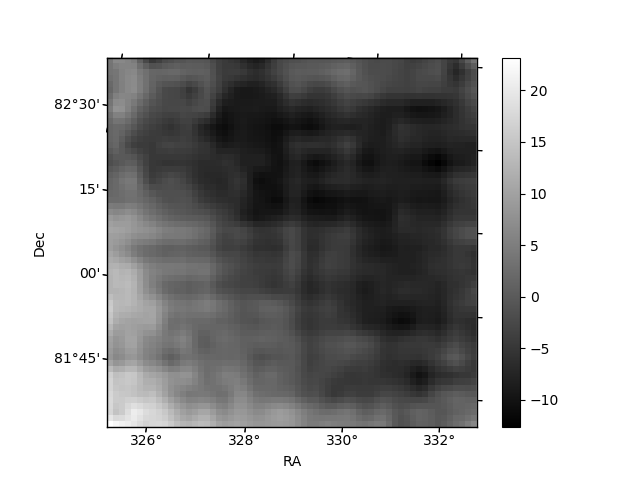
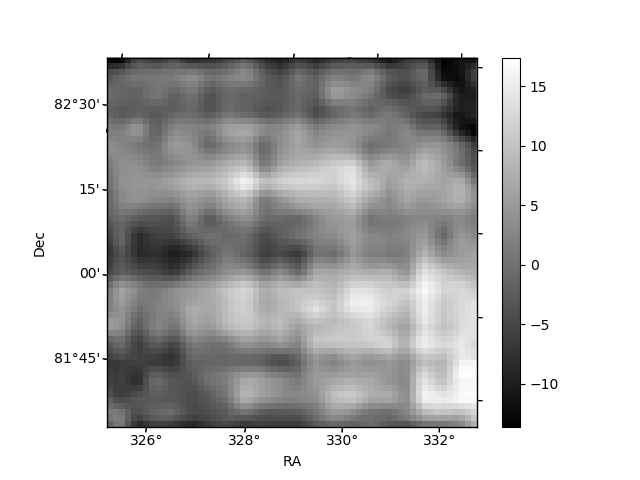
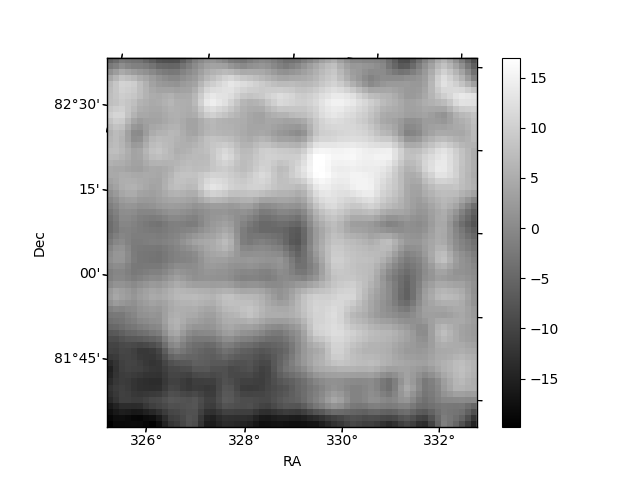
Histogram calculated using DETX and DETY for each event in the final _common_clean file
| Quadrant A | 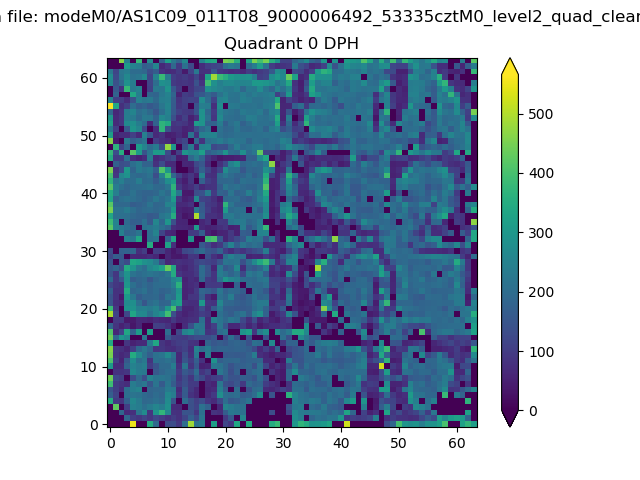 |
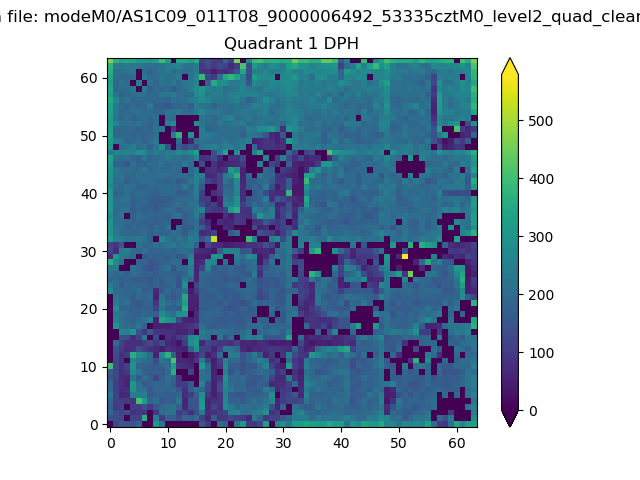 |
Quadrant B |
|---|---|---|---|
| Quadrant D | 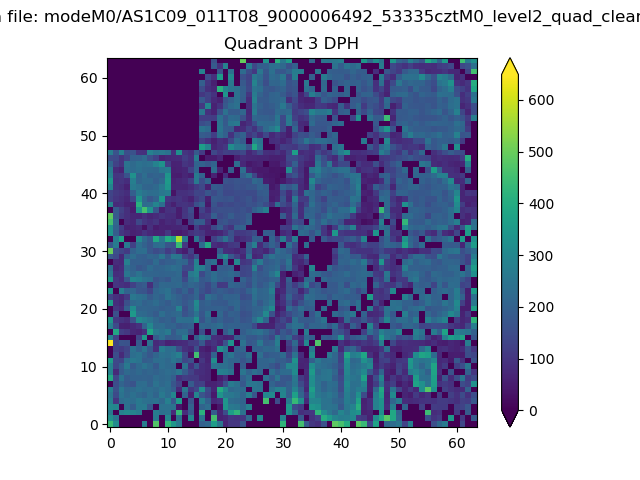 |
 |
Quadrant C |
| Plot type | Count rate plots | Images |
|---|---|---|
| Comparison with Poisson distribution Blue bars denote a histogram of data divided into 1 sec bins. Red curve is a Poisson curve with rate = median count rate of data. |
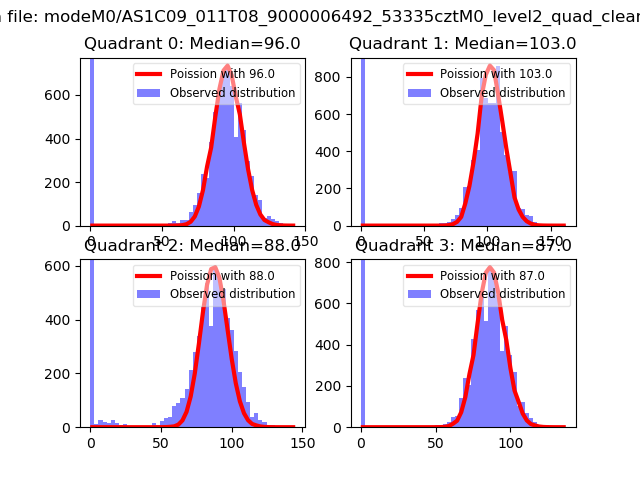 |
 |
| Quadrant-wise count rates Data is divided into 100 sec bins |
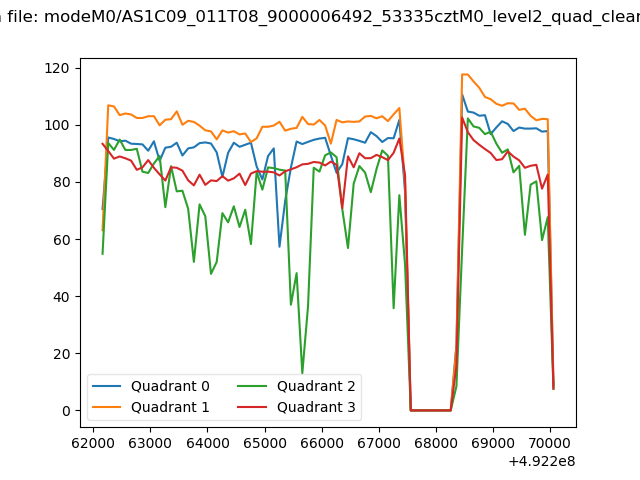 |
|
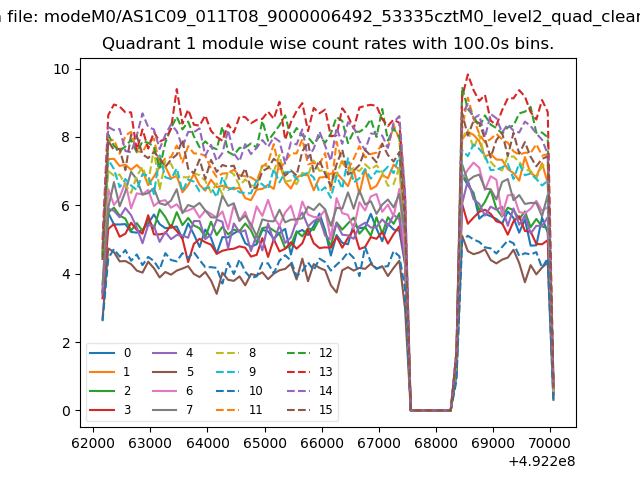
| Module-wise count rates for Quadrant A Data is divided into 100 sec bins |
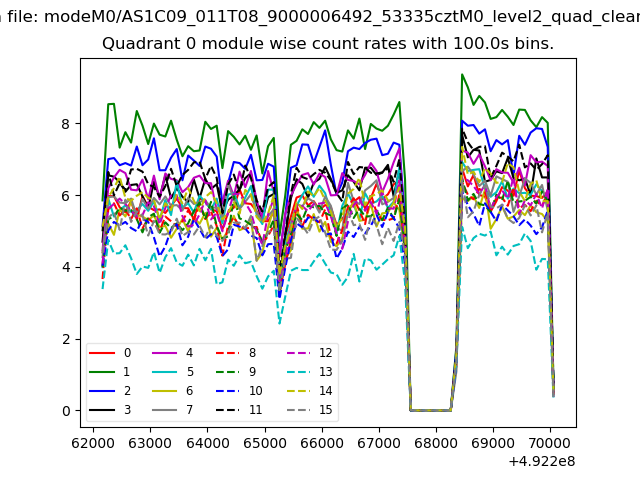 |
 |
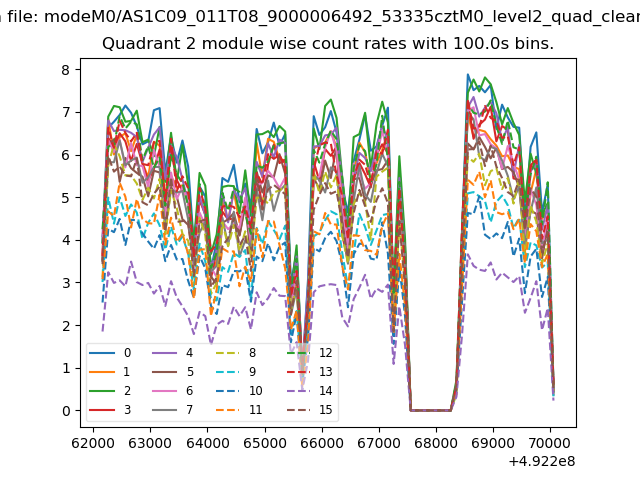
| Module-wise count rates for Quadrant B Data is divided into 100 sec bins |
 |
 |
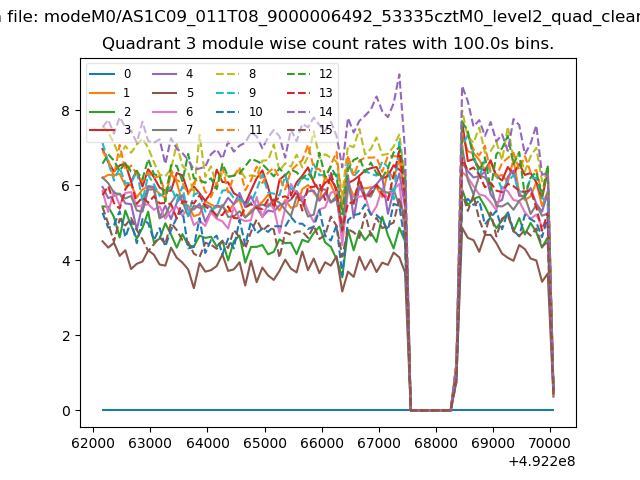
| Module-wise count rates for Quadrant C Data is divided into 100 sec bins |
 |
 |
| Module-wise count rates for Quadrant D Data is divided into 100 sec bins |
 |
 |
| Parameter | Plot |
|---|---|
| CZT HV Monitor | 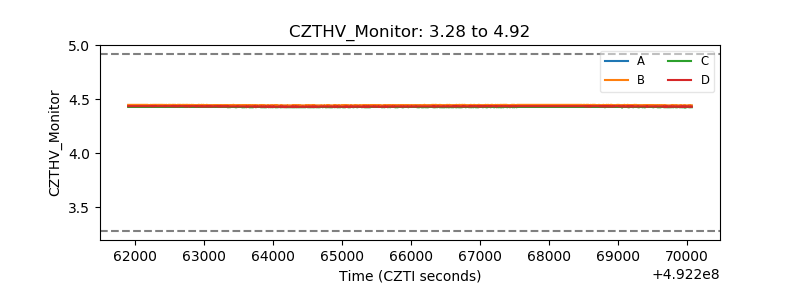 |
| D_VDD | 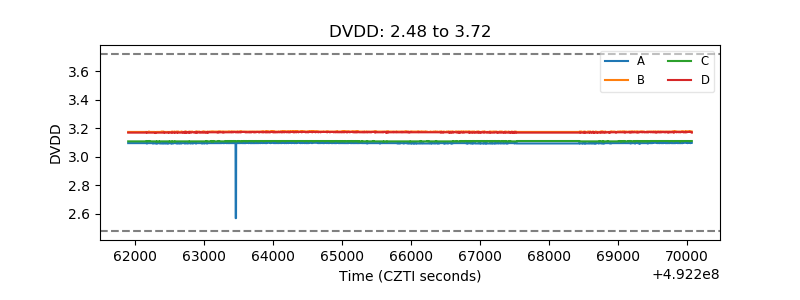 |
| Temperature 1 | 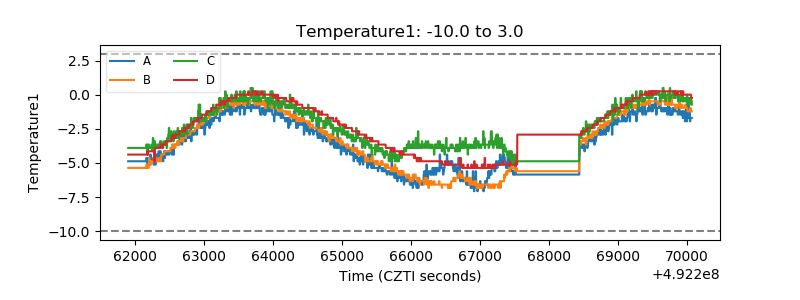 |
| Veto HV Monitor | 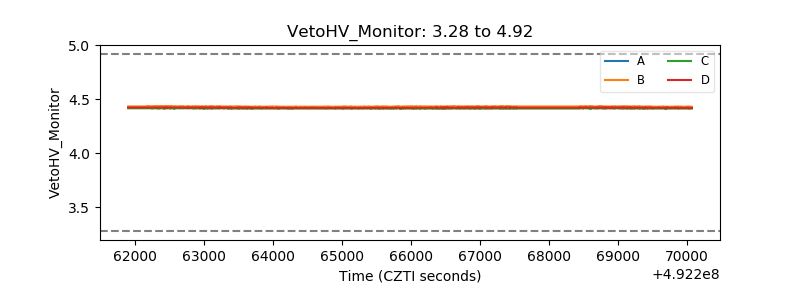 |
| Veto LLD | 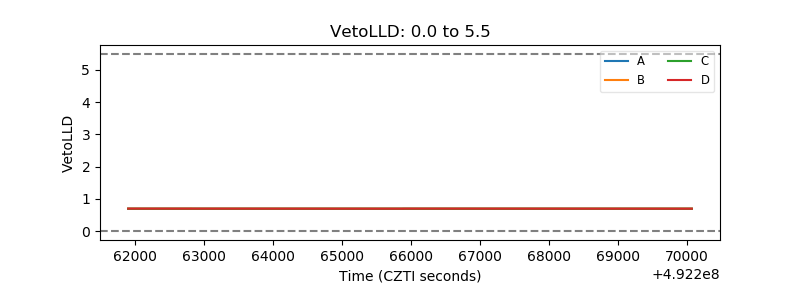 |
| Alpha Counter | 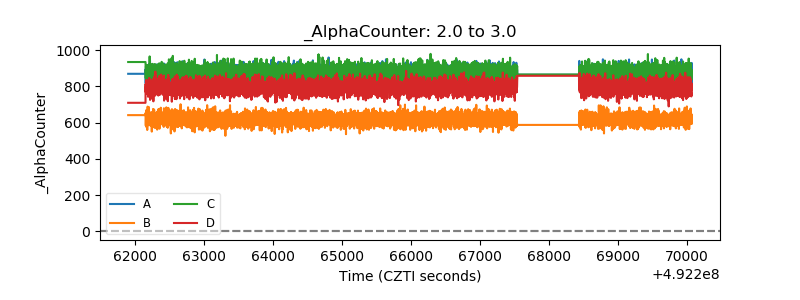 |
| _CPM_Rate | 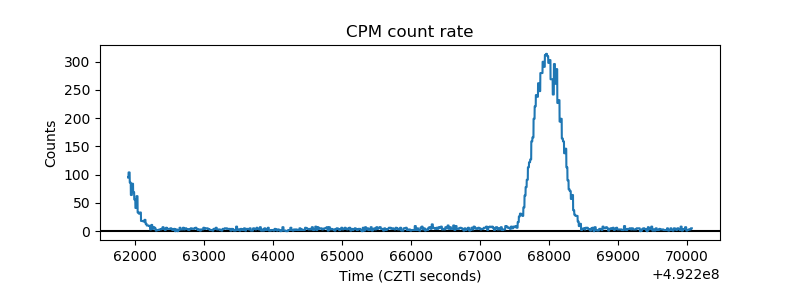 |
| CZT Counter | 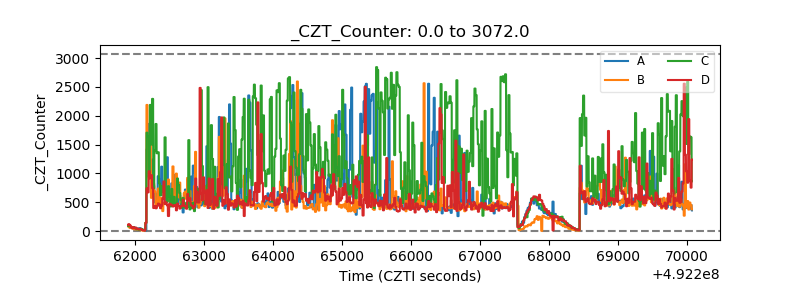 |
| +2.5 Volts monitor |  |
| +5 Volts monitor |  |
| _ROLL_ROT | 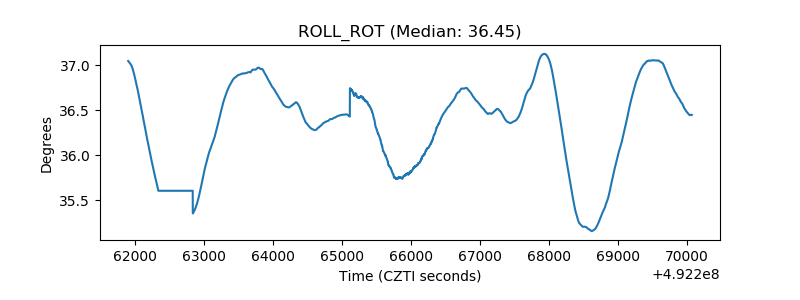 |
| _Roll_DEC | 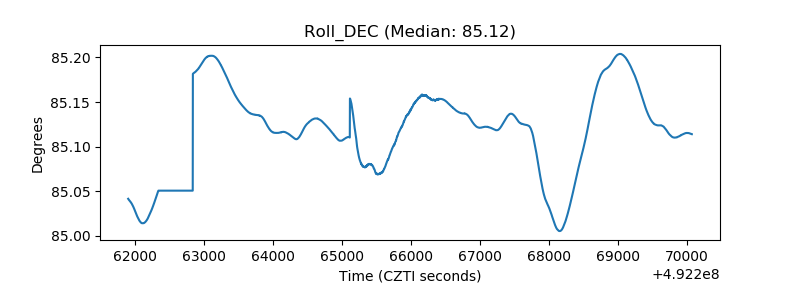 |
| _Roll_RA | 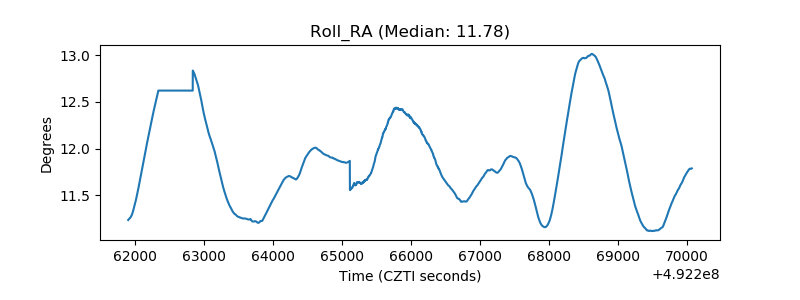 |
| Veto Counter | 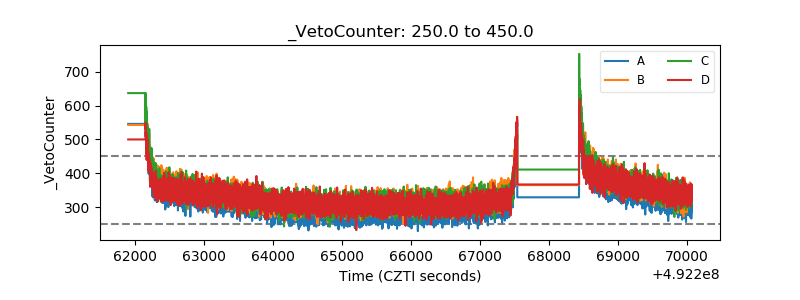 |