| Param | Original file | Final file |
|---|---|---|
| Filename | modeM0/AS1C09_011T08_9000006492_53343cztM0_level2.fits | modeM0/AS1C09_011T08_9000006492_53343cztM0_level2_quad_clean.evt |
| Size (bytes) | 1,303,197,120 | 158,826,240 |
| Size | 1.2 GB | 151.5 MB |
| Events in quadrant A | 9,578,643 | 1,047,276 |
| Events in quadrant B | 9,490,814 | 1,168,045 |
| Events in quadrant C | 20,933,091 | 700,191 |
| Events in quadrant D | 7,283,686 | 1,039,056 |
| Mode M0 | |||
|---|---|---|---|
| Quadrant | BADHDUFLAG | Total packets | Discarded packets |
| A | 0 | 37558 | 2 |
| B | 0 | 37088 | 2 |
| C | 0 | 70791 | 2 |
| D | 0 | 31009 | 2 |
| Mode M9 | |||
|---|---|---|---|
| Quadrant | BADHDUFLAG | Total packets | Discarded packets |
| A | 0 | 13 | 0 |
| B | 0 | 13 | 0 |
| C | 0 | 13 | 0 |
| D | 0 | 13 | 0 |
| Mode SS | |||
|---|---|---|---|
| Quadrant | BADHDUFLAG | Total packets | Discarded packets |
| A | 0 | 252 | 0 |
| B | 0 | 252 | 0 |
| C | 0 | 252 | 0 |
| D | 0 | 252 | 0 |
| Quadrant | Total seconds | Saturated seconds | Saturation percentage |
|---|---|---|---|
| A | 12349 | 1345 | 10.891570% |
| B | 12349 | 1090 | 8.826626% |
| C | 12349 | 5246 | 42.481173% |
| D | 12349 | 318 | 2.575107% |
Noise dominated data is calculated using 1-second bins in cleaned event files. If a bin has >2000 counts, and if more than 50% of those come from <1% of pixels, then it is considered to be noise-dominated and hence unusable.
| Quadrant | # 1 sec bins | Bins with >0 counts | Bins with >2000 counts | High rate bins dominated by noise | Noise dominated (total time) | Noise dominated (detector-on time) | Marked lightcurve |
|---|---|---|---|---|---|---|---|
| A | 13654 | 12351 | 1169 | 1169 | 8.56% | 9.46% | 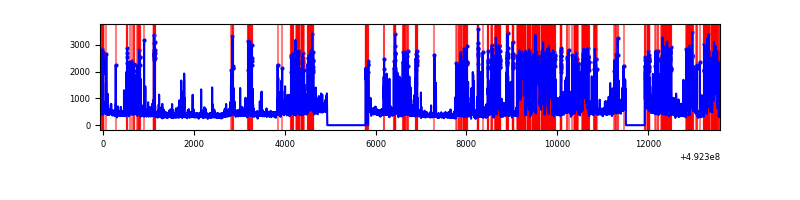 |
| B | 13654 | 12350 | 712 | 712 | 5.21% | 5.77% | 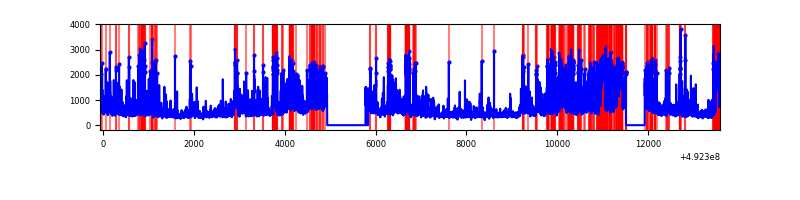 |
| C | 13654 | 12349 | 4770 | 4770 | 34.93% | 38.63% | 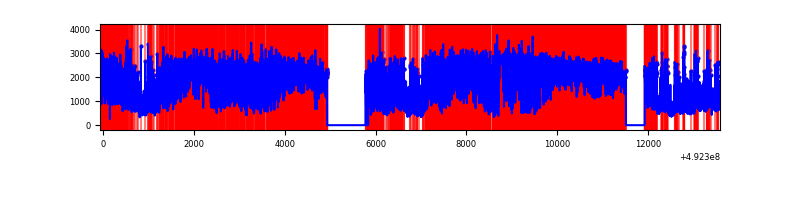 |
| D | 13654 | 12351 | 274 | 274 | 2.01% | 2.22% | 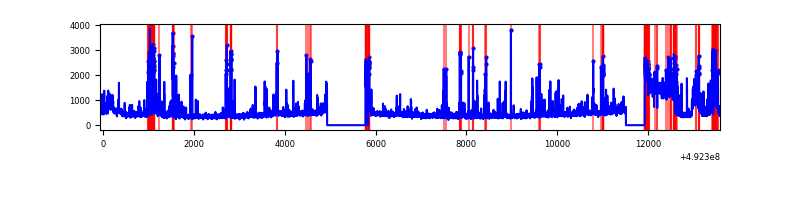 |
Top three noisy pixels from each quadrant. If the there are fewer than three noisy pixels in the level2.evt file, extra rows are filled as -1
| Pixel properties | Quadrant properties | ||||||
|---|---|---|---|---|---|---|---|
| Quadrant | DetID | PixID | Counts | Sigma | Mean | Median | Sigma |
| A | 15 | 174 | 3390699 | 11353.39 | 1210 | 1179 | 298.5 |
| A | 12 | 80 | 430065 | 1436.58 | 1210 | 1179 | 298.5 |
| A | 0 | 8 | 292472 | 975.7 | 1210 | 1179 | 298.5 |
| B | 4 | 206 | 1636197 | 6347.17 | 1229 | 1186 | 257.6 |
| B | 10 | 28 | 1156766 | 4486.0 | 1229 | 1186 | 257.6 |
| B | 4 | 171 | 335883 | 1299.31 | 1229 | 1186 | 257.6 |
| C | 15 | 158 | 6562663 | 22713.99 | 1047 | 1037 | 288.9 |
| C | 15 | 224 | 4013368 | 13889.25 | 1047 | 1037 | 288.9 |
| C | 9 | 38 | 3389147 | 11728.42 | 1047 | 1037 | 288.9 |
| D | 2 | 62 | 810957 | 2325.63 | 1224 | 1169 | 348.2 |
| D | 10 | 172 | 499677 | 1431.66 | 1224 | 1169 | 348.2 |
| D | 2 | 249 | 234394 | 669.8 | 1224 | 1169 | 348.2 |
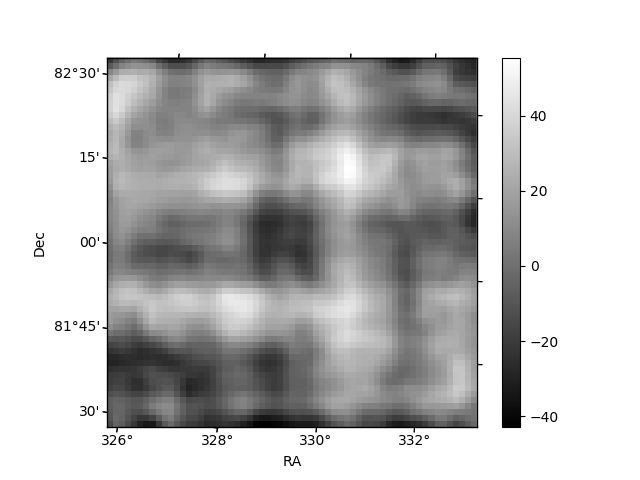
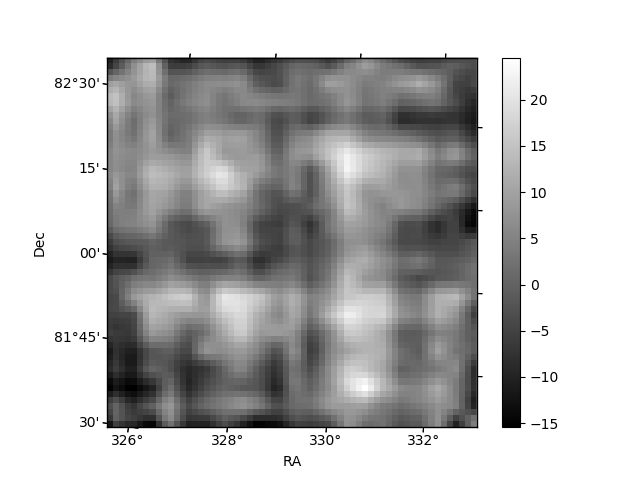
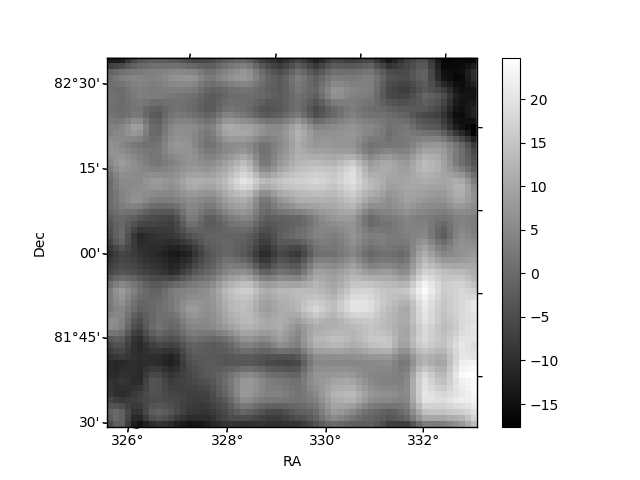
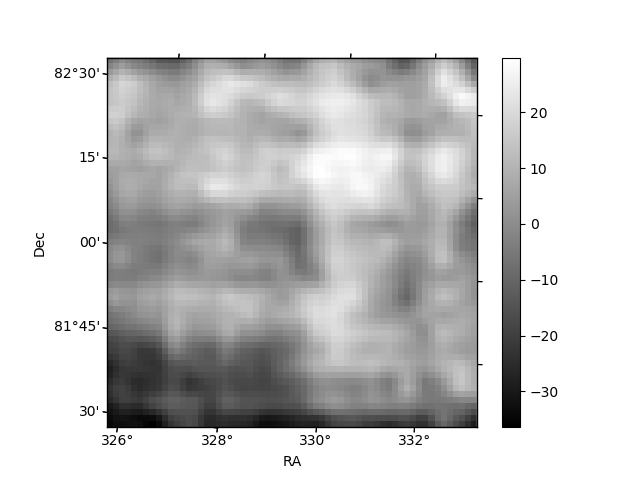
Histogram calculated using DETX and DETY for each event in the final _common_clean file
| Quadrant A | 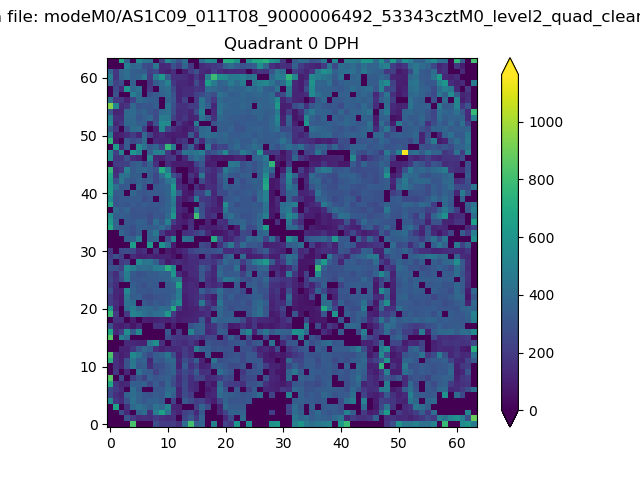 |
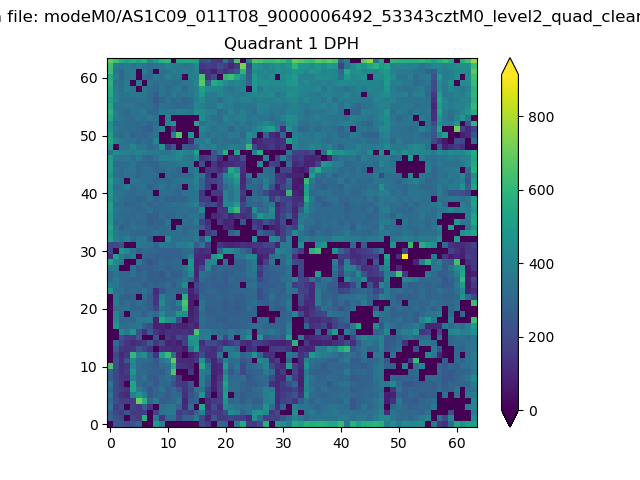 |
Quadrant B |
|---|---|---|---|
| Quadrant D | 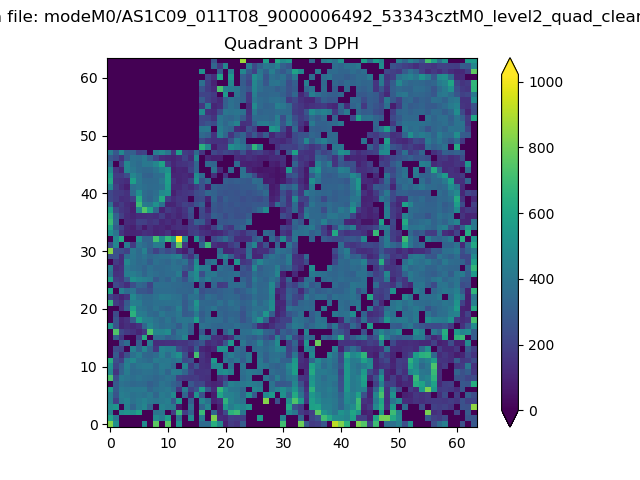 |
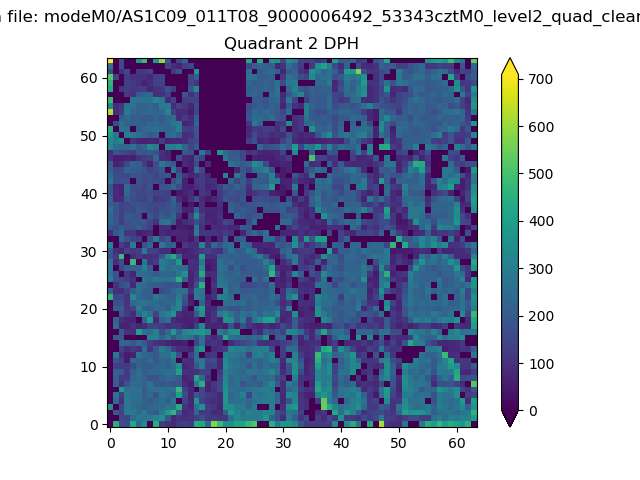 |
Quadrant C |
| Plot type | Count rate plots | Images |
|---|---|---|
| Comparison with Poisson distribution Blue bars denote a histogram of data divided into 1 sec bins. Red curve is a Poisson curve with rate = median count rate of data. |
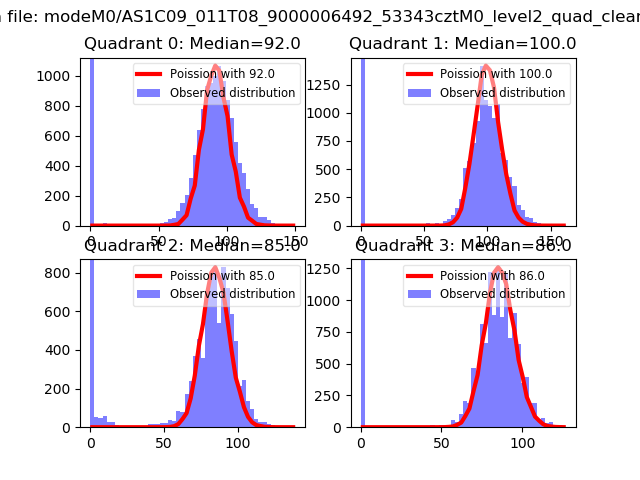 |
 |
| Quadrant-wise count rates Data is divided into 100 sec bins |
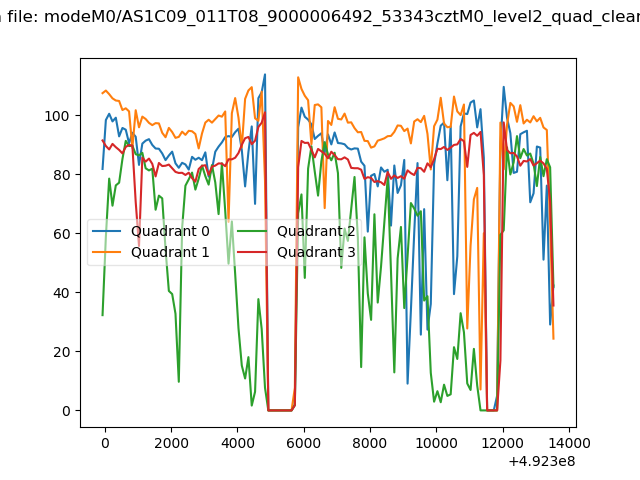 |
|
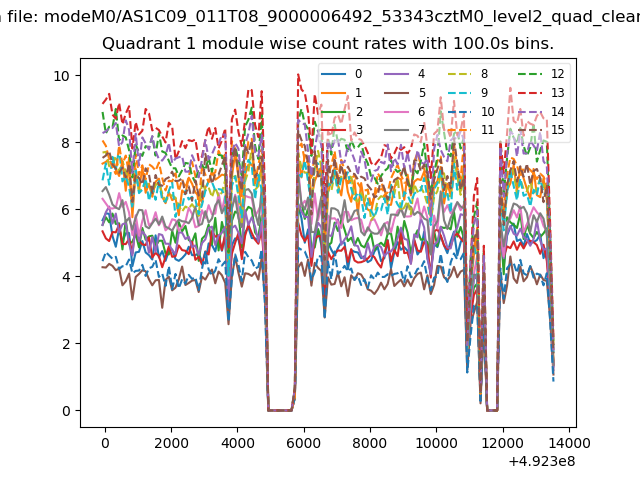
| Module-wise count rates for Quadrant A Data is divided into 100 sec bins |
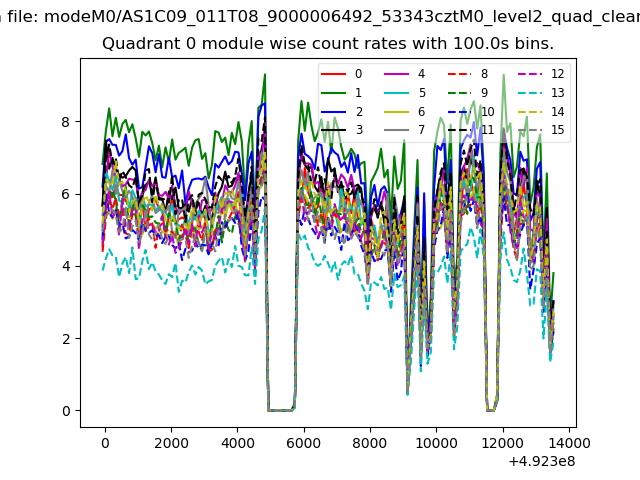 |
 |
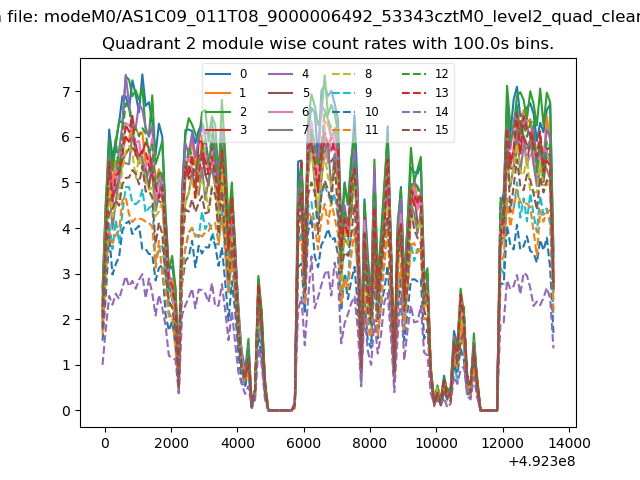
| Module-wise count rates for Quadrant B Data is divided into 100 sec bins |
 |
 |
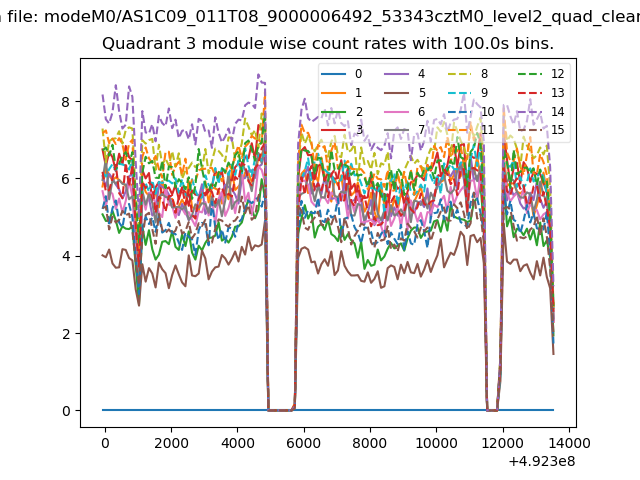
| Module-wise count rates for Quadrant C Data is divided into 100 sec bins |
 |
 |
| Module-wise count rates for Quadrant D Data is divided into 100 sec bins |
 |
 |
| Parameter | Plot |
|---|---|
| CZT HV Monitor | 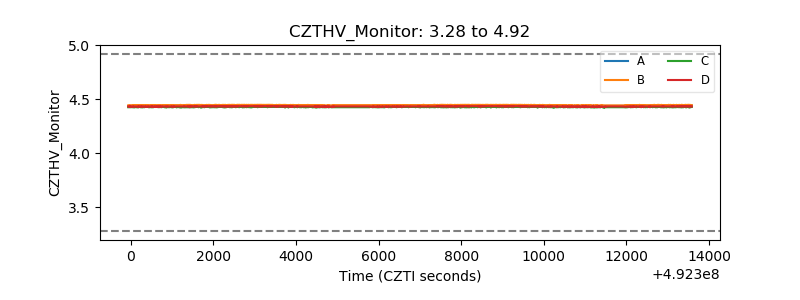 |
| D_VDD | 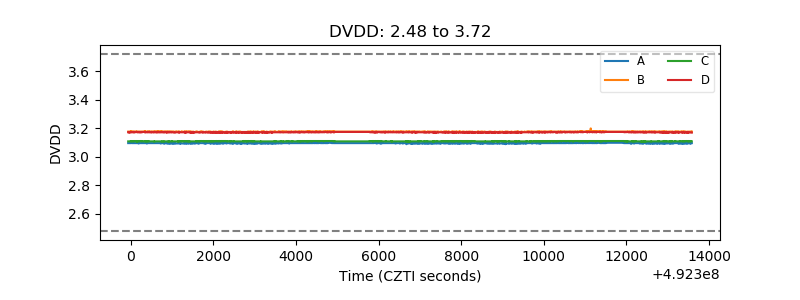 |
| Temperature 1 | 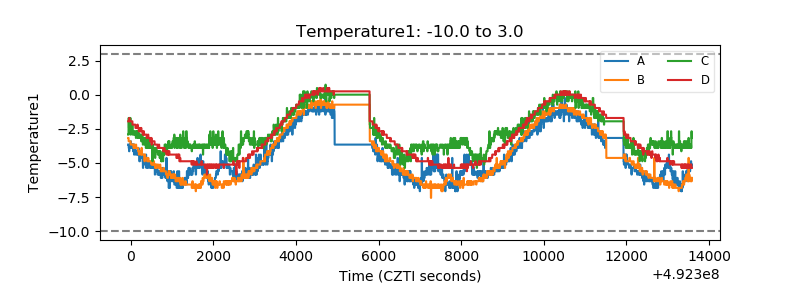 |
| Veto HV Monitor | 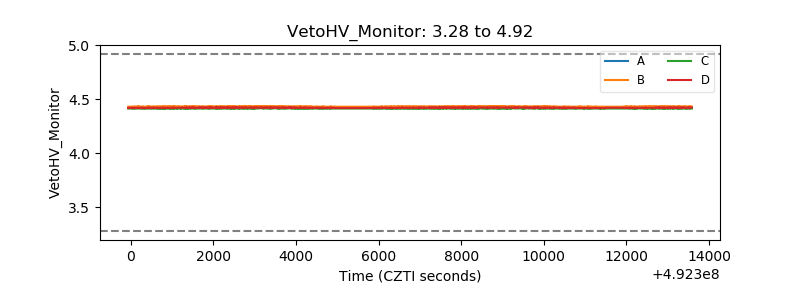 |
| Veto LLD | 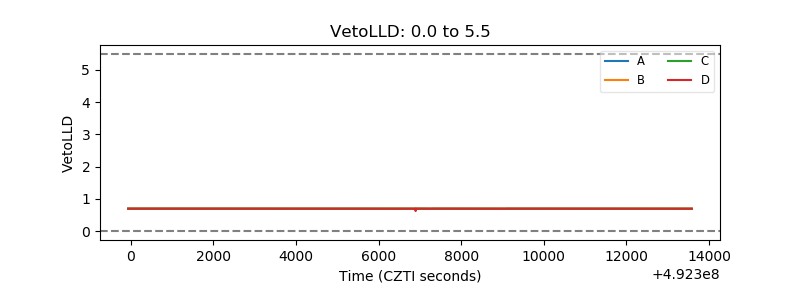 |
| Alpha Counter |  |
| _CPM_Rate | 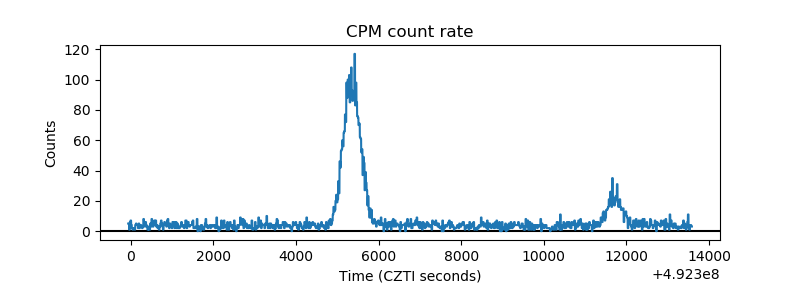 |
| CZT Counter | 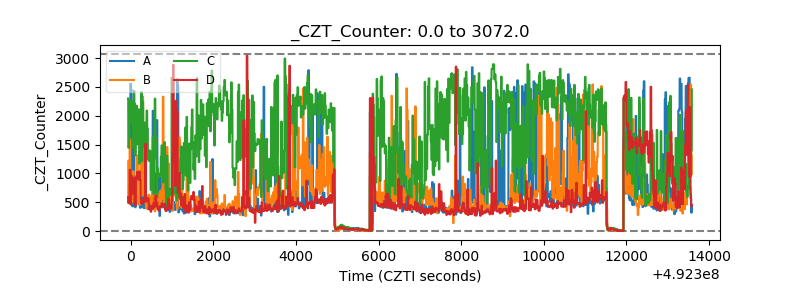 |
| +2.5 Volts monitor |  |
| +5 Volts monitor |  |
| _ROLL_ROT | 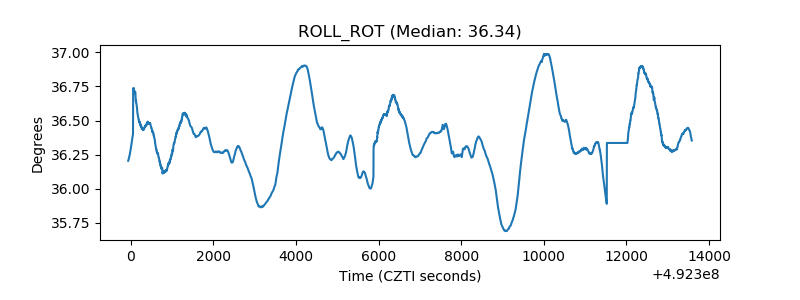 |
| _Roll_DEC | 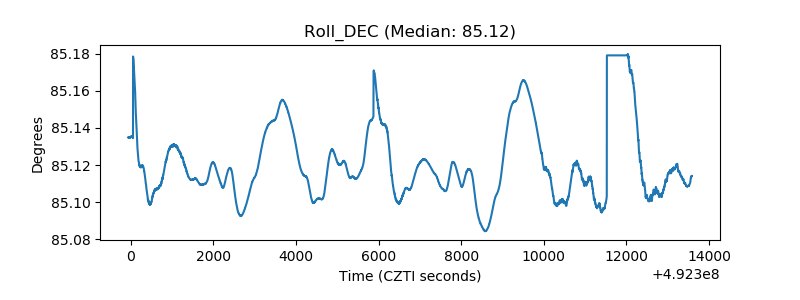 |
| _Roll_RA | 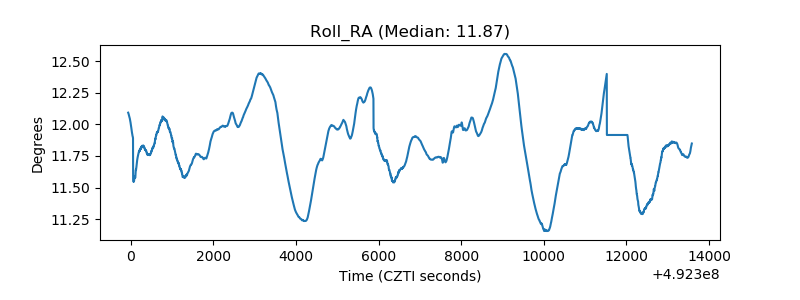 |
| Veto Counter | 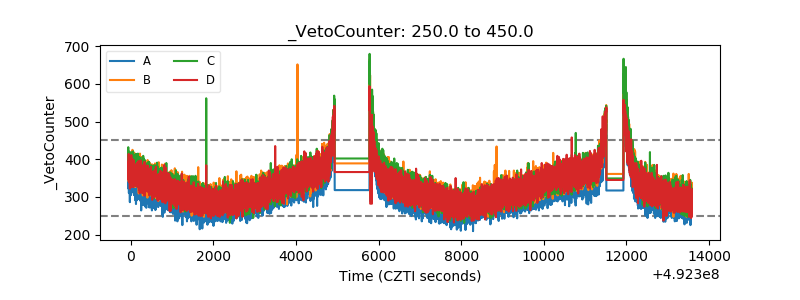 |