| Param | Original file | Final file |
|---|---|---|
| Filename | modeM0/AS1C09_011T08_9000006492_53344cztM0_level2.fits | modeM0/AS1C09_011T08_9000006492_53344cztM0_level2_quad_clean.evt |
| Size (bytes) | 869,359,680 | 101,779,200 |
| Size | 829.1 MB | 97.1 MB |
| Events in quadrant A | 6,695,141 | 671,524 |
| Events in quadrant B | 7,435,952 | 690,548 |
| Events in quadrant C | 12,154,489 | 502,984 |
| Events in quadrant D | 5,281,389 | 664,691 |
| Mode M0 | |||
|---|---|---|---|
| Quadrant | BADHDUFLAG | Total packets | Discarded packets |
| A | 0 | 25560 | 3 |
| B | 0 | 27627 | 0 |
| C | 0 | 41649 | 0 |
| D | 0 | 21697 | 0 |
| Mode SS | |||
|---|---|---|---|
| Quadrant | BADHDUFLAG | Total packets | Discarded packets |
| A | 0 | 158 | 0 |
| B | 0 | 158 | 0 |
| C | 0 | 158 | 0 |
| D | 0 | 158 | 0 |
| Quadrant | Total seconds | Saturated seconds | Saturation percentage |
|---|---|---|---|
| A | 7934 | 1000 | 12.603983% |
| B | 7935 | 1341 | 16.899811% |
| C | 7935 | 2749 | 34.643982% |
| D | 7935 | 303 | 3.818526% |
Noise dominated data is calculated using 1-second bins in cleaned event files. If a bin has >2000 counts, and if more than 50% of those come from <1% of pixels, then it is considered to be noise-dominated and hence unusable.
| Quadrant | # 1 sec bins | Bins with >0 counts | Bins with >2000 counts | High rate bins dominated by noise | Noise dominated (total time) | Noise dominated (detector-on time) | Marked lightcurve |
|---|---|---|---|---|---|---|---|
| A | 7934 | 7934 | 930 | 930 | 11.72% | 11.72% | 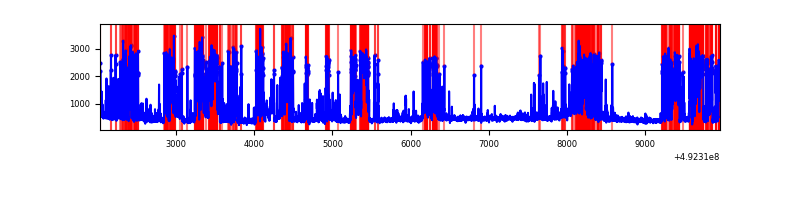 |
| B | 7935 | 7935 | 989 | 989 | 12.46% | 12.46% | 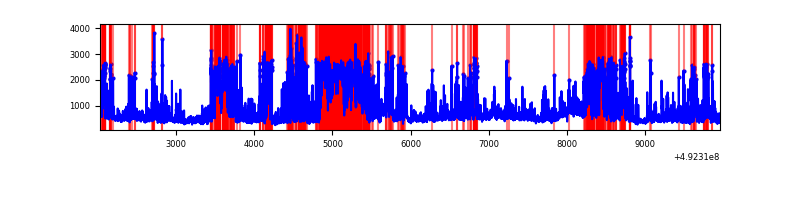 |
| C | 7935 | 7935 | 2378 | 2378 | 29.97% | 29.97% | 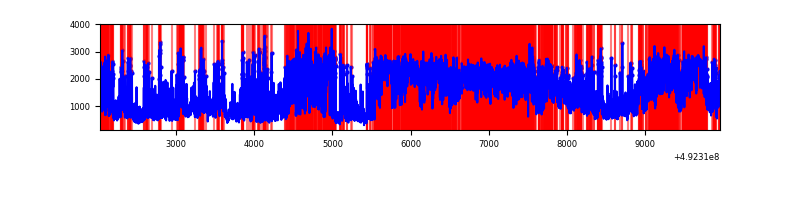 |
| D | 7935 | 7935 | 270 | 270 | 3.40% | 3.40% | 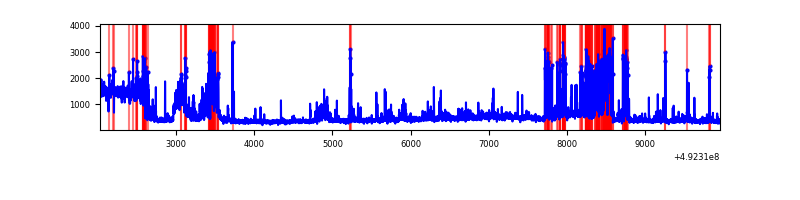 |
Top three noisy pixels from each quadrant. If the there are fewer than three noisy pixels in the level2.evt file, extra rows are filled as -1
| Pixel properties | Quadrant properties | ||||||
|---|---|---|---|---|---|---|---|
| Quadrant | DetID | PixID | Counts | Sigma | Mean | Median | Sigma |
| A | 15 | 174 | 2841792 | 14607.86 | 784 | 765 | 194.5 |
| A | 12 | 80 | 416337 | 2136.77 | 784 | 765 | 194.5 |
| A | 4 | 249 | 254092 | 1302.55 | 784 | 765 | 194.5 |
| B | 2 | 249 | 2246867 | 13924.93 | 756 | 727 | 161.3 |
| B | 4 | 206 | 869724 | 5387.34 | 756 | 727 | 161.3 |
| B | 10 | 28 | 612081 | 3790.09 | 756 | 727 | 161.3 |
| C | 15 | 158 | 4270523 | 21715.62 | 710 | 704 | 196.6 |
| C | 15 | 224 | 2084860 | 10599.69 | 710 | 704 | 196.6 |
| C | 9 | 38 | 917588 | 4663.13 | 710 | 704 | 196.6 |
| D | 2 | 62 | 604144 | 2693.62 | 787 | 752 | 224.0 |
| D | 8 | 176 | 588381 | 2623.26 | 787 | 752 | 224.0 |
| D | 10 | 172 | 417062 | 1858.46 | 787 | 752 | 224.0 |
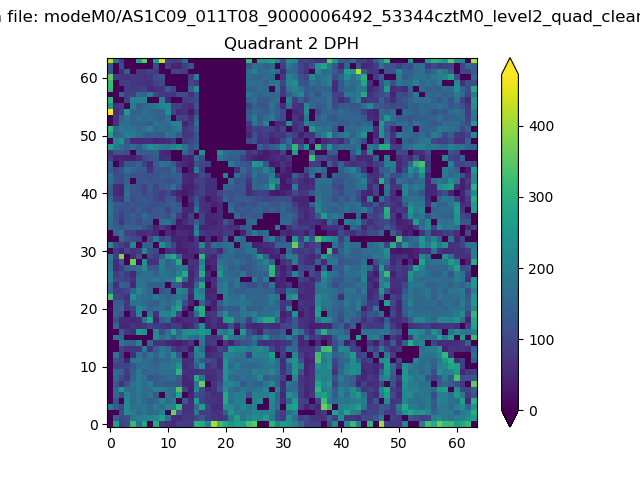
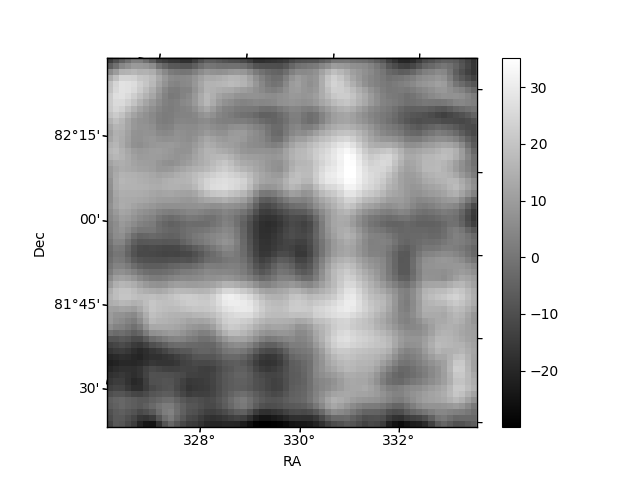
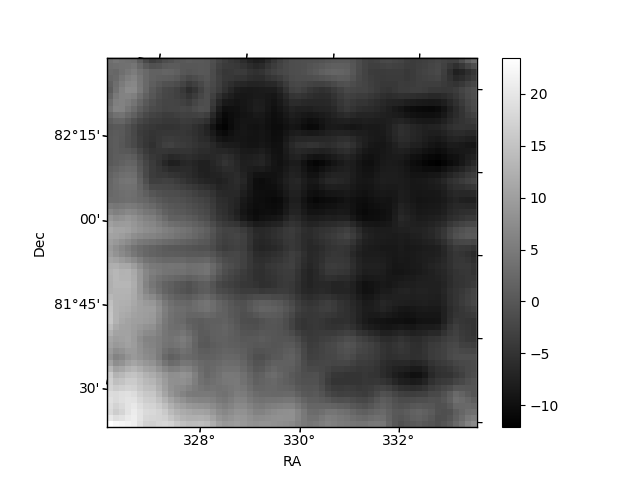
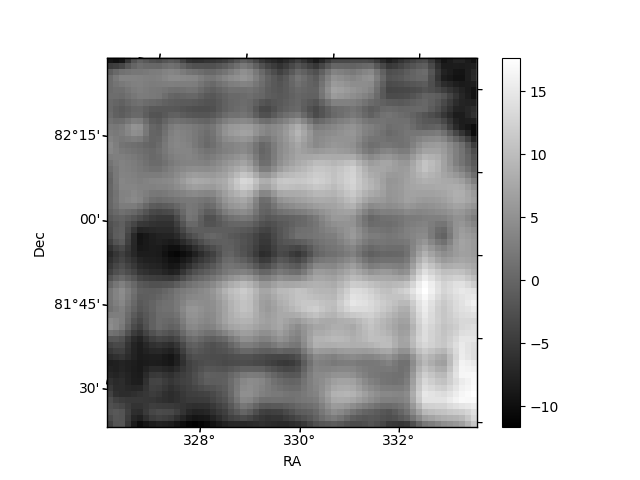
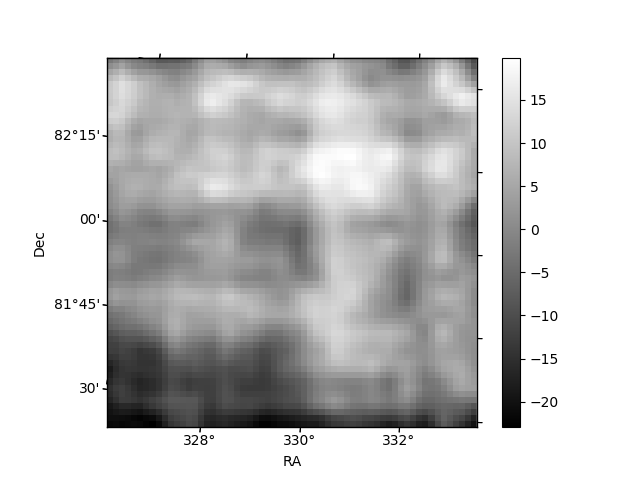
Histogram calculated using DETX and DETY for each event in the final _common_clean file
| Quadrant A | 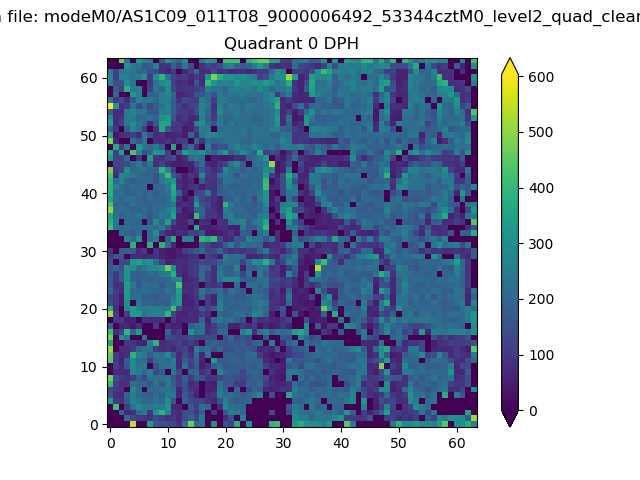 |
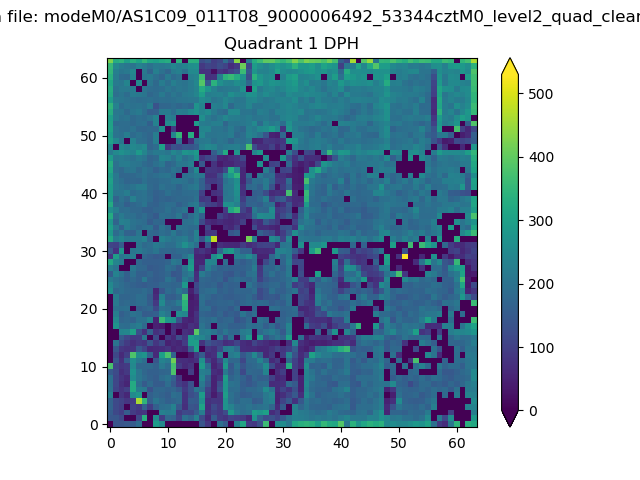 |
Quadrant B |
|---|---|---|---|
| Quadrant D | 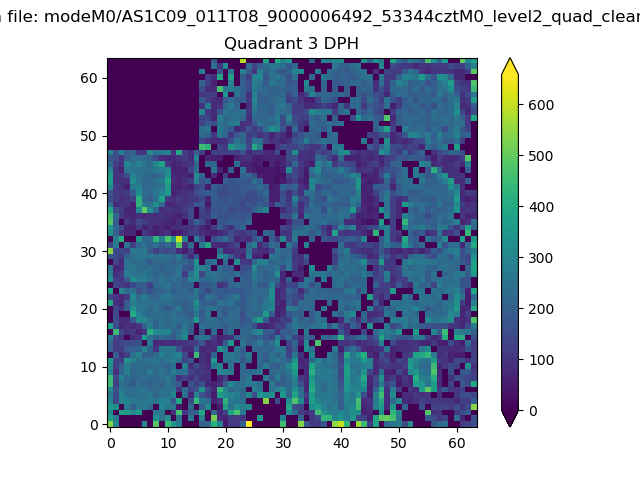 |
 |
Quadrant C |
| Plot type | Count rate plots | Images |
|---|---|---|
| Comparison with Poisson distribution Blue bars denote a histogram of data divided into 1 sec bins. Red curve is a Poisson curve with rate = median count rate of data. |
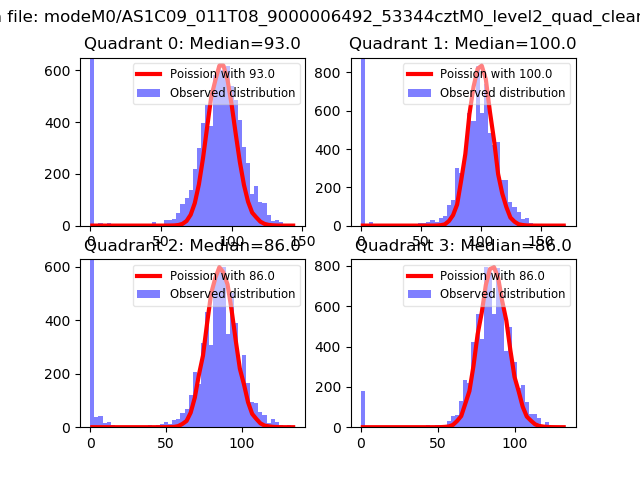 |
 |
| Quadrant-wise count rates Data is divided into 100 sec bins |
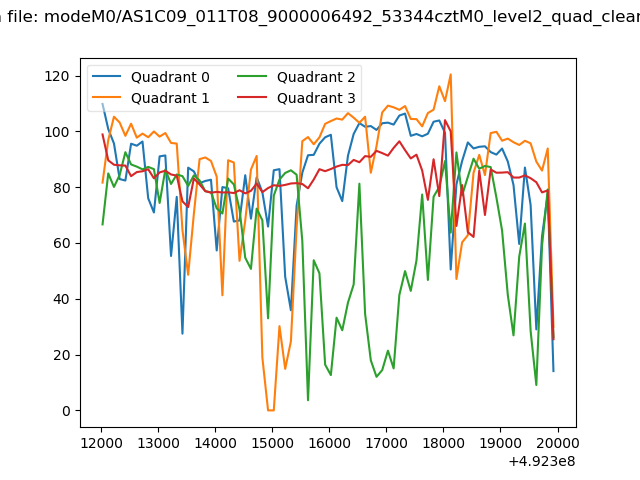 |
|
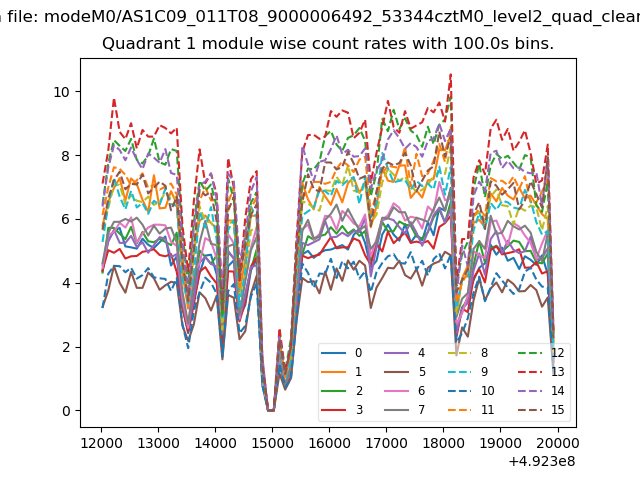
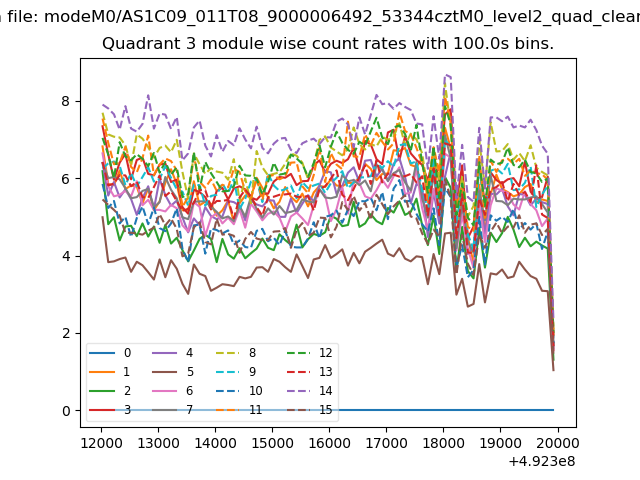
| Module-wise count rates for Quadrant A Data is divided into 100 sec bins |
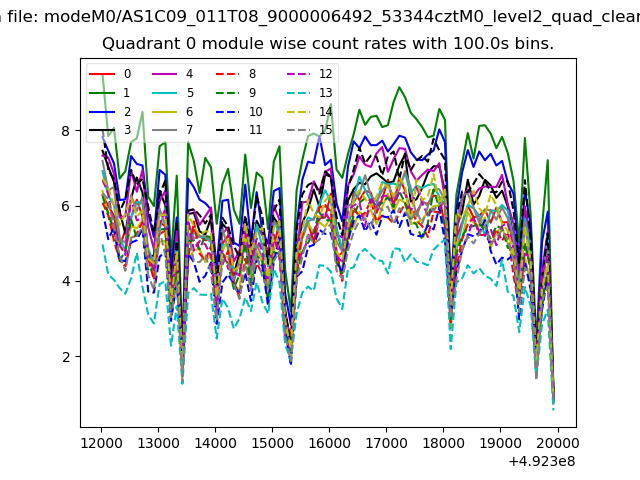 |
 |
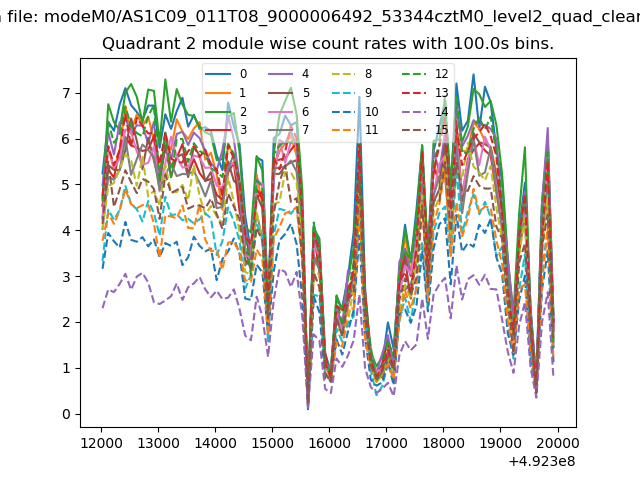
| Module-wise count rates for Quadrant B Data is divided into 100 sec bins |
 |
 |
| Module-wise count rates for Quadrant C Data is divided into 100 sec bins |
 |
 |
| Module-wise count rates for Quadrant D Data is divided into 100 sec bins |
 |
 |
| Parameter | Plot |
|---|---|
| CZT HV Monitor | 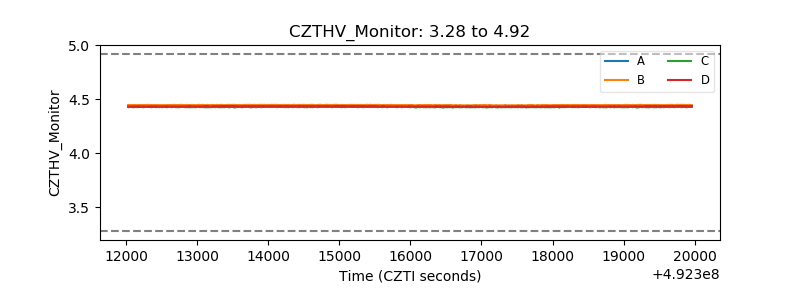 |
| D_VDD | 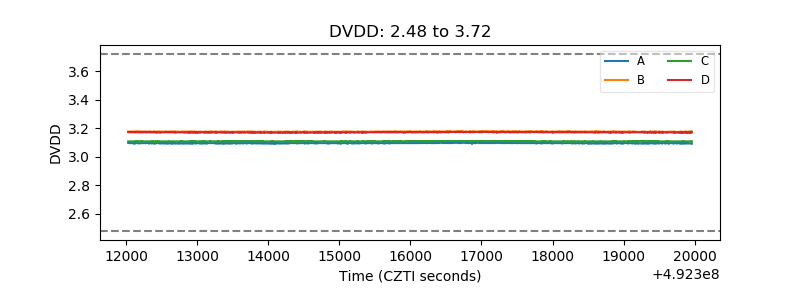 |
| Temperature 1 | 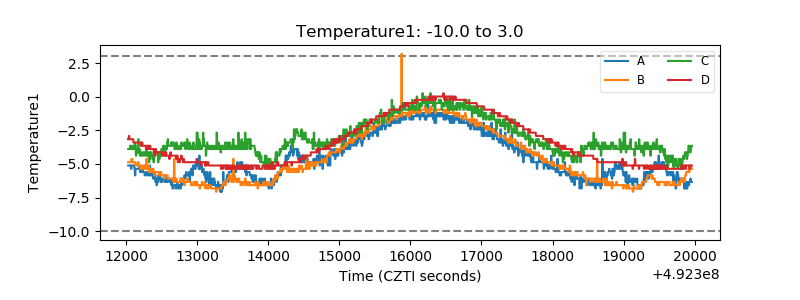 |
| Veto HV Monitor | 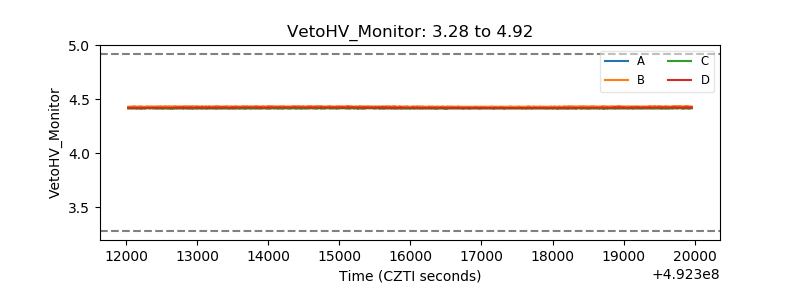 |
| Veto LLD | 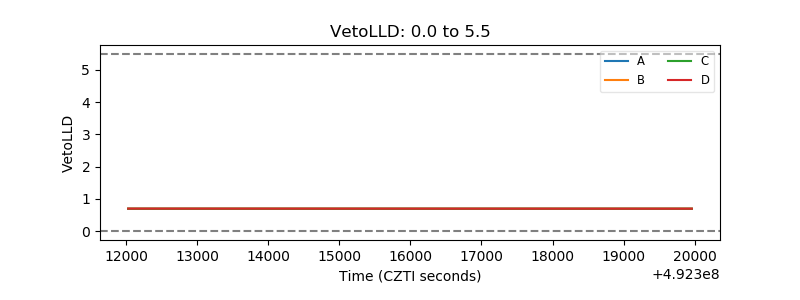 |
| Alpha Counter | 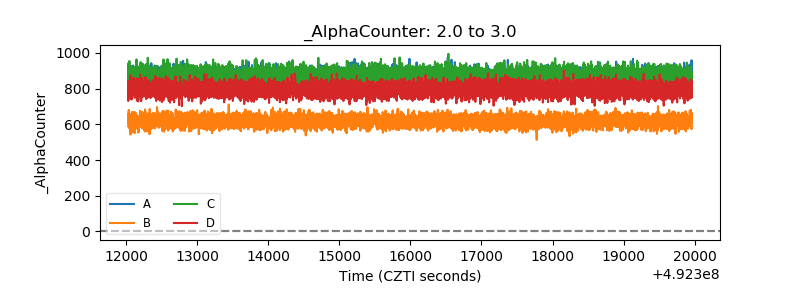 |
| _CPM_Rate | 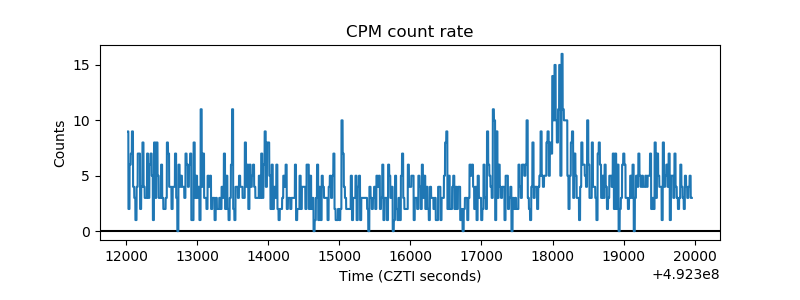 |
| CZT Counter | 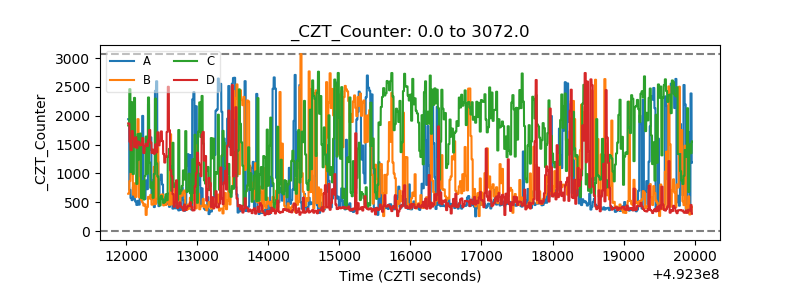 |
| +2.5 Volts monitor |  |
| +5 Volts monitor |  |
| _ROLL_ROT | 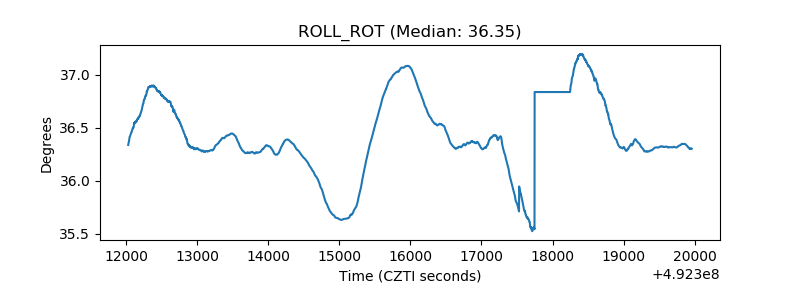 |
| _Roll_DEC | 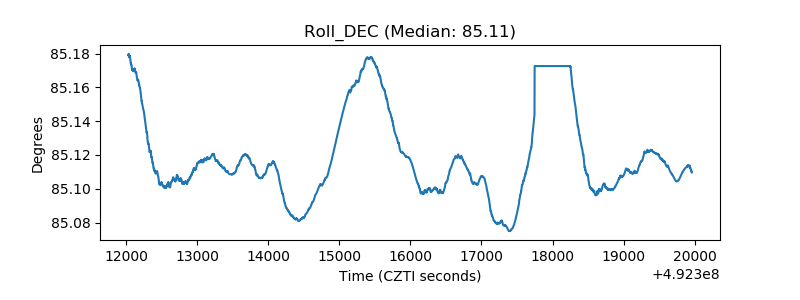 |
| _Roll_RA | 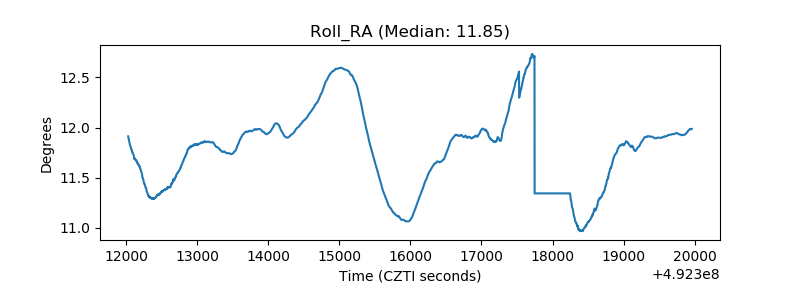 |
| Veto Counter | 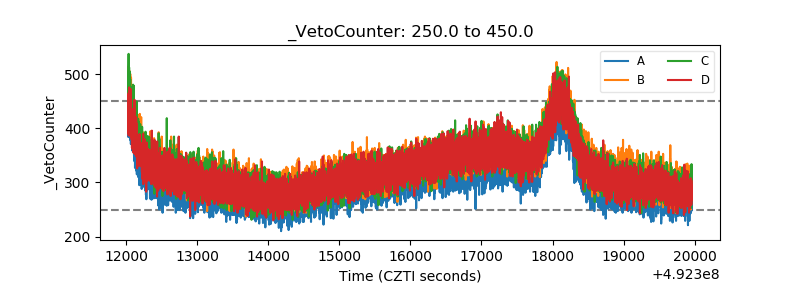 |