| Param | Original file | Final file |
|---|---|---|
| Filename | modeM0/AS1C09_011T08_9000006492_53345cztM0_level2.fits | modeM0/AS1C09_011T08_9000006492_53345cztM0_level2_quad_clean.evt |
| Size (bytes) | 951,894,720 | 96,166,080 |
| Size | 907.8 MB | 91.7 MB |
| Events in quadrant A | 6,802,288 | 653,499 |
| Events in quadrant B | 8,423,348 | 639,446 |
| Events in quadrant C | 14,023,333 | 419,952 |
| Events in quadrant D | 5,373,804 | 647,103 |
| Mode M0 | |||
|---|---|---|---|
| Quadrant | BADHDUFLAG | Total packets | Discarded packets |
| A | 0 | 25840 | 4 |
| B | 0 | 30566 | 0 |
| C | 0 | 47184 | 0 |
| D | 0 | 22106 | 0 |
| Mode SS | |||
|---|---|---|---|
| Quadrant | BADHDUFLAG | Total packets | Discarded packets |
| A | 0 | 158 | 0 |
| B | 0 | 158 | 0 |
| C | 0 | 158 | 0 |
| D | 0 | 158 | 0 |
| Quadrant | Total seconds | Saturated seconds | Saturation percentage |
|---|---|---|---|
| A | 7928 | 1121 | 14.139758% |
| B | 7928 | 1746 | 22.023209% |
| C | 7928 | 3811 | 48.070131% |
| D | 7929 | 428 | 5.397906% |
Noise dominated data is calculated using 1-second bins in cleaned event files. If a bin has >2000 counts, and if more than 50% of those come from <1% of pixels, then it is considered to be noise-dominated and hence unusable.
| Quadrant | # 1 sec bins | Bins with >0 counts | Bins with >2000 counts | High rate bins dominated by noise | Noise dominated (total time) | Noise dominated (detector-on time) | Marked lightcurve |
|---|---|---|---|---|---|---|---|
| A | 7927 | 7927 | 1083 | 1083 | 13.66% | 13.66% | 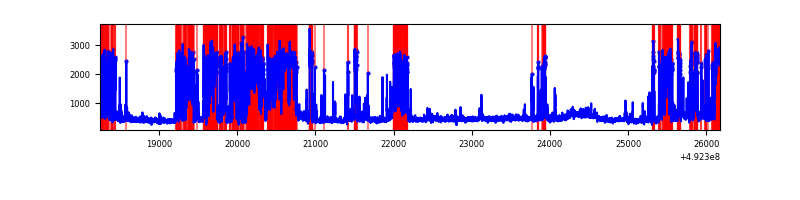 |
| B | 7927 | 7927 | 1400 | 1400 | 17.66% | 17.66% | 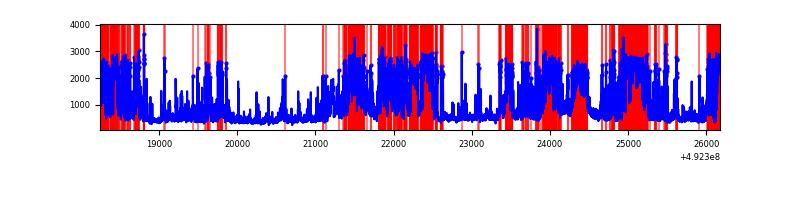 |
| C | 7928 | 7928 | 3221 | 3221 | 40.63% | 40.63% | 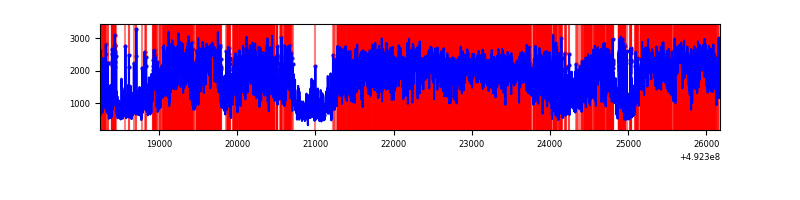 |
| D | 7929 | 7929 | 413 | 413 | 5.21% | 5.21% | 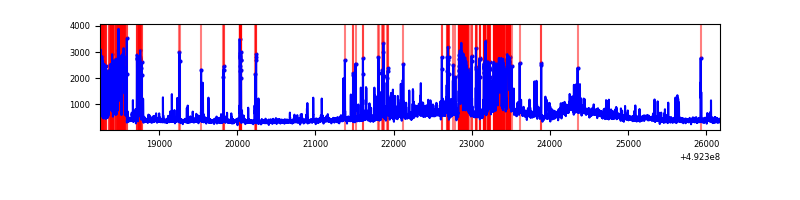 |
Top three noisy pixels from each quadrant. If the there are fewer than three noisy pixels in the level2.evt file, extra rows are filled as -1
| Pixel properties | Quadrant properties | ||||||
|---|---|---|---|---|---|---|---|
| Quadrant | DetID | PixID | Counts | Sigma | Mean | Median | Sigma |
| A | 15 | 174 | 3462806 | 17844.98 | 774 | 752 | 194.0 |
| A | 12 | 80 | 96542 | 493.74 | 774 | 752 | 194.0 |
| A | 3 | 27 | 64219 | 327.14 | 774 | 752 | 194.0 |
| B | 2 | 249 | 3327062 | 21443.11 | 732 | 706 | 155.1 |
| B | 4 | 206 | 766384 | 4935.89 | 732 | 706 | 155.1 |
| B | 10 | 28 | 518679 | 3339.08 | 732 | 706 | 155.1 |
| C | 15 | 158 | 6768473 | 36018.7 | 680 | 674 | 187.9 |
| C | 15 | 224 | 2304742 | 12262.41 | 680 | 674 | 187.9 |
| C | 12 | 252 | 579206 | 3078.99 | 680 | 674 | 187.9 |
| D | 8 | 176 | 1071528 | 4821.79 | 780 | 743 | 222.1 |
| D | 2 | 62 | 581576 | 2615.52 | 780 | 743 | 222.1 |
| D | 3 | 12 | 144693 | 648.21 | 780 | 743 | 222.1 |
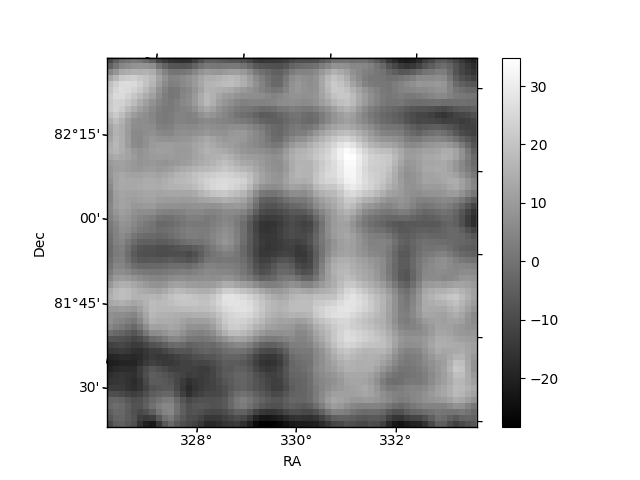
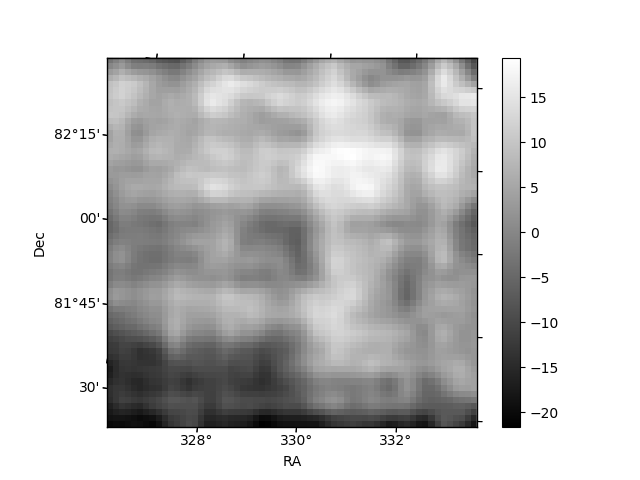
Histogram calculated using DETX and DETY for each event in the final _common_clean file
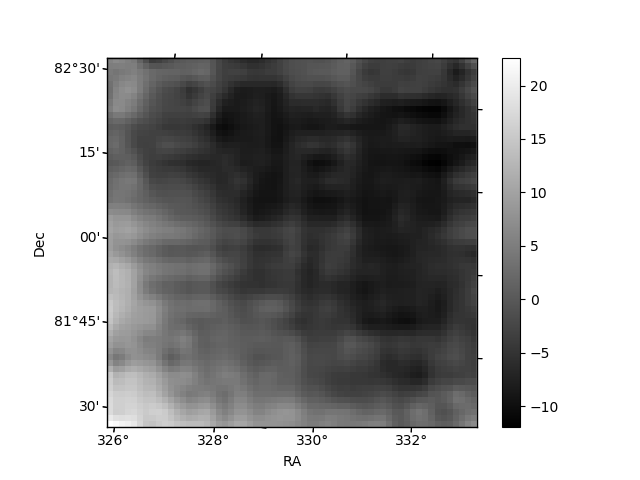
| Quadrant A | 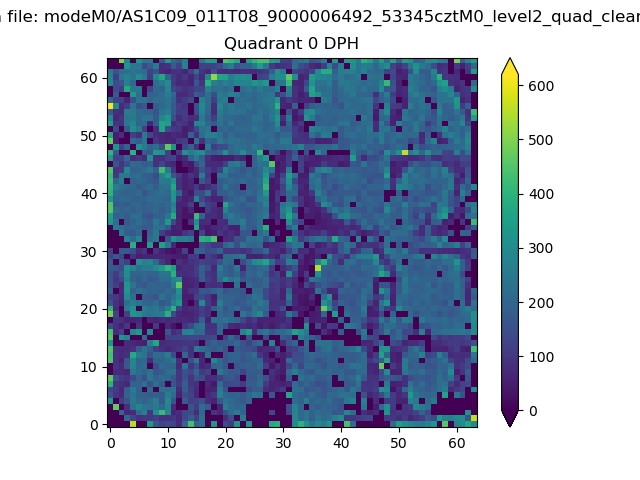 |
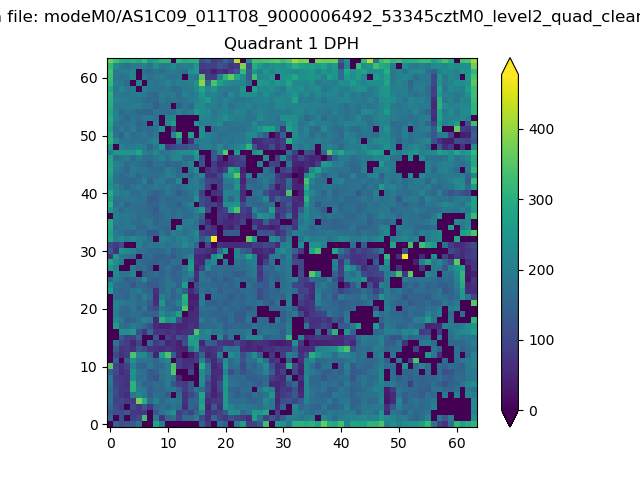 |
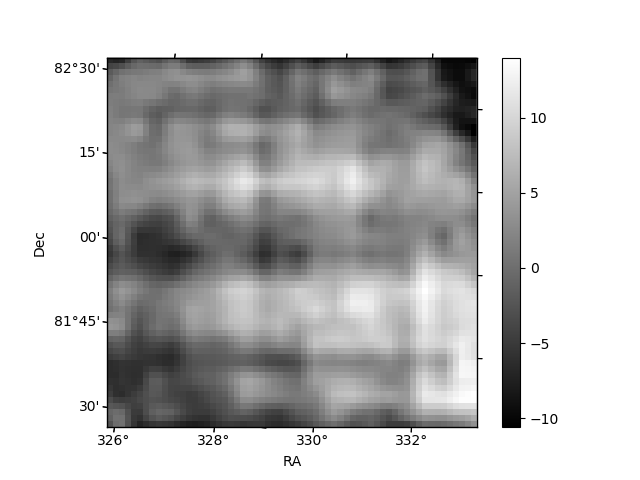
Quadrant B |
|---|---|---|---|
| Quadrant D | 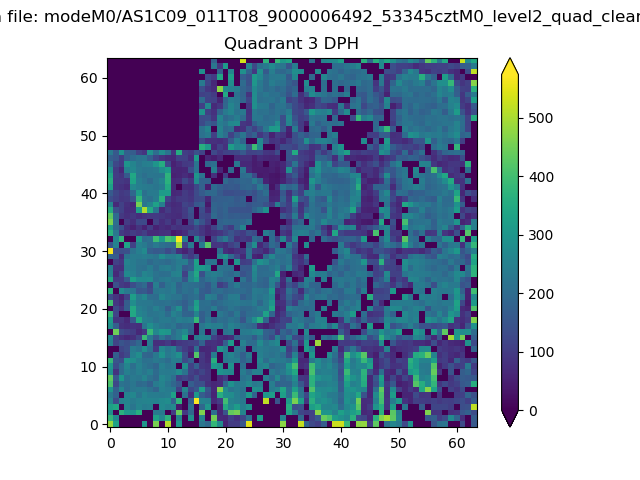 |
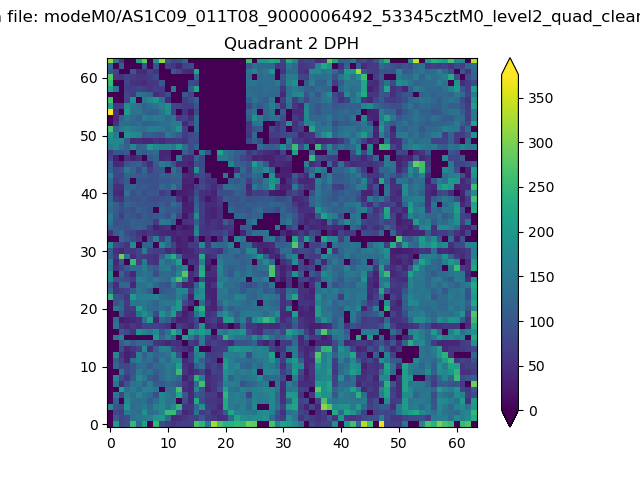 |
Quadrant C |
| Plot type | Count rate plots | Images |
|---|---|---|
| Comparison with Poisson distribution Blue bars denote a histogram of data divided into 1 sec bins. Red curve is a Poisson curve with rate = median count rate of data. |
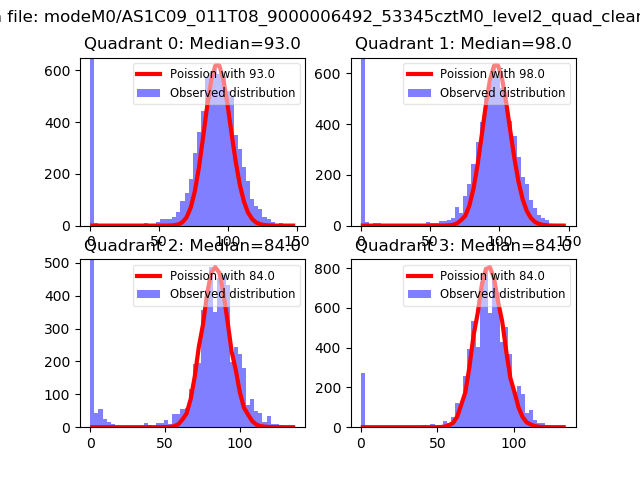 |
 |
| Quadrant-wise count rates Data is divided into 100 sec bins |
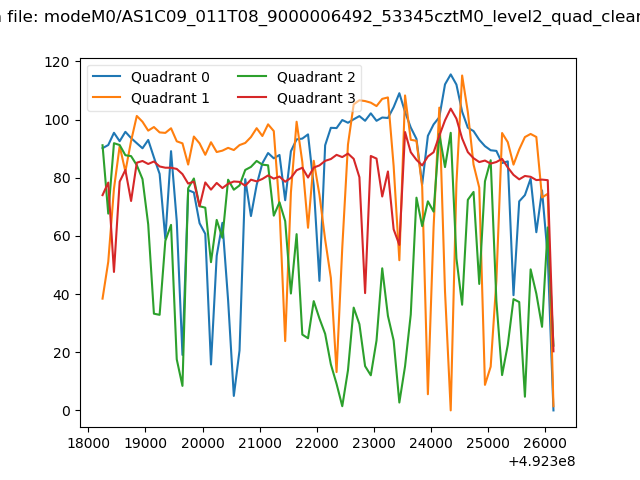 |
|
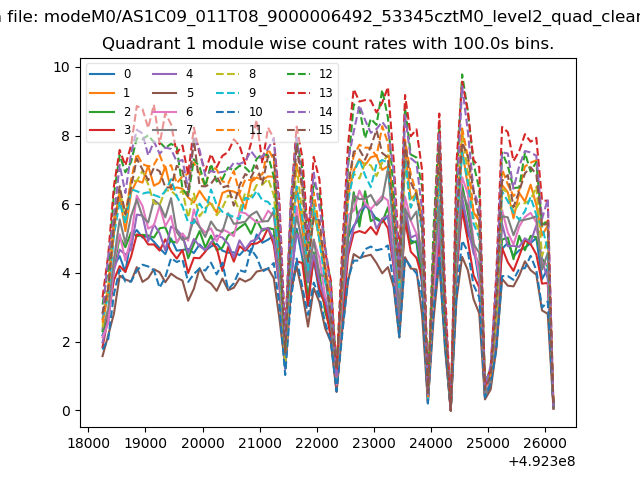
| Module-wise count rates for Quadrant A Data is divided into 100 sec bins |
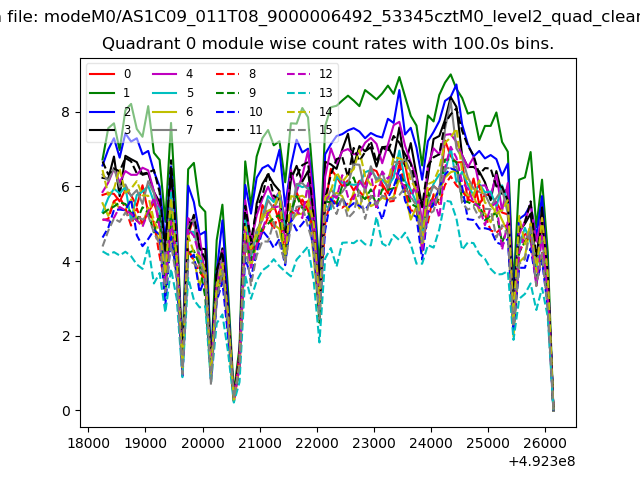 |
 |
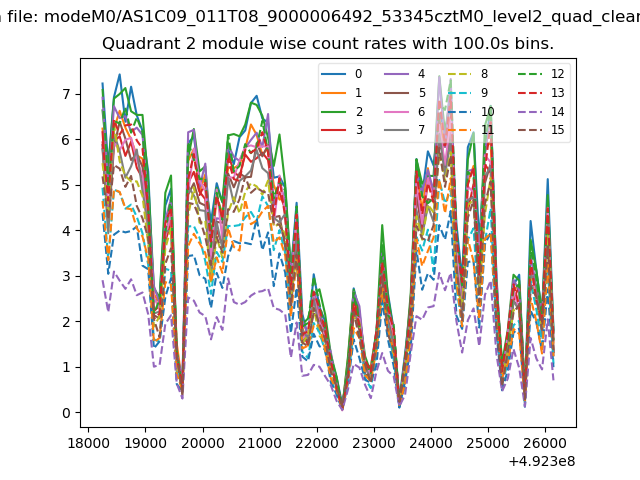
| Module-wise count rates for Quadrant B Data is divided into 100 sec bins |
 |
 |
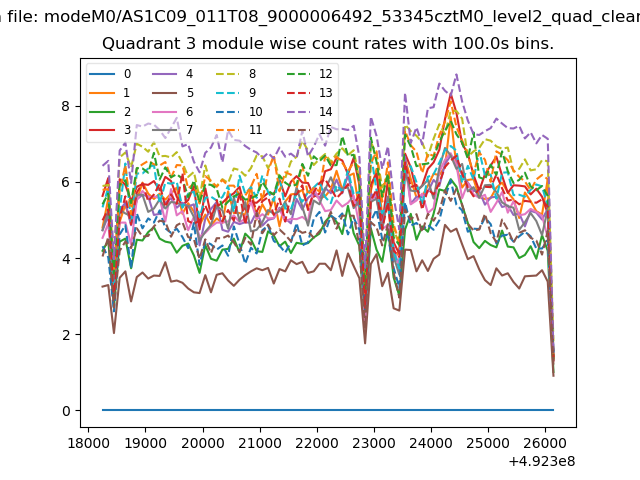
| Module-wise count rates for Quadrant C Data is divided into 100 sec bins |
 |
 |
| Module-wise count rates for Quadrant D Data is divided into 100 sec bins |
 |
 |
| Parameter | Plot |
|---|---|
| CZT HV Monitor | 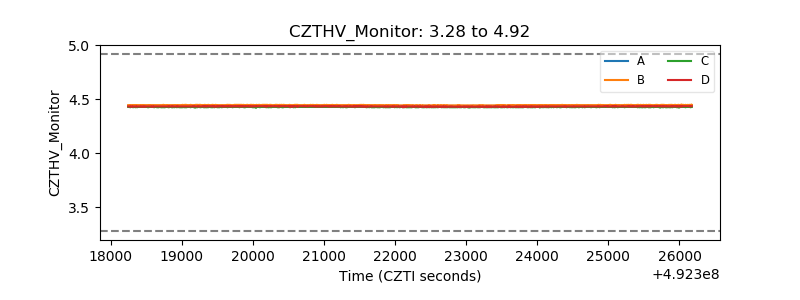 |
| D_VDD | 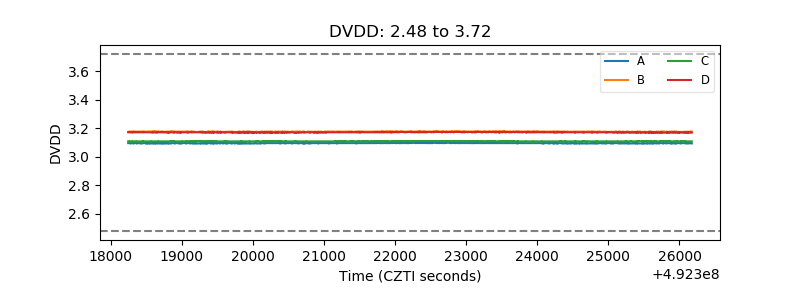 |
| Temperature 1 | 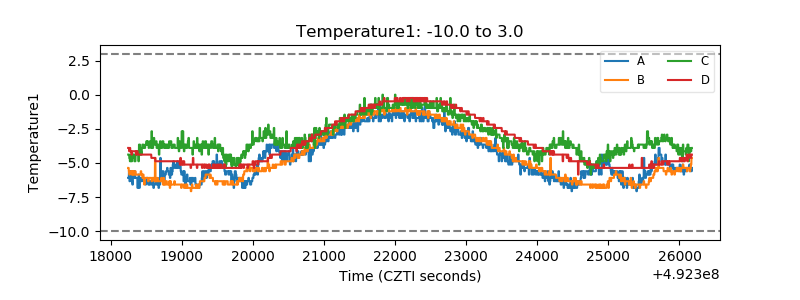 |
| Veto HV Monitor | 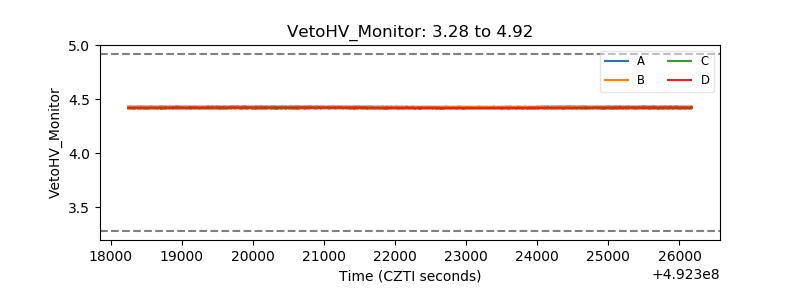 |
| Veto LLD | 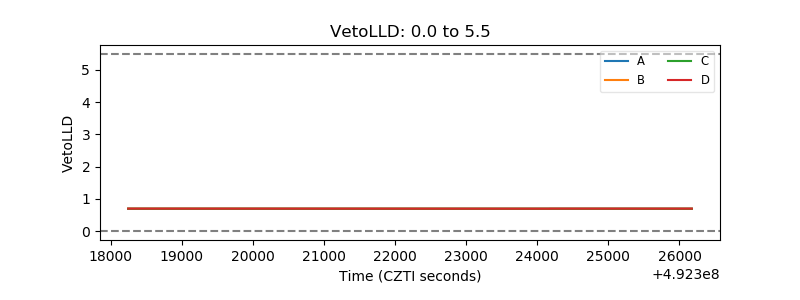 |
| Alpha Counter | 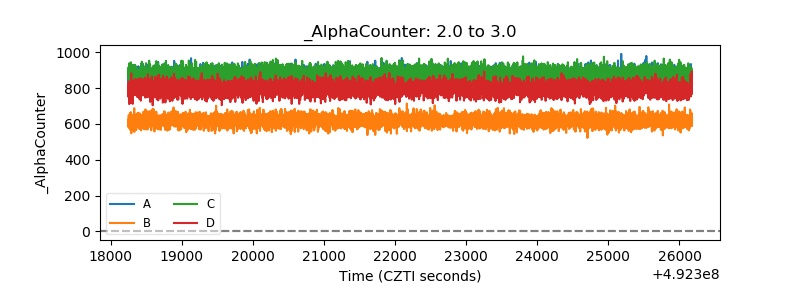 |
| _CPM_Rate | 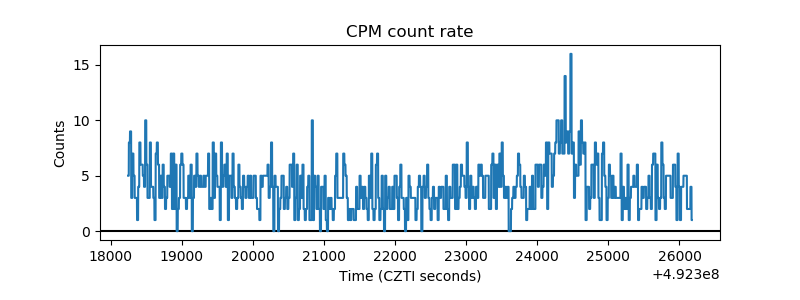 |
| CZT Counter | 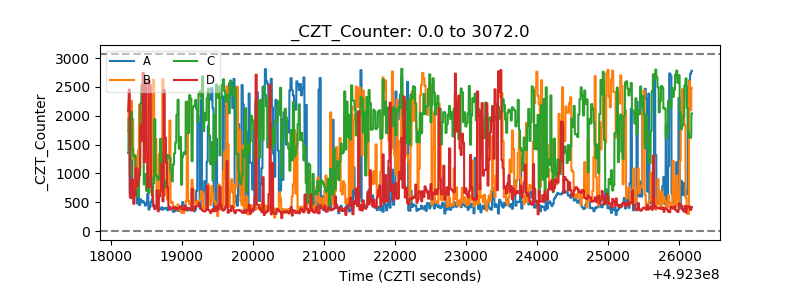 |
| +2.5 Volts monitor | 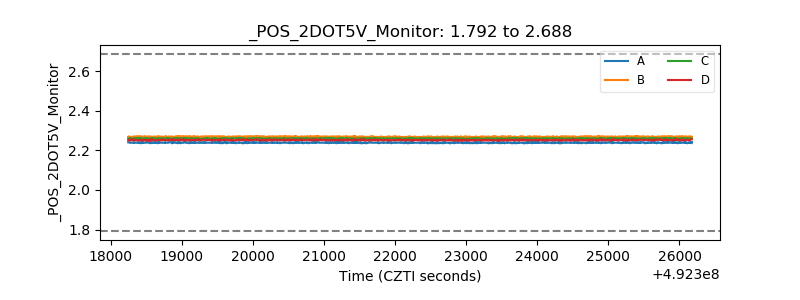 |
| +5 Volts monitor |  |
| _ROLL_ROT | 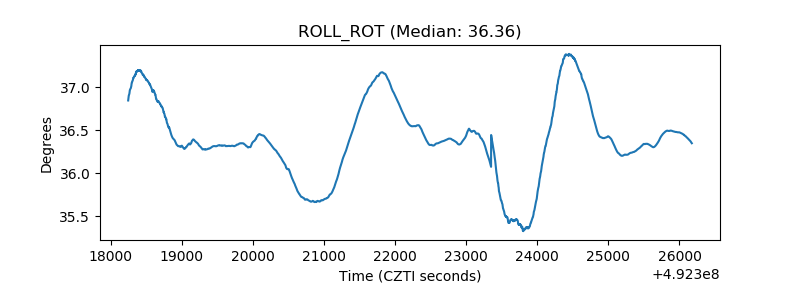 |
| _Roll_DEC | 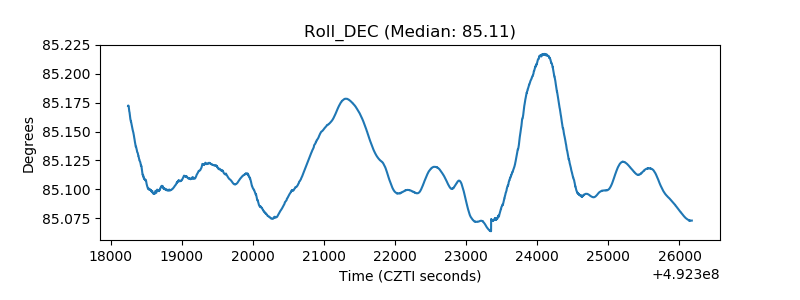 |
| _Roll_RA | 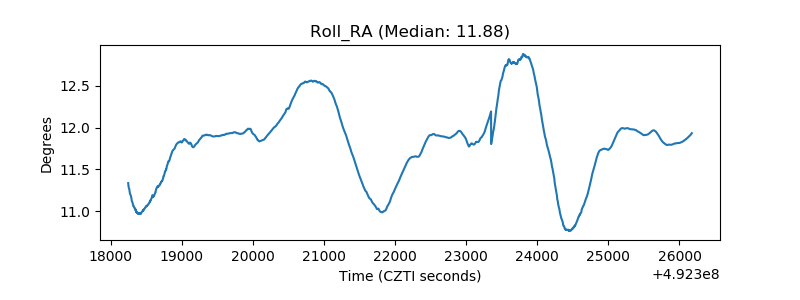 |
| Veto Counter |  |