| Param | Original file | Final file |
|---|---|---|
| Filename | modeM0/AS1C09_011T08_9000006492_53348cztM0_level2.fits | modeM0/AS1C09_011T08_9000006492_53348cztM0_level2_quad_clean.evt |
| Size (bytes) | 2,092,841,280 | 200,681,280 |
| Size | 1.9 GB | 191.4 MB |
| Events in quadrant A | 11,824,017 | 1,441,281 |
| Events in quadrant B | 15,746,759 | 1,364,576 |
| Events in quadrant C | 32,239,015 | 753,820 |
| Events in quadrant D | 16,363,843 | 1,353,796 |
| Mode M0 | |||
|---|---|---|---|
| Quadrant | BADHDUFLAG | Total packets | Discarded packets |
| A | 0 | 47147 | 2 |
| B | 0 | 58458 | 2 |
| C | 0 | 107374 | 2 |
| D | 0 | 60865 | 2 |
| Mode M9 | |||
|---|---|---|---|
| Quadrant | BADHDUFLAG | Total packets | Discarded packets |
| A | 0 | 5 | 0 |
| B | 0 | 5 | 0 |
| C | 0 | 5 | 0 |
| D | 0 | 5 | 0 |
| Mode SS | |||
|---|---|---|---|
| Quadrant | BADHDUFLAG | Total packets | Discarded packets |
| A | 0 | 342 | 0 |
| B | 0 | 342 | 0 |
| C | 0 | 342 | 0 |
| D | 0 | 342 | 0 |
| Quadrant | Total seconds | Saturated seconds | Saturation percentage |
|---|---|---|---|
| A | 16836 | 1493 | 8.867902% |
| B | 16836 | 3095 | 18.383226% |
| C | 16836 | 8984 | 53.361844% |
| D | 16837 | 1007 | 5.980875% |
Noise dominated data is calculated using 1-second bins in cleaned event files. If a bin has >2000 counts, and if more than 50% of those come from <1% of pixels, then it is considered to be noise-dominated and hence unusable.
| Quadrant | # 1 sec bins | Bins with >0 counts | Bins with >2000 counts | High rate bins dominated by noise | Noise dominated (total time) | Noise dominated (detector-on time) | Marked lightcurve |
|---|---|---|---|---|---|---|---|
| A | 17396 | 16837 | 1213 | 1213 | 6.97% | 7.20% | 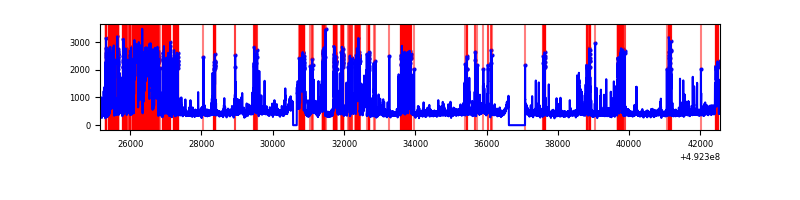 |
| B | 17396 | 16836 | 2142 | 2142 | 12.31% | 12.72% | 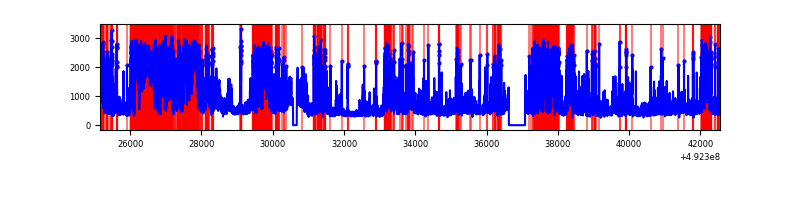 |
| C | 17395 | 16835 | 8427 | 8427 | 48.44% | 50.06% | 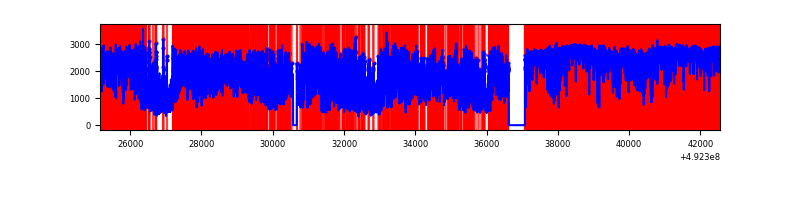 |
| D | 17397 | 16837 | 989 | 989 | 5.68% | 5.87% | 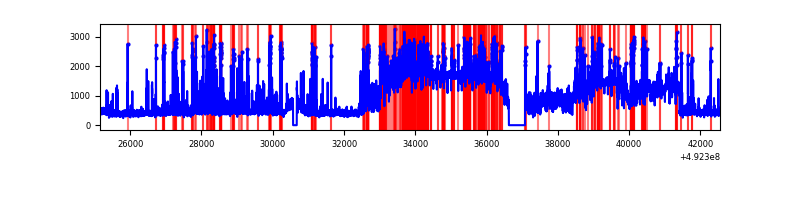 |
Top three noisy pixels from each quadrant. If the there are fewer than three noisy pixels in the level2.evt file, extra rows are filled as -1
| Pixel properties | Quadrant properties | ||||||
|---|---|---|---|---|---|---|---|
| Quadrant | DetID | PixID | Counts | Sigma | Mean | Median | Sigma |
| A | 15 | 174 | 4471514 | 10528.25 | 1698 | 1657 | 424.6 |
| A | 11 | 3 | 160258 | 373.57 | 1698 | 1657 | 424.6 |
| A | 0 | 8 | 152675 | 355.71 | 1698 | 1657 | 424.6 |
| B | 2 | 249 | 6333613 | 18644.26 | 1591 | 1532 | 339.6 |
| B | 4 | 206 | 622088 | 1827.17 | 1591 | 1532 | 339.6 |
| B | 10 | 28 | 428466 | 1257.07 | 1591 | 1532 | 339.6 |
| C | 15 | 158 | 8104825 | 23461.71 | 1267 | 1255 | 345.4 |
| C | 1 | 241 | 7089720 | 20522.75 | 1267 | 1255 | 345.4 |
| C | 15 | 178 | 4778004 | 13829.79 | 1267 | 1255 | 345.4 |
| D | 2 | 172 | 6805049 | 14298.31 | 1679 | 1603 | 475.8 |
| D | 2 | 249 | 1276594 | 2679.56 | 1679 | 1603 | 475.8 |
| D | 2 | 62 | 565337 | 1184.76 | 1679 | 1603 | 475.8 |
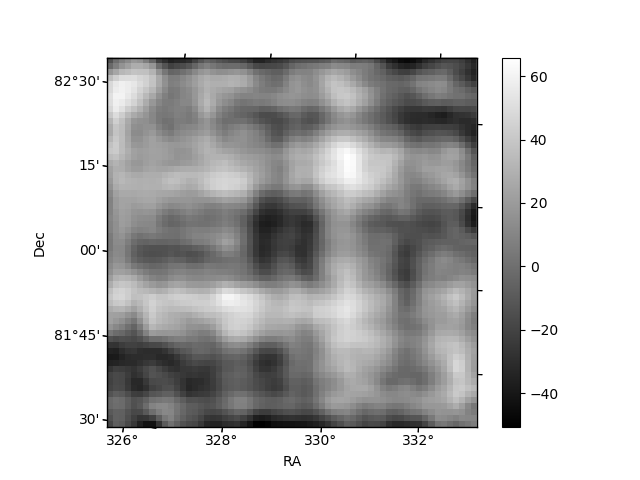
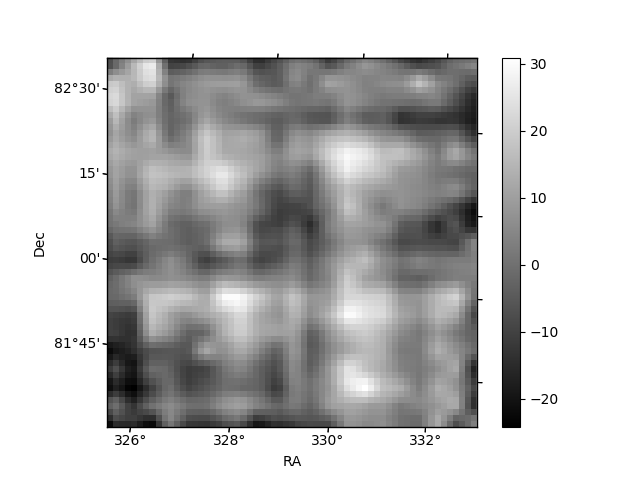
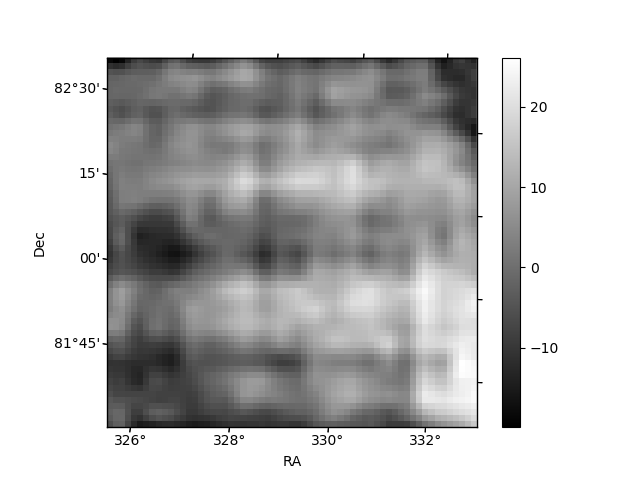
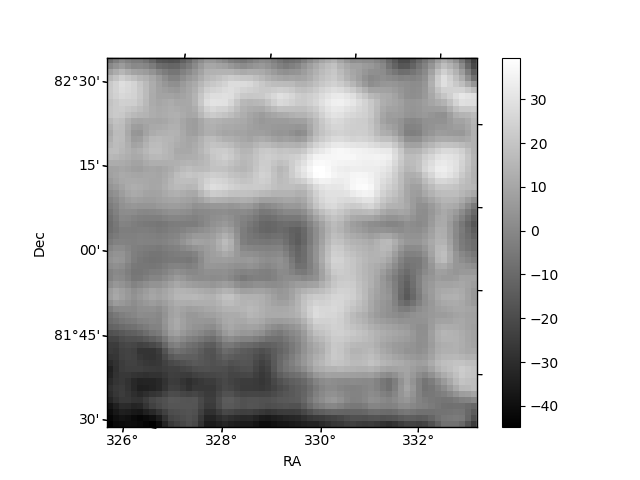
Histogram calculated using DETX and DETY for each event in the final _common_clean file
| Quadrant A | 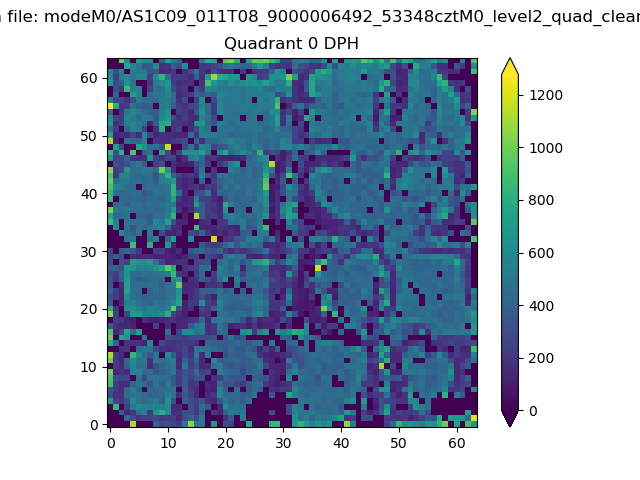 |
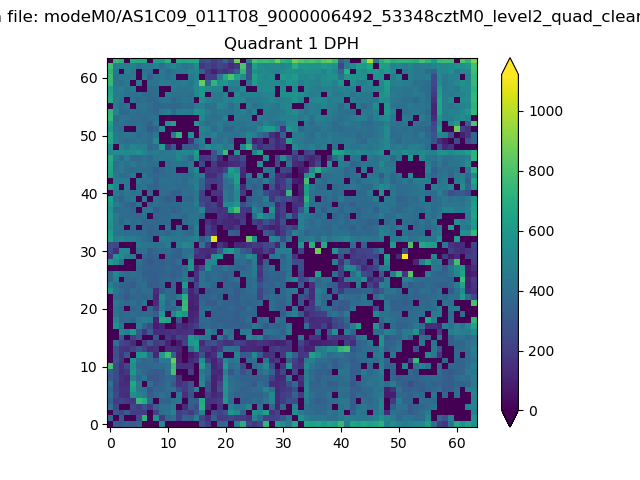 |
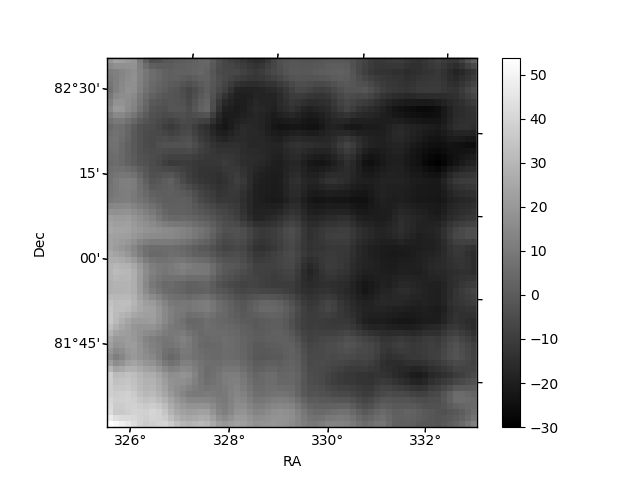
Quadrant B |
|---|---|---|---|
| Quadrant D | 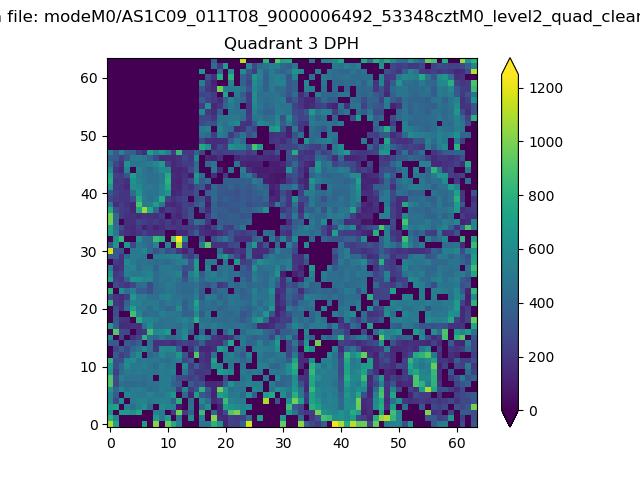 |
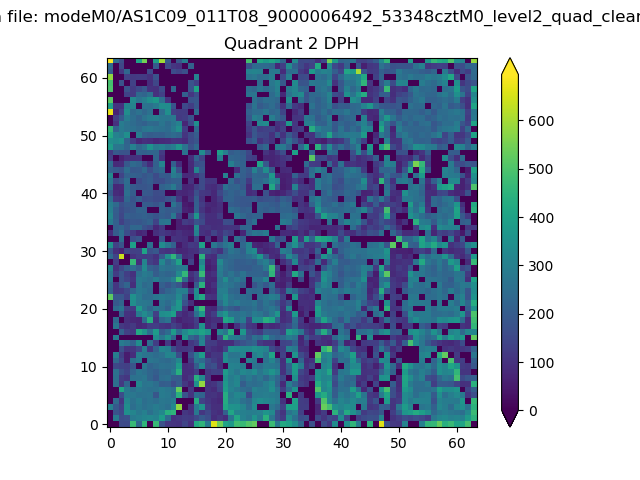 |
Quadrant C |
| Plot type | Count rate plots | Images |
|---|---|---|
| Comparison with Poisson distribution Blue bars denote a histogram of data divided into 1 sec bins. Red curve is a Poisson curve with rate = median count rate of data. |
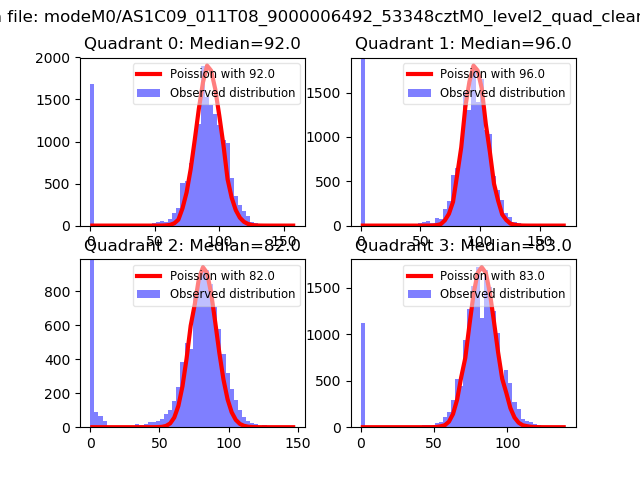 |
 |
| Quadrant-wise count rates Data is divided into 100 sec bins |
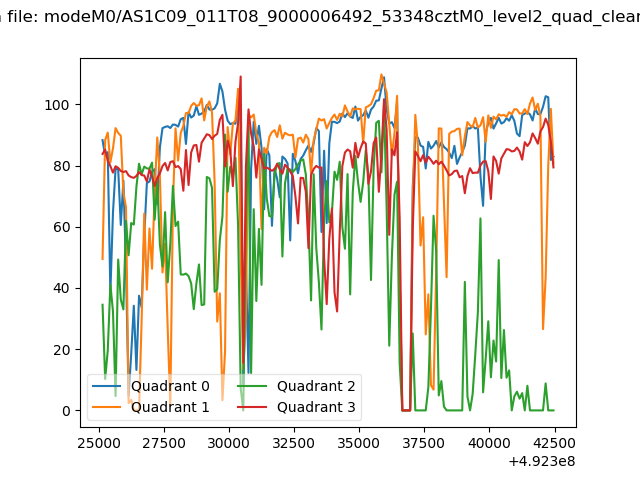 |
|
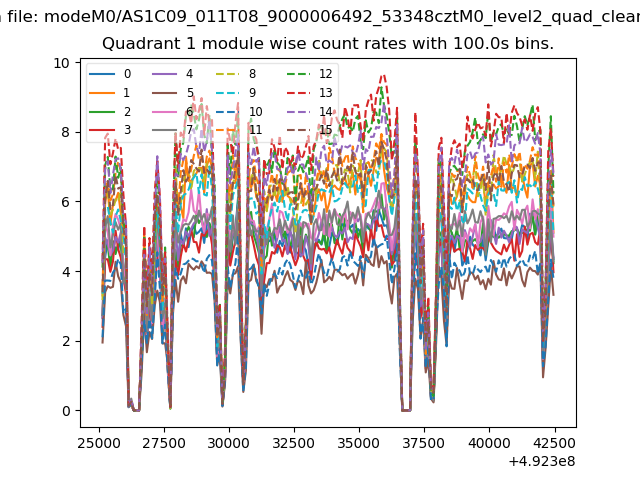
| Module-wise count rates for Quadrant A Data is divided into 100 sec bins |
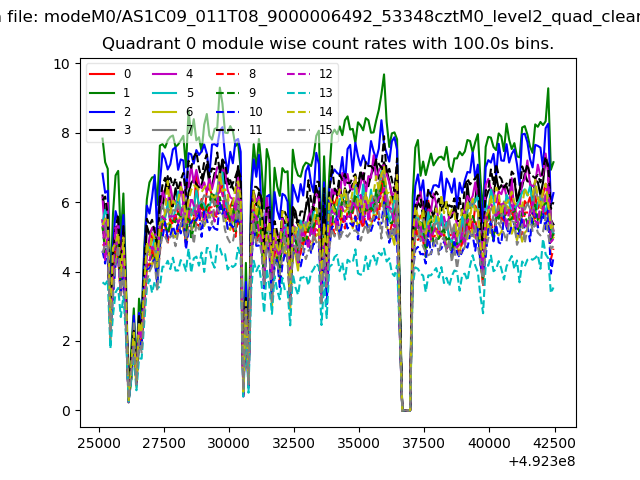 |
 |
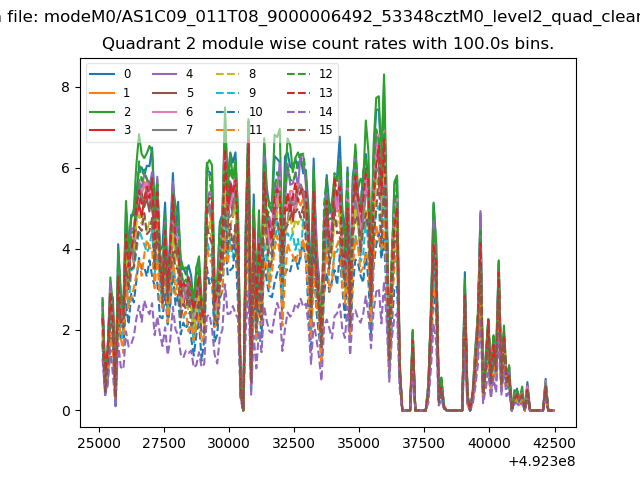
| Module-wise count rates for Quadrant B Data is divided into 100 sec bins |
 |
 |
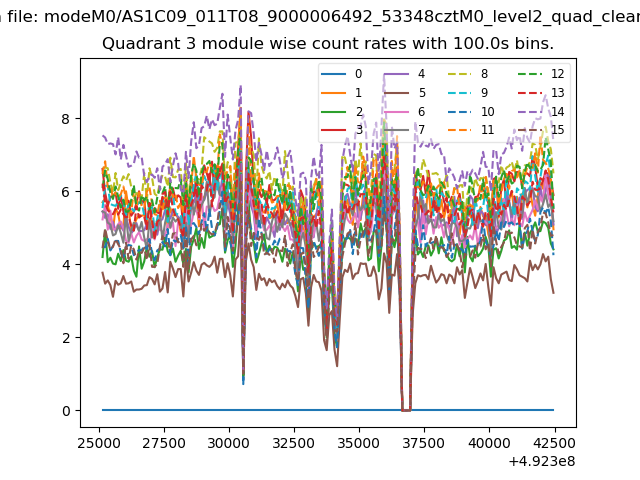
| Module-wise count rates for Quadrant C Data is divided into 100 sec bins |
 |
 |
| Module-wise count rates for Quadrant D Data is divided into 100 sec bins |
 |
 |
| Parameter | Plot |
|---|---|
| CZT HV Monitor | 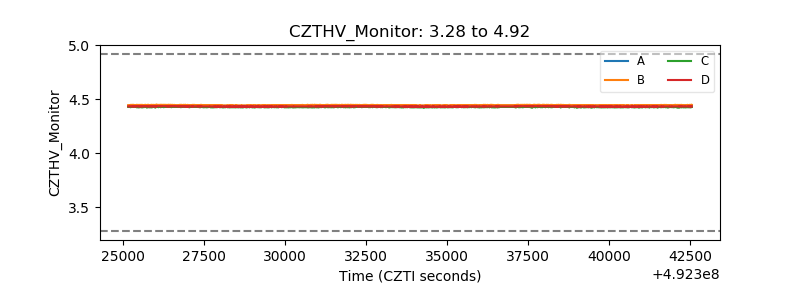 |
| D_VDD | 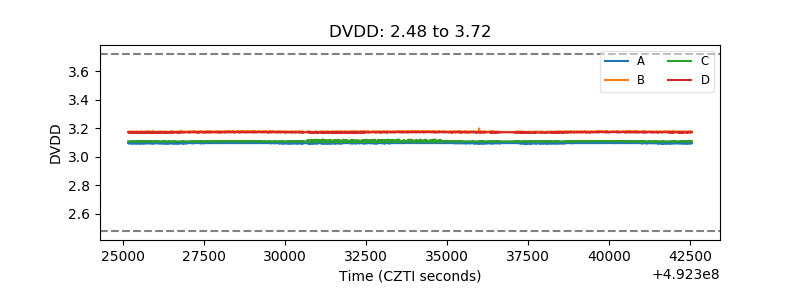 |
| Temperature 1 | 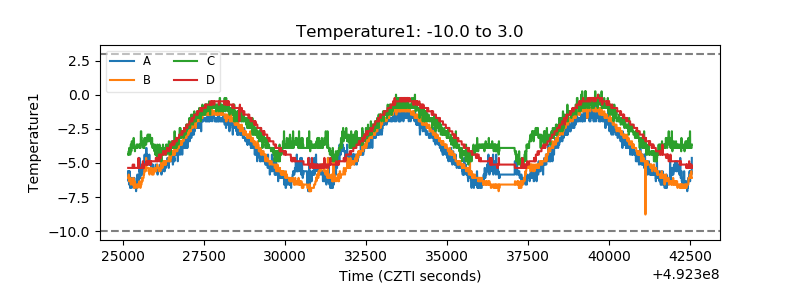 |
| Veto HV Monitor | 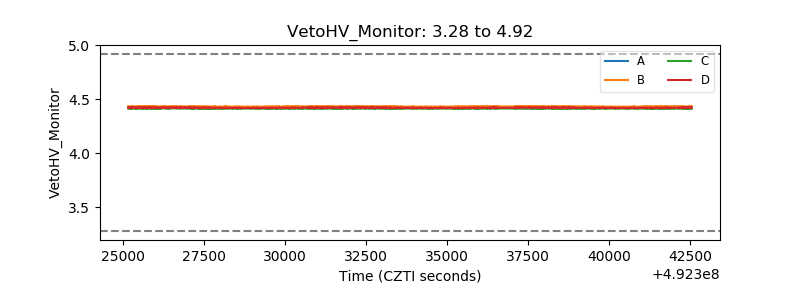 |
| Veto LLD | 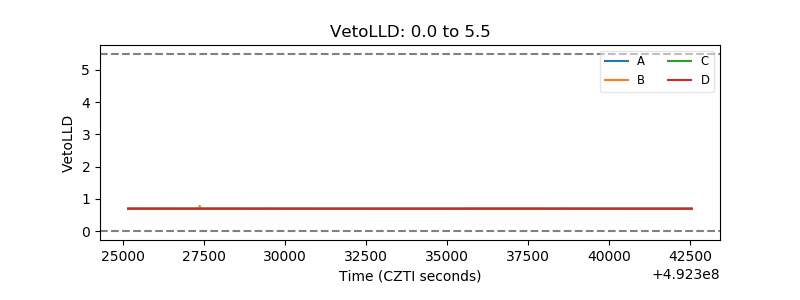 |
| Alpha Counter | 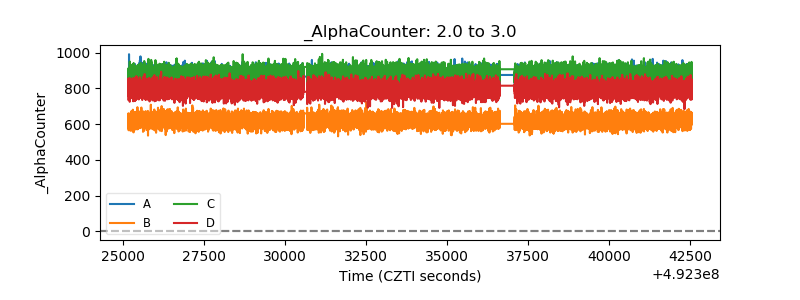 |
| _CPM_Rate | 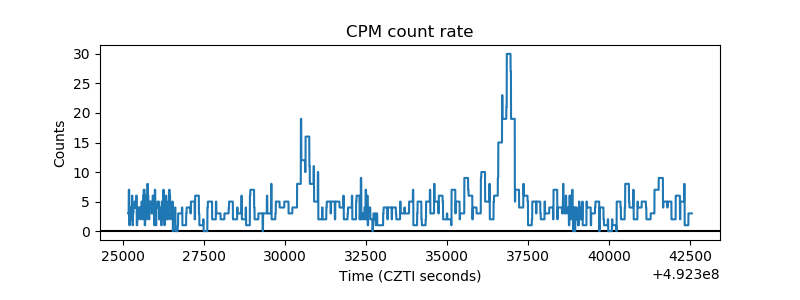 |
| CZT Counter | 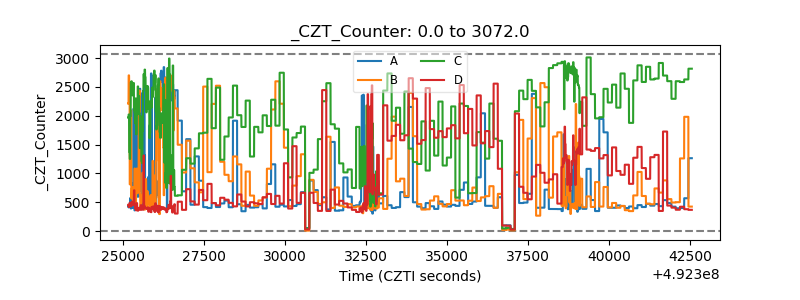 |
| +2.5 Volts monitor | 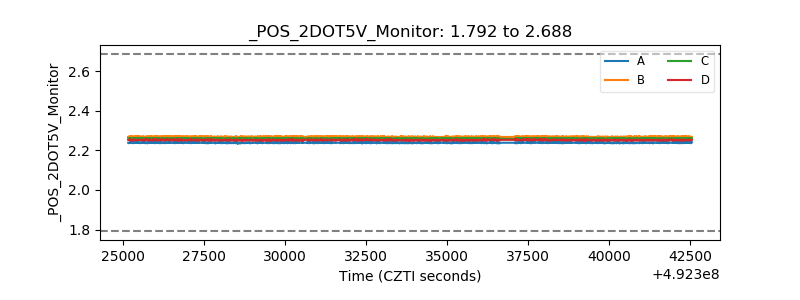 |
| +5 Volts monitor | 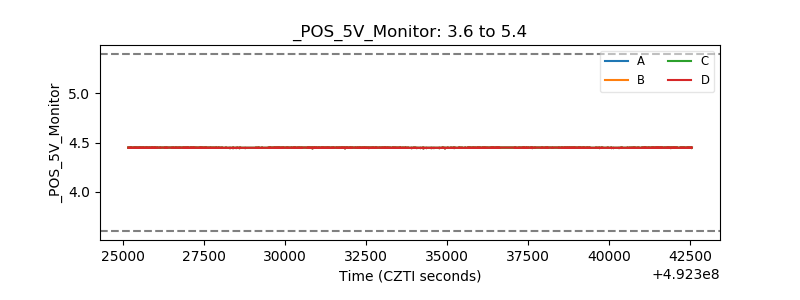 |
| _ROLL_ROT | 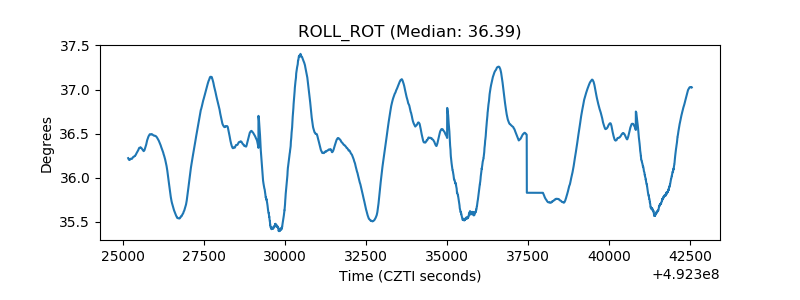 |
| _Roll_DEC | 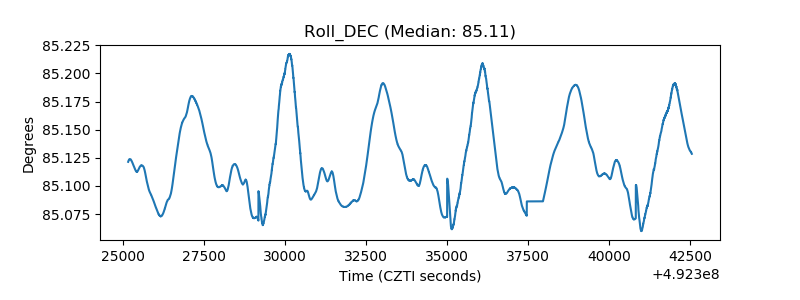 |
| _Roll_RA | 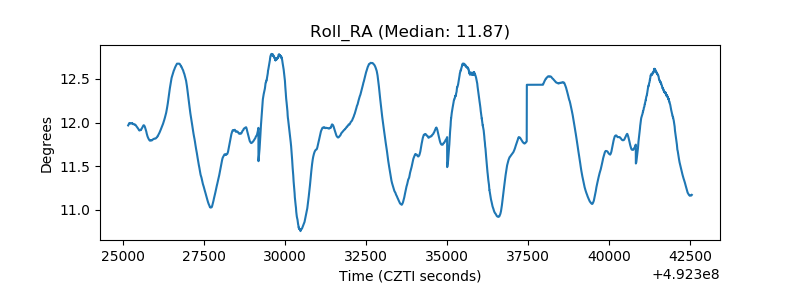 |
| Veto Counter | 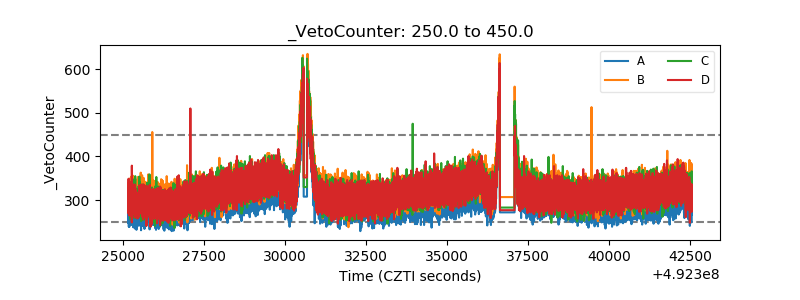 |