| Param | Original file | Final file |
|---|---|---|
| Filename | modeM0/AS1C09_011T08_9000006492_53349cztM0_level2.fits | modeM0/AS1C09_011T08_9000006492_53349cztM0_level2_quad_clean.evt |
| Size (bytes) | 982,154,880 | 94,824,000 |
| Size | 936.7 MB | 90.4 MB |
| Events in quadrant A | 5,039,089 | 758,387 |
| Events in quadrant B | 5,611,245 | 774,256 |
| Events in quadrant C | 20,185,470 | 89,097 |
| Events in quadrant D | 4,890,411 | 684,314 |
| Mode M0 | |||
|---|---|---|---|
| Quadrant | BADHDUFLAG | Total packets | Discarded packets |
| A | 0 | 20513 | 2 |
| B | 0 | 22158 | 2 |
| C | 0 | 65475 | 8 |
| D | 0 | 20311 | 2 |
| Mode M9 | |||
|---|---|---|---|
| Quadrant | BADHDUFLAG | Total packets | Discarded packets |
| A | 0 | 13 | 0 |
| B | 0 | 13 | 0 |
| C | 0 | 13 | 0 |
| D | 0 | 13 | 0 |
| Mode SS | |||
|---|---|---|---|
| Quadrant | BADHDUFLAG | Total packets | Discarded packets |
| A | 0 | 168 | 0 |
| B | 0 | 168 | 0 |
| C | 0 | 168 | 0 |
| D | 0 | 168 | 0 |
| Quadrant | Total seconds | Saturated seconds | Saturation percentage |
|---|---|---|---|
| A | 8120 | 419 | 5.160099% |
| B | 8121 | 650 | 8.003940% |
| C | 8120 | 7358 | 90.615764% |
| D | 8120 | 365 | 4.495074% |
Noise dominated data is calculated using 1-second bins in cleaned event files. If a bin has >2000 counts, and if more than 50% of those come from <1% of pixels, then it is considered to be noise-dominated and hence unusable.
| Quadrant | # 1 sec bins | Bins with >0 counts | Bins with >2000 counts | High rate bins dominated by noise | Noise dominated (total time) | Noise dominated (detector-on time) | Marked lightcurve |
|---|---|---|---|---|---|---|---|
| A | 9520 | 8120 | 241 | 241 | 2.53% | 2.97% | 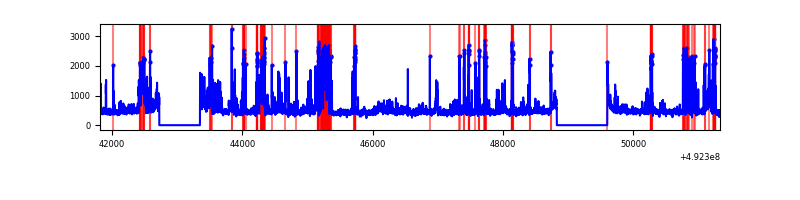 |
| B | 9521 | 8121 | 361 | 361 | 3.79% | 4.45% | 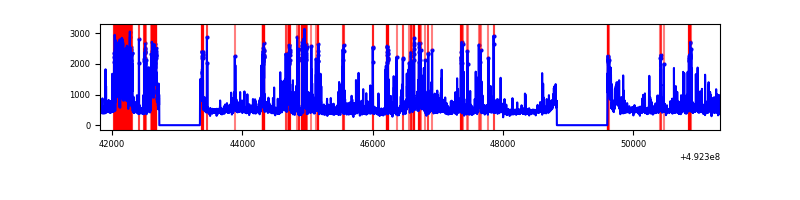 |
| C | 9519 | 8119 | 7230 | 7230 | 75.95% | 89.05% | 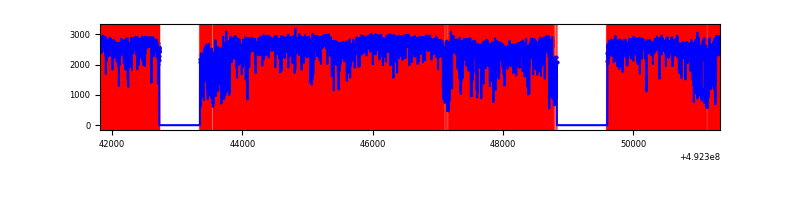 |
| D | 9519 | 8119 | 223 | 223 | 2.34% | 2.75% | 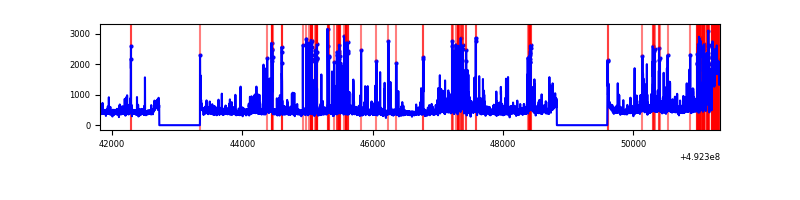 |
Top three noisy pixels from each quadrant. If the there are fewer than three noisy pixels in the level2.evt file, extra rows are filled as -1
| Pixel properties | Quadrant properties | ||||||
|---|---|---|---|---|---|---|---|
| Quadrant | DetID | PixID | Counts | Sigma | Mean | Median | Sigma |
| A | 15 | 174 | 1120457 | 5157.16 | 868 | 844 | 217.1 |
| A | 11 | 3 | 119726 | 547.59 | 868 | 844 | 217.1 |
| A | 0 | 8 | 79851 | 363.92 | 868 | 844 | 217.1 |
| B | 2 | 249 | 842697 | 4750.41 | 839 | 811 | 177.2 |
| B | 0 | 171 | 307846 | 1732.47 | 839 | 811 | 177.2 |
| B | 4 | 206 | 200319 | 1125.74 | 839 | 811 | 177.2 |
| C | 1 | 241 | 10787886 | 109567.17 | 353 | 351 | 98.5 |
| C | 15 | 178 | 5505754 | 55917.45 | 353 | 351 | 98.5 |
| C | 15 | 158 | 1003483 | 10188.64 | 353 | 351 | 98.5 |
| D | 2 | 62 | 401997 | 1685.7 | 835 | 797 | 238.0 |
| D | 2 | 249 | 293380 | 1229.33 | 835 | 797 | 238.0 |
| D | 3 | 12 | 145879 | 609.58 | 835 | 797 | 238.0 |
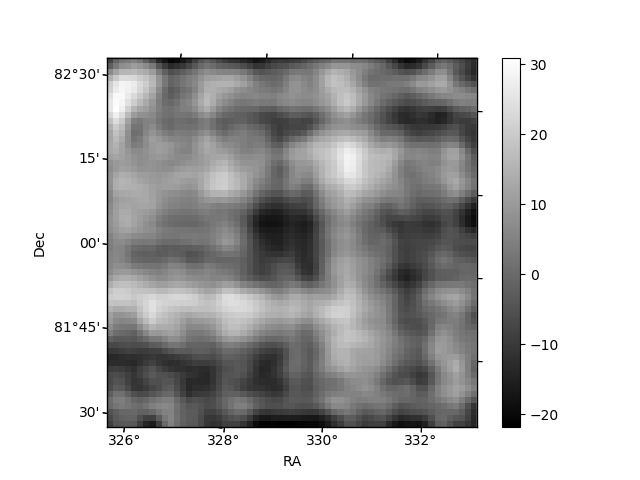
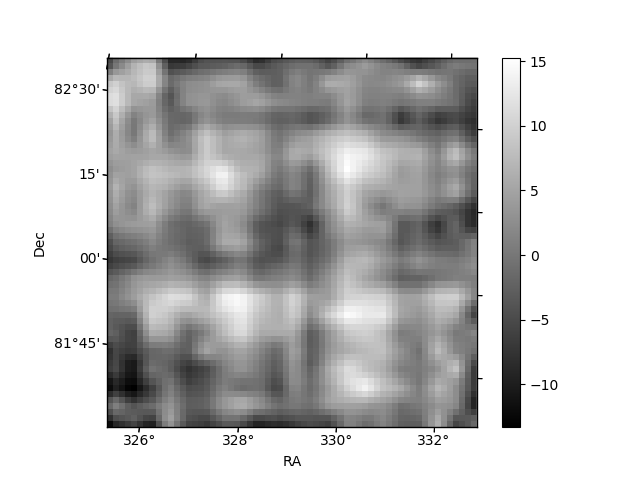
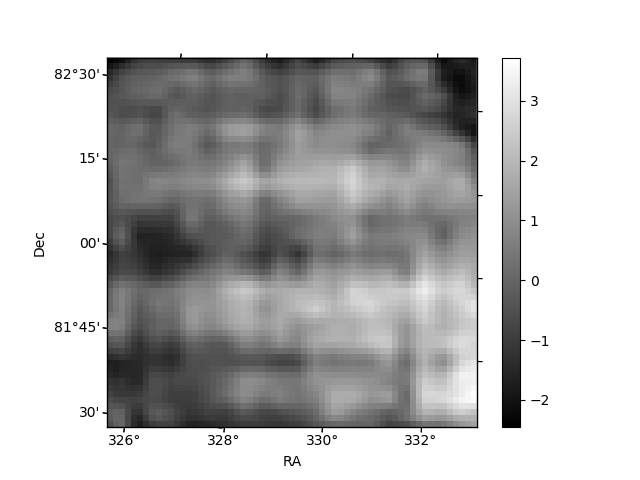
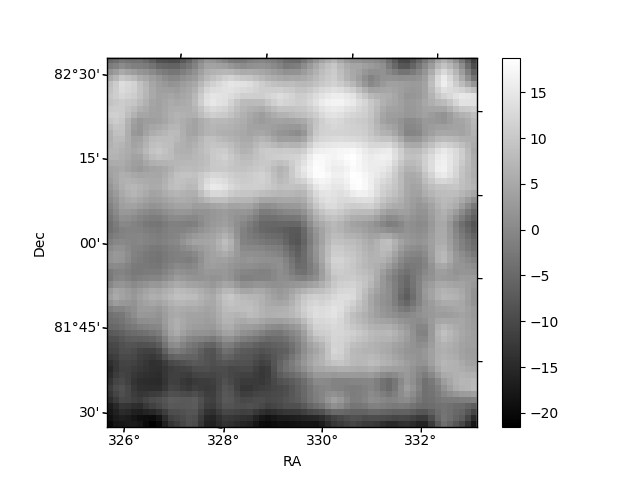
Histogram calculated using DETX and DETY for each event in the final _common_clean file
| Quadrant A | 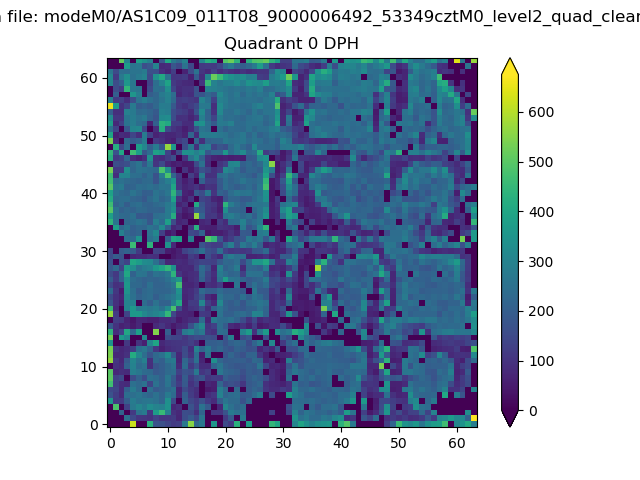 |
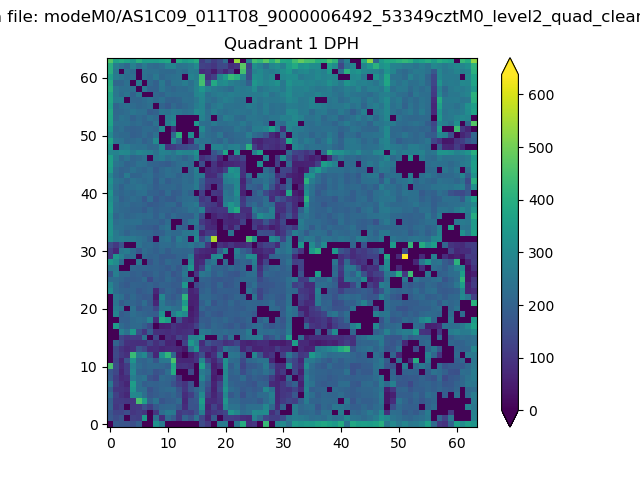 |
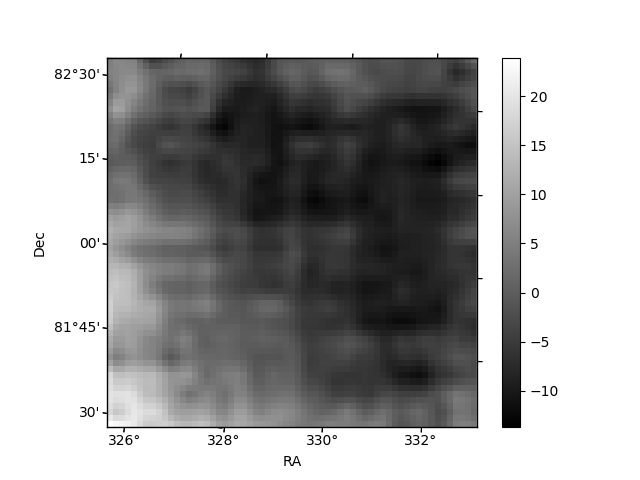
Quadrant B |
|---|---|---|---|
| Quadrant D | 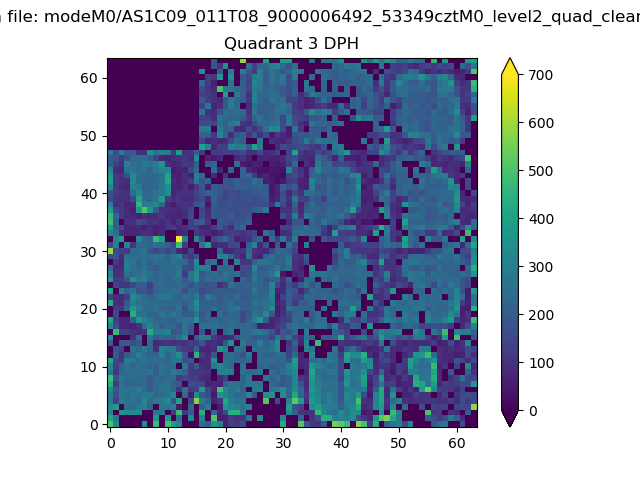 |
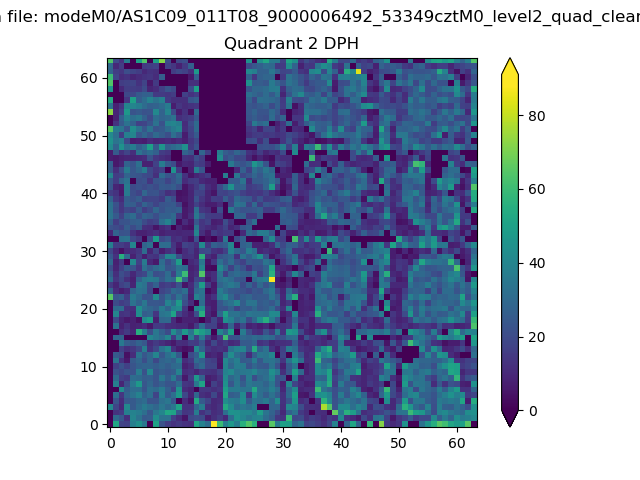 |
Quadrant C |
| Plot type | Count rate plots | Images |
|---|---|---|
| Comparison with Poisson distribution Blue bars denote a histogram of data divided into 1 sec bins. Red curve is a Poisson curve with rate = median count rate of data. |
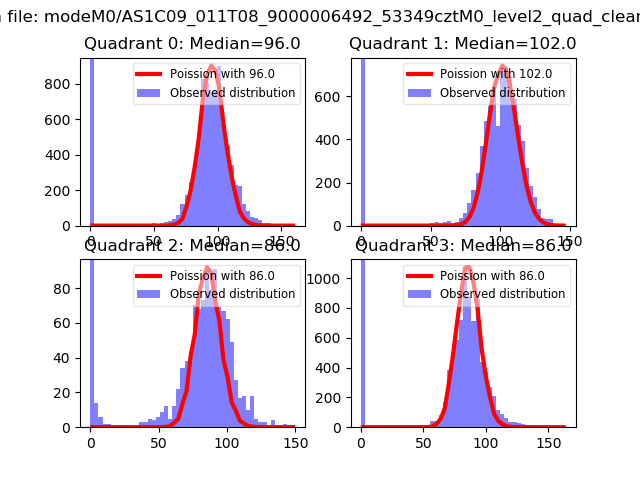 |
 |
| Quadrant-wise count rates Data is divided into 100 sec bins |
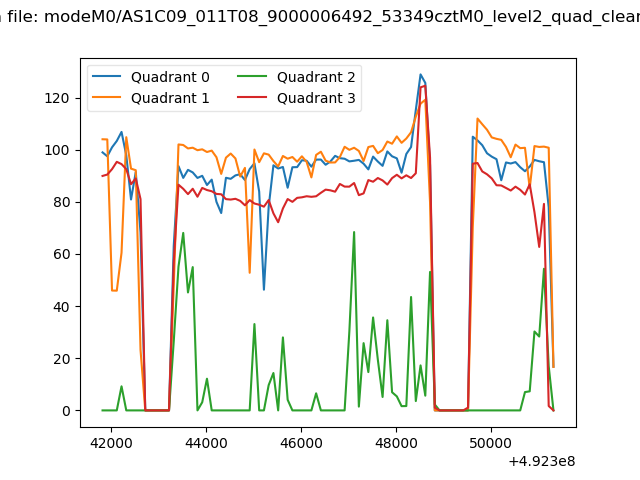 |
|
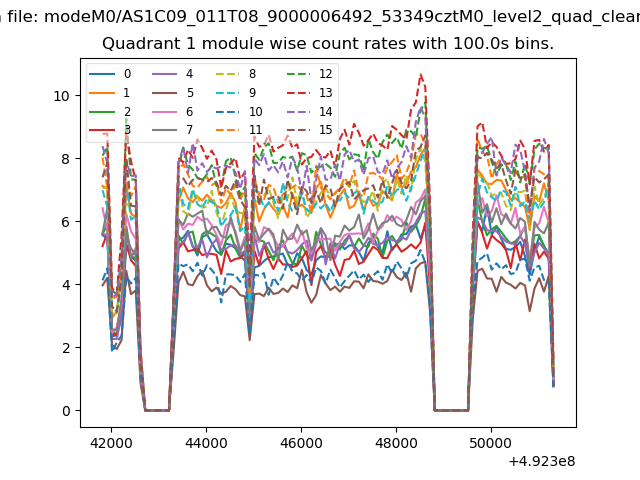
| Module-wise count rates for Quadrant A Data is divided into 100 sec bins |
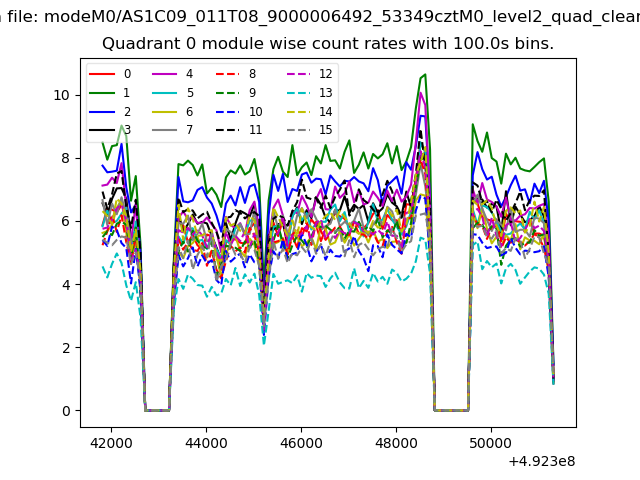 |
 |
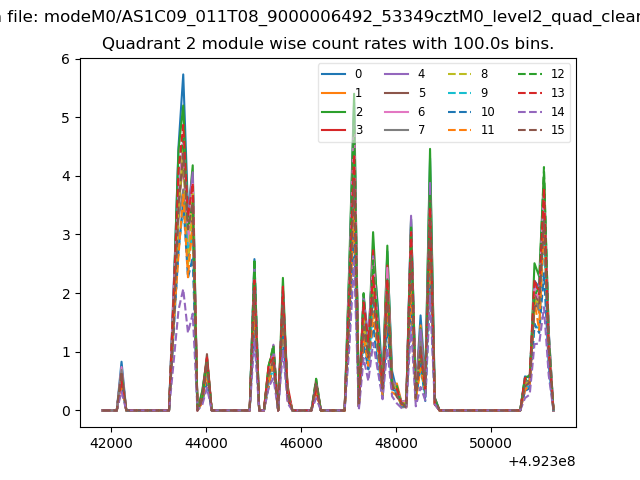
| Module-wise count rates for Quadrant B Data is divided into 100 sec bins |
 |
 |
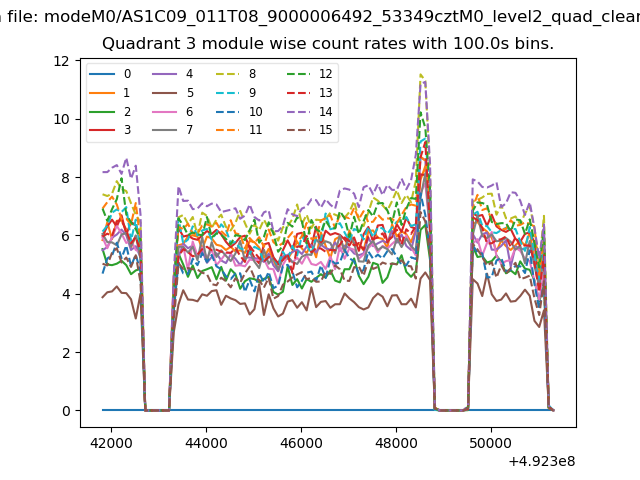
| Module-wise count rates for Quadrant C Data is divided into 100 sec bins |
 |
 |
| Module-wise count rates for Quadrant D Data is divided into 100 sec bins |
 |
 |
| Parameter | Plot |
|---|---|
| CZT HV Monitor | 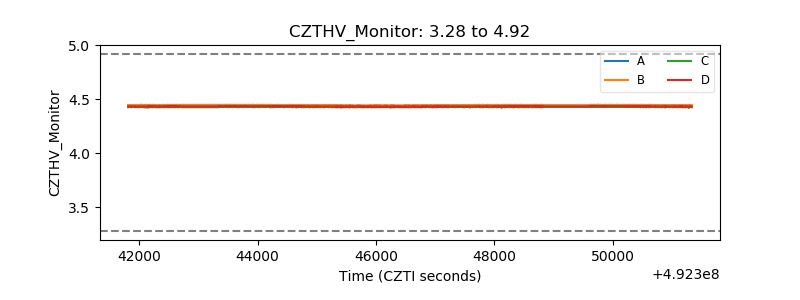 |
| D_VDD | 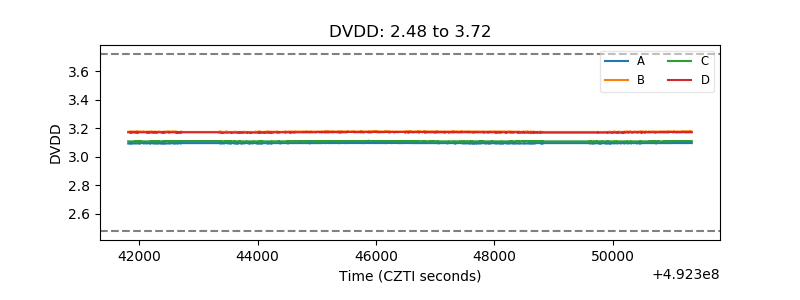 |
| Temperature 1 | 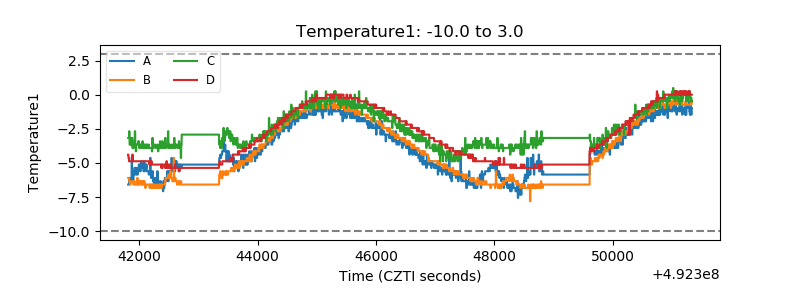 |
| Veto HV Monitor | 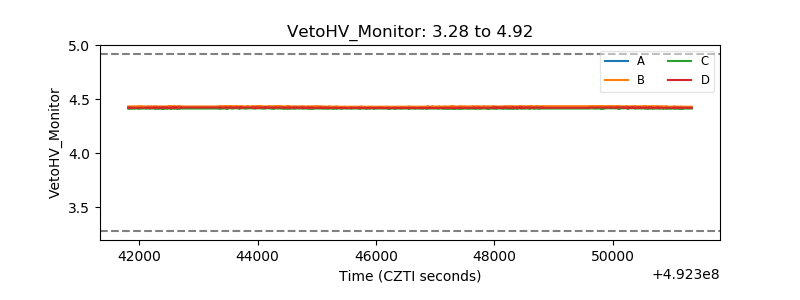 |
| Veto LLD | 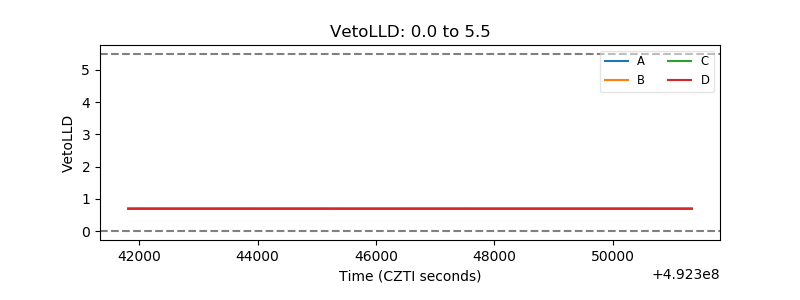 |
| Alpha Counter | 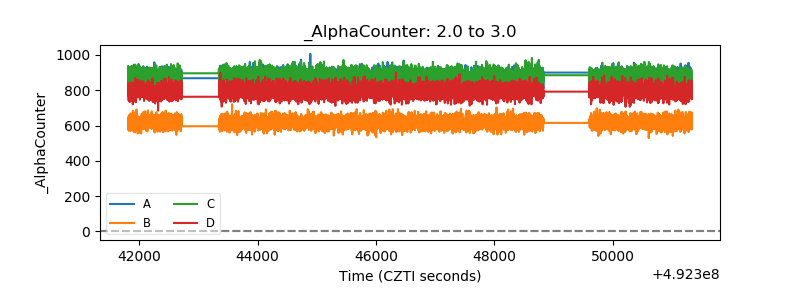 |
| _CPM_Rate | 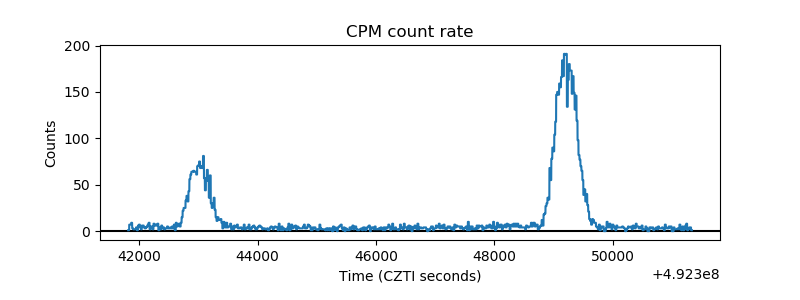 |
| CZT Counter | 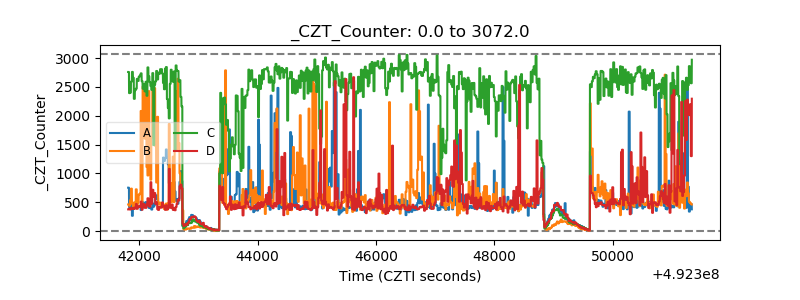 |
| +2.5 Volts monitor |  |
| +5 Volts monitor | 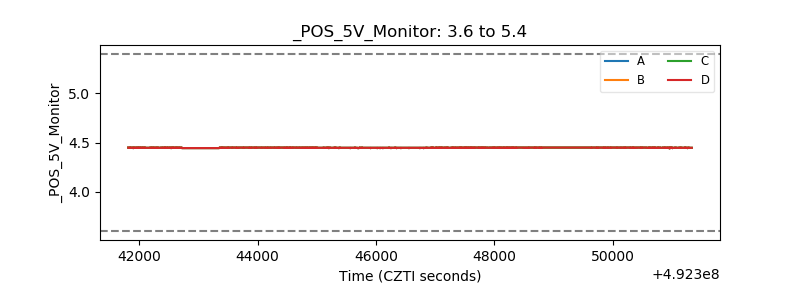 |
| _ROLL_ROT | 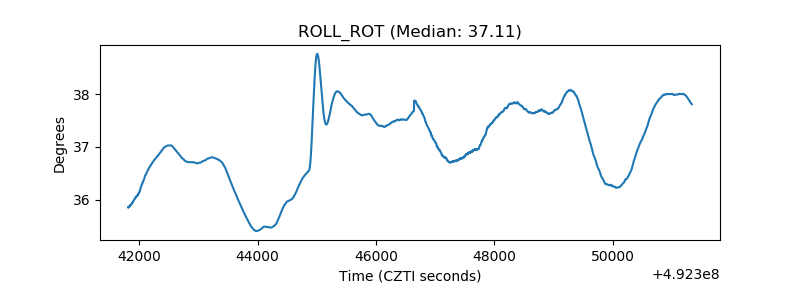 |
| _Roll_DEC | 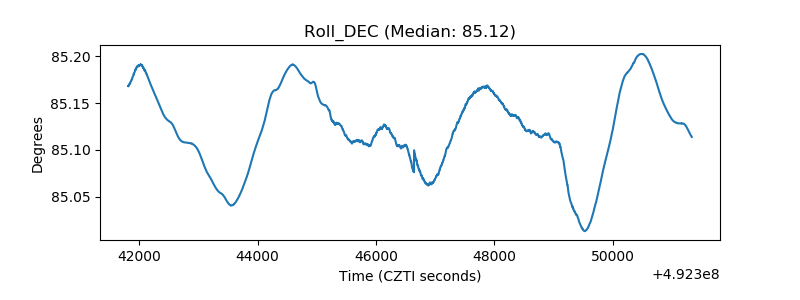 |
| _Roll_RA | 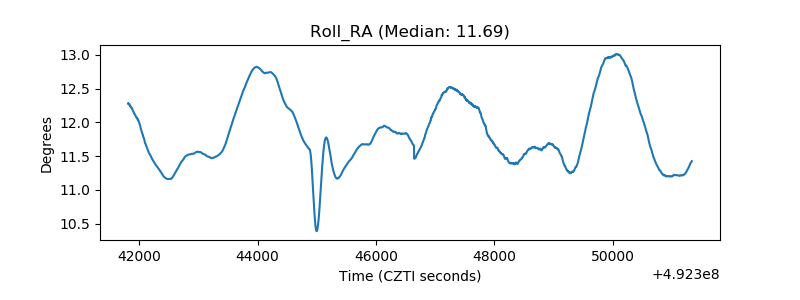 |
| Veto Counter | 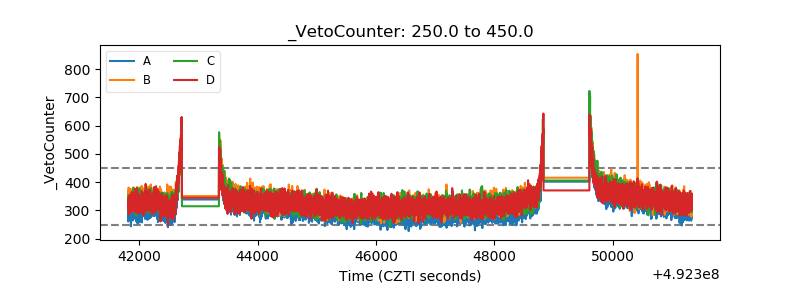 |