| Param | Original file | Final file |
|---|---|---|
| Filename | modeM0/AS1C09_011T08_9000006492_53351cztM0_level2.fits | modeM0/AS1C09_011T08_9000006492_53351cztM0_level2_quad_clean.evt |
| Size (bytes) | 891,918,720 | 59,921,280 |
| Size | 850.6 MB | 57.1 MB |
| Events in quadrant A | 3,278,043 | 585,113 |
| Events in quadrant B | 3,770,299 | 609,744 |
| Events in quadrant C | 14,098,102 | 130,430 |
| Events in quadrant D | 11,404,629 | 70,226 |
| Mode M0 | |||
|---|---|---|---|
| Quadrant | BADHDUFLAG | Total packets | Discarded packets |
| A | 0 | 14003 | 1 |
| B | 0 | 15366 | 1 |
| C | 0 | 45855 | 1 |
| D | 0 | 37963 | 1 |
| Mode M9 | |||
|---|---|---|---|
| Quadrant | BADHDUFLAG | Total packets | Discarded packets |
| A | 0 | 9 | 0 |
| B | 0 | 9 | 0 |
| C | 0 | 9 | 0 |
| D | 0 | 9 | 0 |
| Mode SS | |||
|---|---|---|---|
| Quadrant | BADHDUFLAG | Total packets | Discarded packets |
| A | 0 | 122 | 0 |
| B | 0 | 122 | 0 |
| C | 0 | 122 | 0 |
| D | 0 | 122 | 0 |
| Quadrant | Total seconds | Saturated seconds | Saturation percentage |
|---|---|---|---|
| A | 5990 | 152 | 2.537563% |
| B | 5991 | 242 | 4.039392% |
| C | 5991 | 4746 | 79.218828% |
| D | 5991 | 5254 | 87.698214% |
Noise dominated data is calculated using 1-second bins in cleaned event files. If a bin has >2000 counts, and if more than 50% of those come from <1% of pixels, then it is considered to be noise-dominated and hence unusable.
| Quadrant | # 1 sec bins | Bins with >0 counts | Bins with >2000 counts | High rate bins dominated by noise | Noise dominated (total time) | Noise dominated (detector-on time) | Marked lightcurve |
|---|---|---|---|---|---|---|---|
| A | 6930 | 5990 | 95 | 95 | 1.37% | 1.59% | 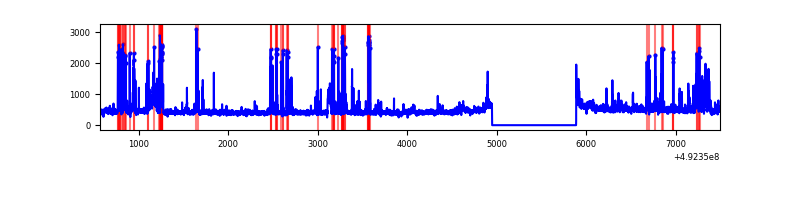 |
| B | 6931 | 5991 | 121 | 121 | 1.75% | 2.02% | 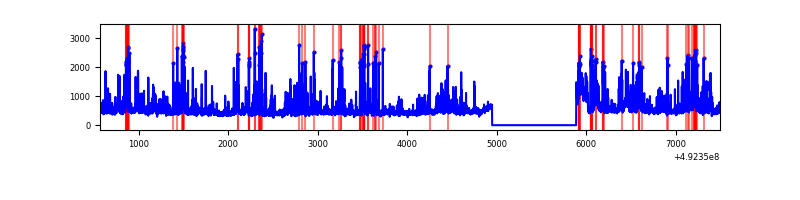 |
| C | 6931 | 5991 | 4737 | 4737 | 68.35% | 79.07% | 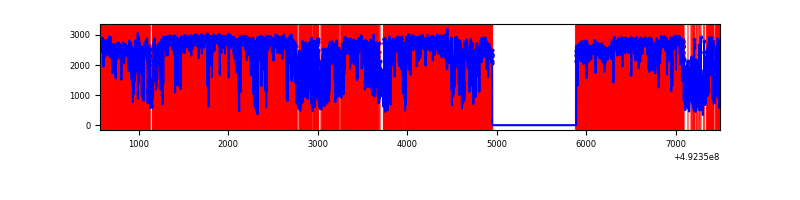 |
| D | 6930 | 5990 | 3381 | 3381 | 48.79% | 56.44% | 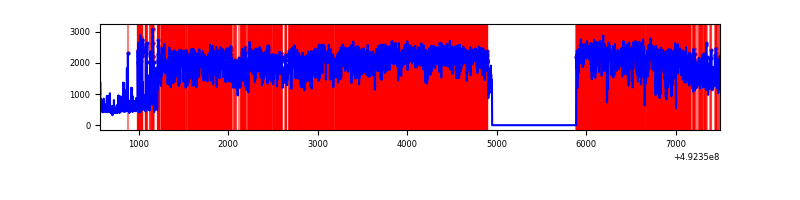 |
Top three noisy pixels from each quadrant. If the there are fewer than three noisy pixels in the level2.evt file, extra rows are filled as -1
| Pixel properties | Quadrant properties | ||||||
|---|---|---|---|---|---|---|---|
| Quadrant | DetID | PixID | Counts | Sigma | Mean | Median | Sigma |
| A | 15 | 174 | 279383 | 1757.81 | 635 | 619 | 158.6 |
| A | 3 | 78 | 129901 | 815.22 | 635 | 619 | 158.6 |
| A | 3 | 14 | 94731 | 593.44 | 635 | 619 | 158.6 |
| B | 10 | 247 | 225370 | 1696.04 | 623 | 603 | 132.5 |
| B | 1 | 255 | 206252 | 1551.78 | 623 | 603 | 132.5 |
| B | 0 | 171 | 165601 | 1245.03 | 623 | 603 | 132.5 |
| C | 1 | 241 | 8551304 | 105483.21 | 288 | 286 | 81.1 |
| C | 15 | 178 | 2470847 | 30476.22 | 288 | 286 | 81.1 |
| C | 15 | 224 | 873410 | 10770.64 | 288 | 286 | 81.1 |
| D | 2 | 62 | 10015494 | 152616.96 | 220 | 210 | 65.6 |
| D | 2 | 249 | 140262 | 2134.17 | 220 | 210 | 65.6 |
| D | 6 | 239 | 118670 | 1805.14 | 220 | 210 | 65.6 |
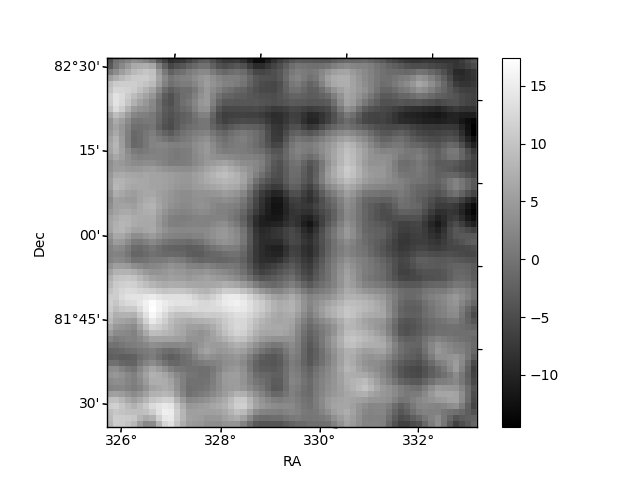
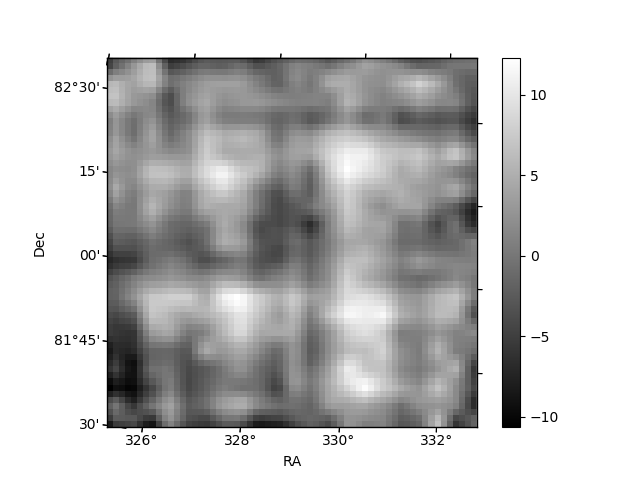
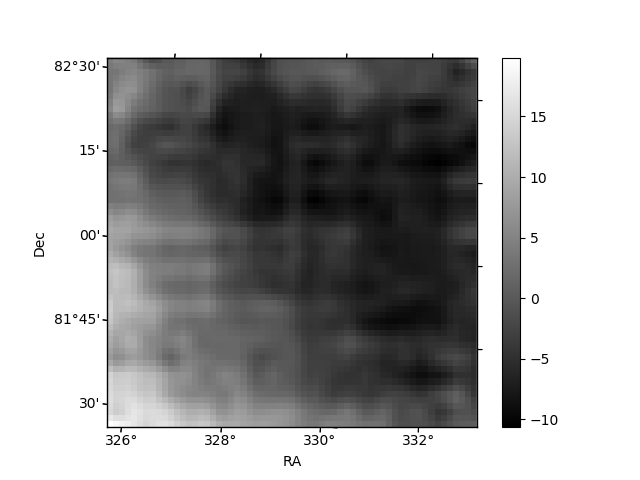
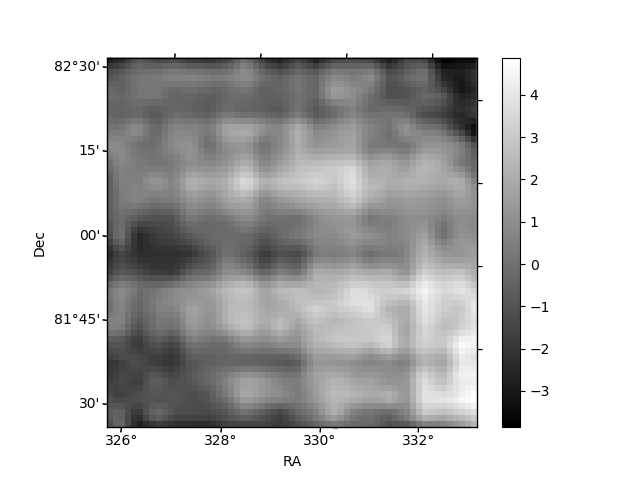
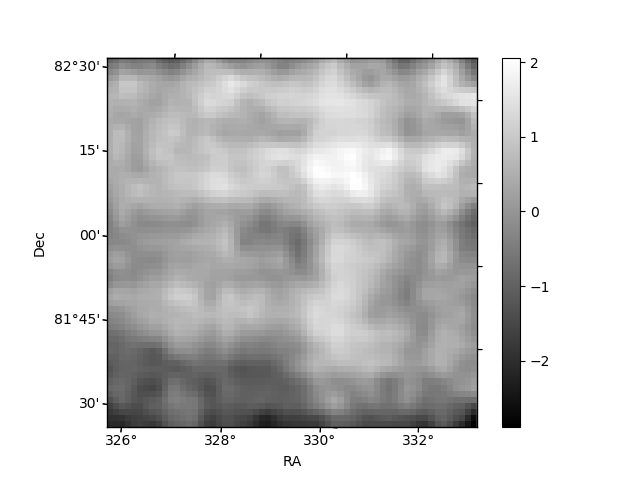
Histogram calculated using DETX and DETY for each event in the final _common_clean file
| Quadrant A | 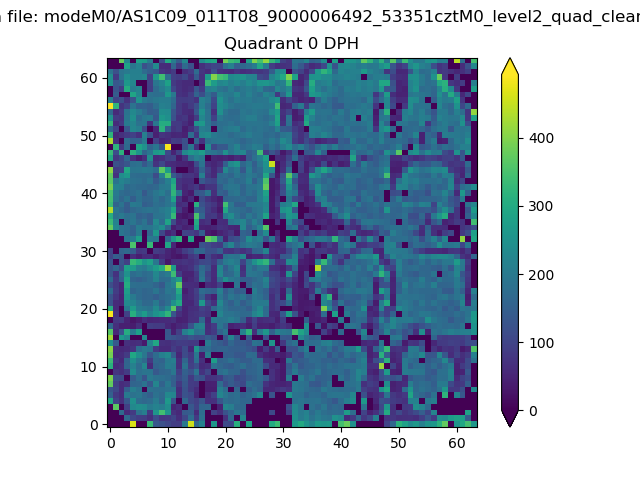 |
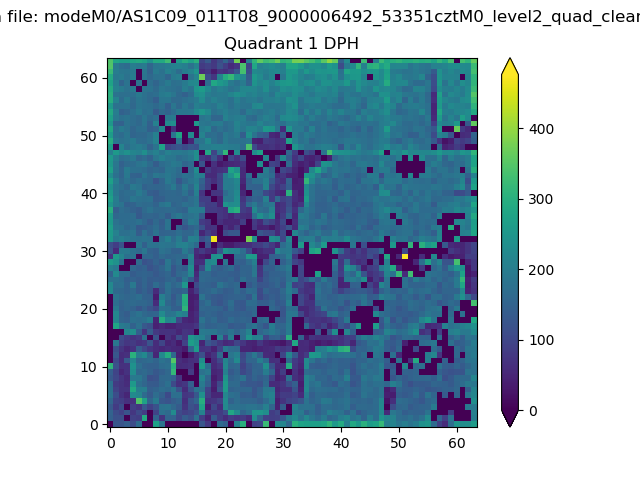 |
Quadrant B |
|---|---|---|---|
| Quadrant D | 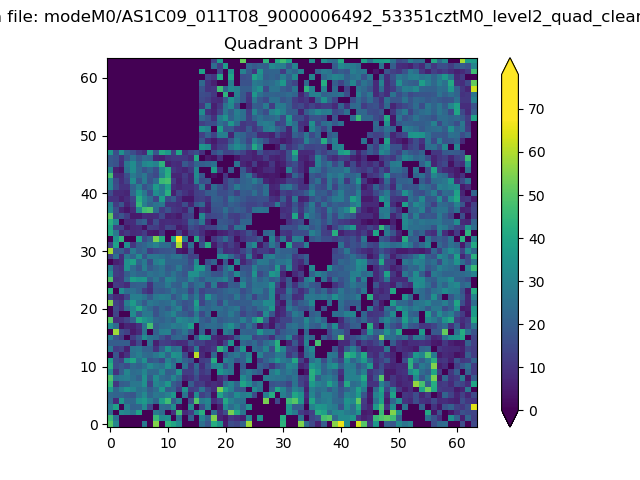 |
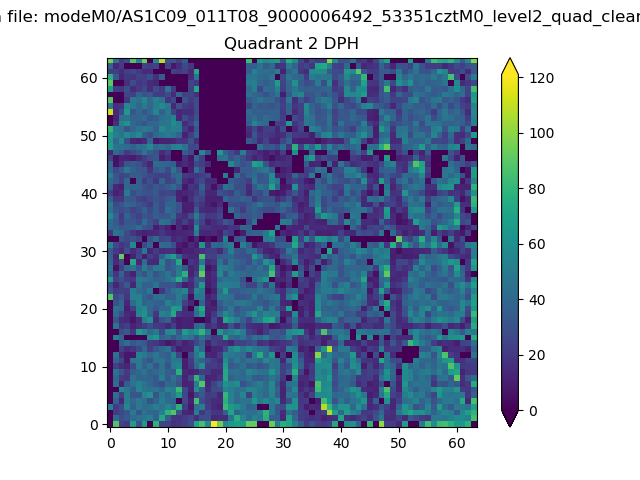 |
Quadrant C |
| Plot type | Count rate plots | Images |
|---|---|---|
| Comparison with Poisson distribution Blue bars denote a histogram of data divided into 1 sec bins. Red curve is a Poisson curve with rate = median count rate of data. |
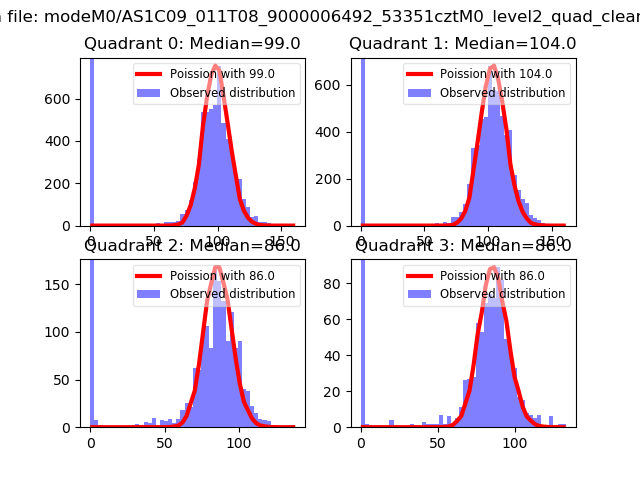 |
 |
| Quadrant-wise count rates Data is divided into 100 sec bins |
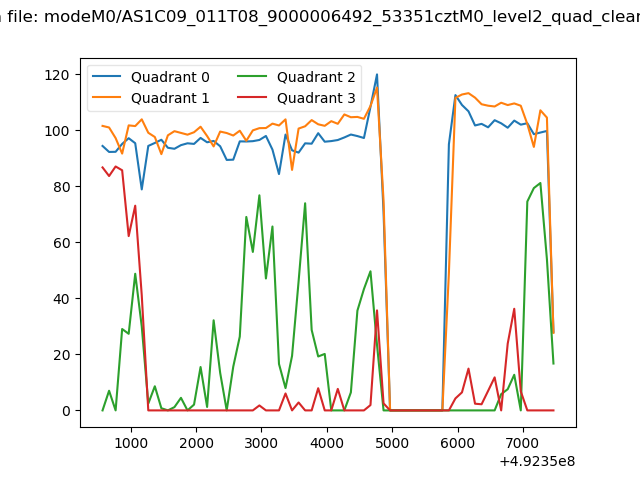 |
|
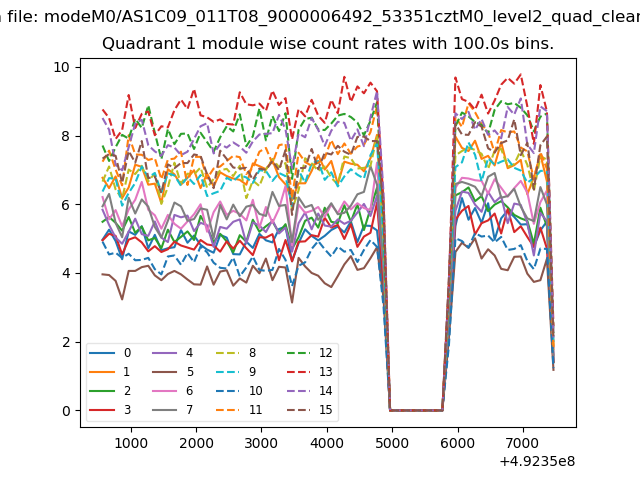
| Module-wise count rates for Quadrant A Data is divided into 100 sec bins |
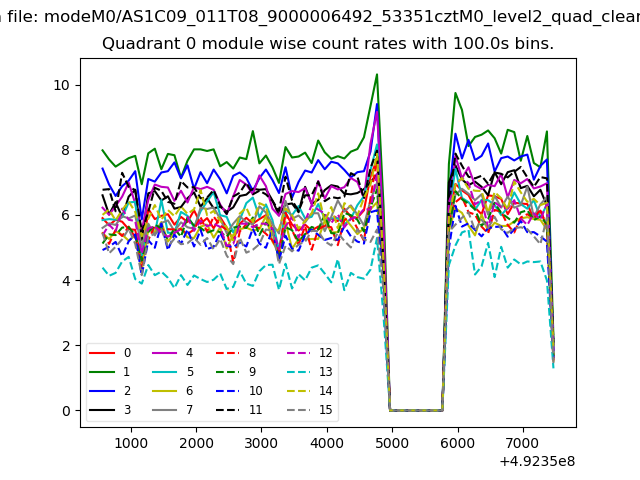 |
 |
| Module-wise count rates for Quadrant B Data is divided into 100 sec bins |
 |
 |
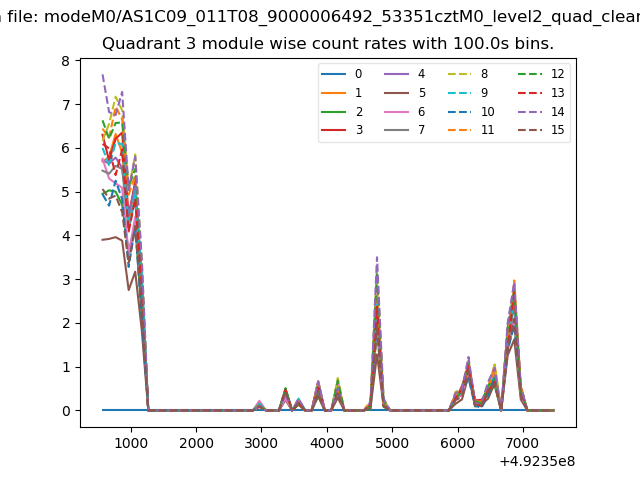
| Module-wise count rates for Quadrant C Data is divided into 100 sec bins |
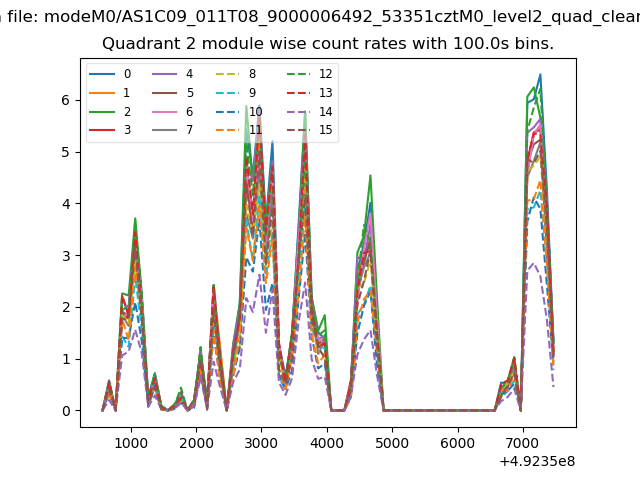 |
 |
| Module-wise count rates for Quadrant D Data is divided into 100 sec bins |
 |
 |
| Parameter | Plot |
|---|---|
| CZT HV Monitor |  |
| D_VDD | 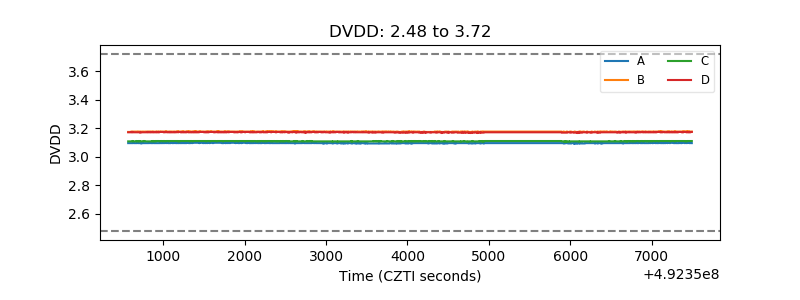 |
| Temperature 1 | 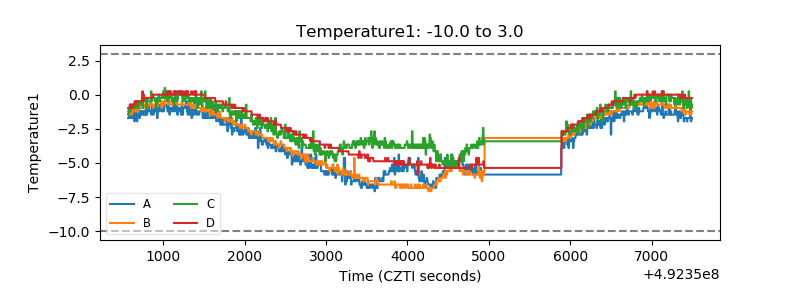 |
| Veto HV Monitor | 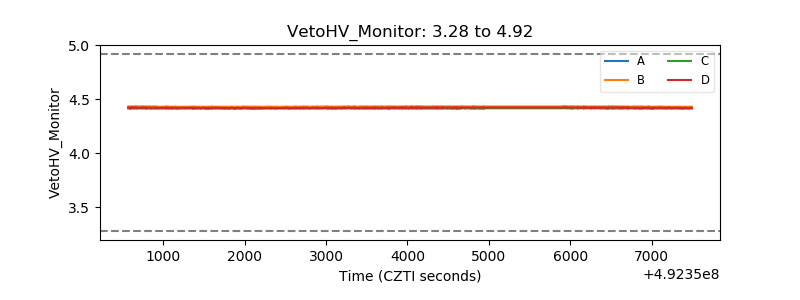 |
| Veto LLD | 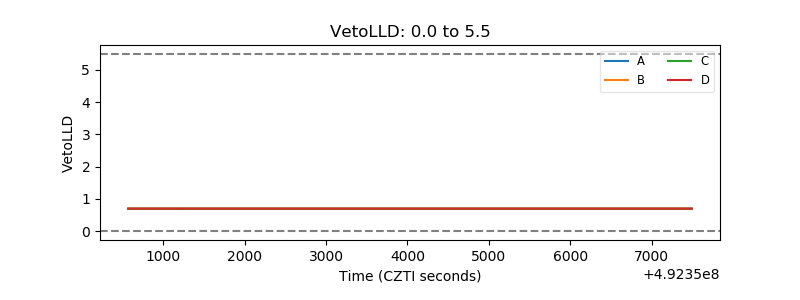 |
| Alpha Counter | 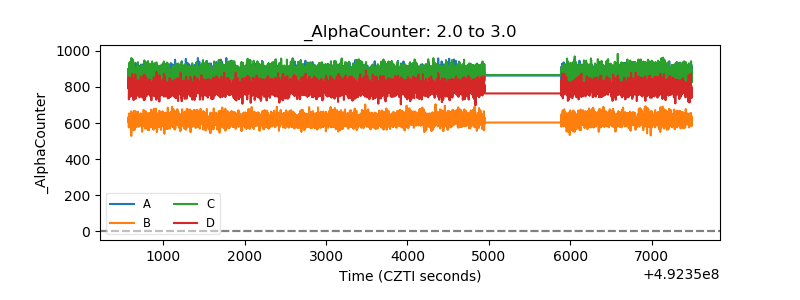 |
| _CPM_Rate | 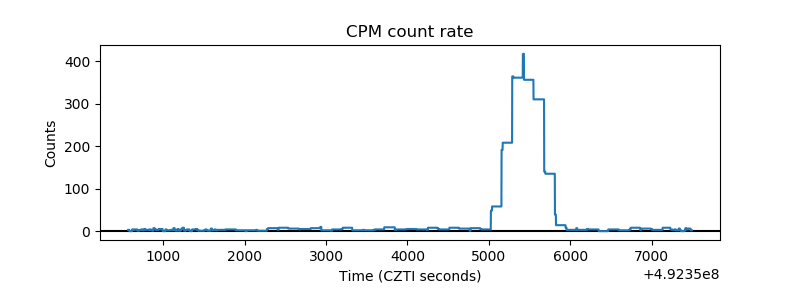 |
| CZT Counter | 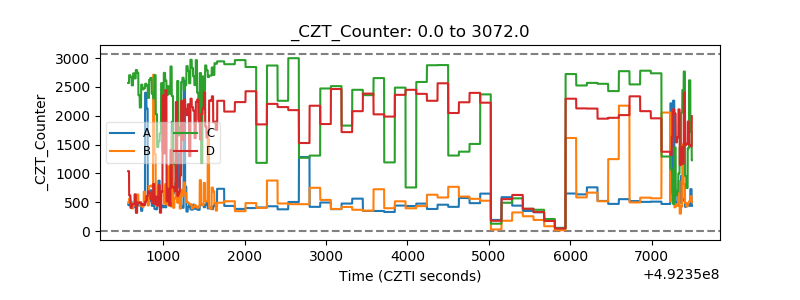 |
| +2.5 Volts monitor |  |
| +5 Volts monitor |  |
| _ROLL_ROT | 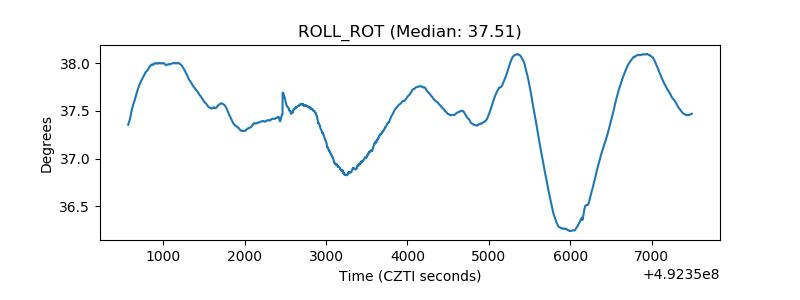 |
| _Roll_DEC | 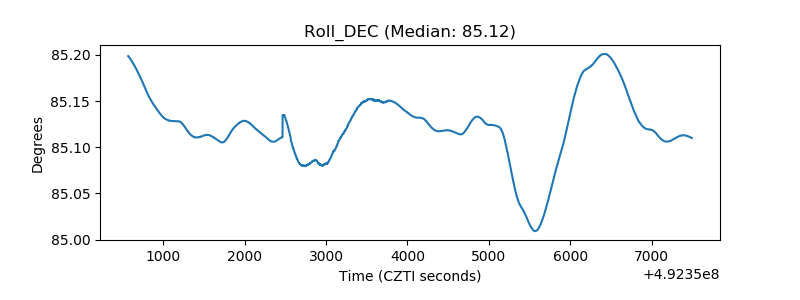 |
| _Roll_RA | 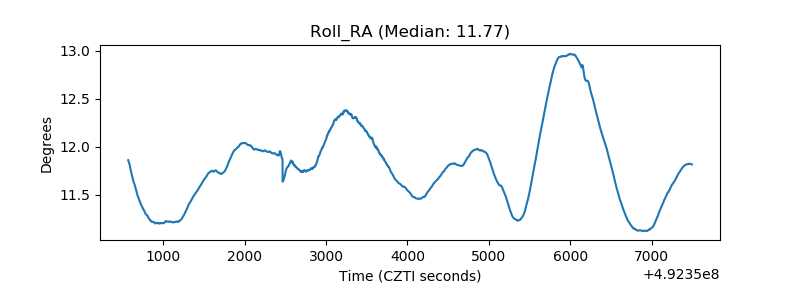 |
| Veto Counter | 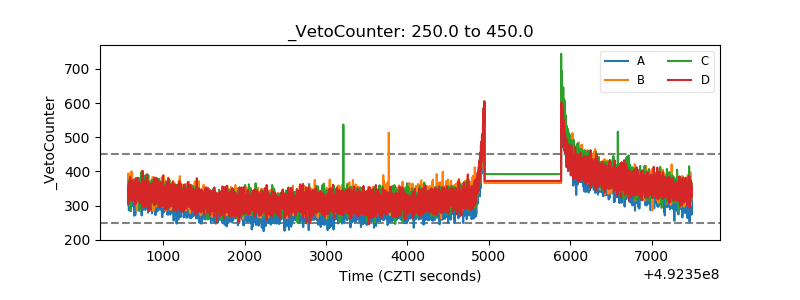 |