| Param | Original file | Final file |
|---|---|---|
| Filename | modeM0/AS1C09_011T08_9000006492_53352cztM0_level2.fits | modeM0/AS1C09_011T08_9000006492_53352cztM0_level2_quad_clean.evt |
| Size (bytes) | 881,098,560 | 64,327,680 |
| Size | 840.3 MB | 61.3 MB |
| Events in quadrant A | 3,712,435 | 607,134 |
| Events in quadrant B | 4,178,706 | 638,453 |
| Events in quadrant C | 12,180,184 | 263,259 |
| Events in quadrant D | 12,066,586 | 9,621 |
| Mode M0 | |||
|---|---|---|---|
| Quadrant | BADHDUFLAG | Total packets | Discarded packets |
| A | 0 | 15173 | 1 |
| B | 0 | 16684 | 1 |
| C | 0 | 40418 | 1 |
| D | 0 | 40079 | 1 |
| Mode M9 | |||
|---|---|---|---|
| Quadrant | BADHDUFLAG | Total packets | Discarded packets |
| A | 0 | 11 | 0 |
| B | 0 | 11 | 0 |
| C | 0 | 11 | 0 |
| D | 0 | 11 | 0 |
| Mode SS | |||
|---|---|---|---|
| Quadrant | BADHDUFLAG | Total packets | Discarded packets |
| A | 0 | 124 | 0 |
| B | 0 | 124 | 0 |
| C | 0 | 124 | 0 |
| D | 0 | 124 | 0 |
| Quadrant | Total seconds | Saturated seconds | Saturation percentage |
|---|---|---|---|
| A | 6148 | 169 | 2.748861% |
| B | 6148 | 270 | 4.391672% |
| C | 6147 | 3573 | 58.125915% |
| D | 6147 | 6072 | 98.779893% |
Noise dominated data is calculated using 1-second bins in cleaned event files. If a bin has >2000 counts, and if more than 50% of those come from <1% of pixels, then it is considered to be noise-dominated and hence unusable.
| Quadrant | # 1 sec bins | Bins with >0 counts | Bins with >2000 counts | High rate bins dominated by noise | Noise dominated (total time) | Noise dominated (detector-on time) | Marked lightcurve |
|---|---|---|---|---|---|---|---|
| A | 7243 | 6148 | 129 | 129 | 1.78% | 2.10% | 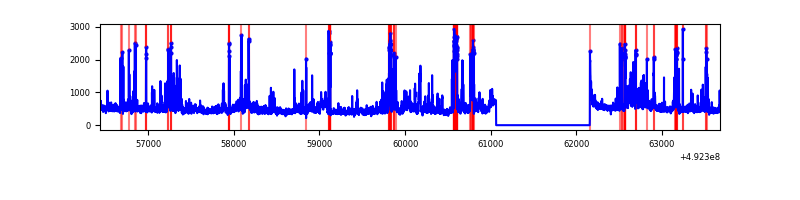 |
| B | 7242 | 6148 | 196 | 196 | 2.71% | 3.19% | 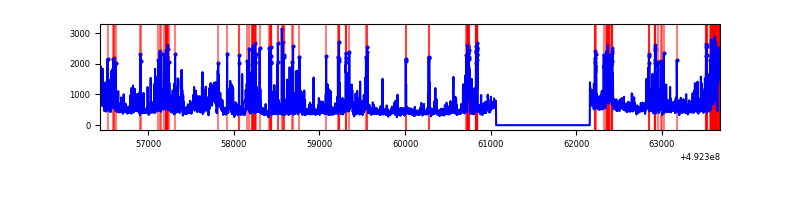 |
| C | 7242 | 6147 | 3624 | 3624 | 50.04% | 58.96% | 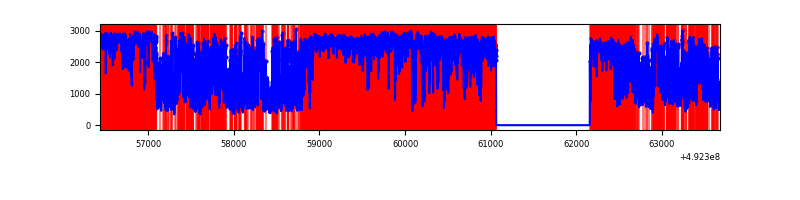 |
| D | 7241 | 6146 | 2909 | 2909 | 40.17% | 47.33% | 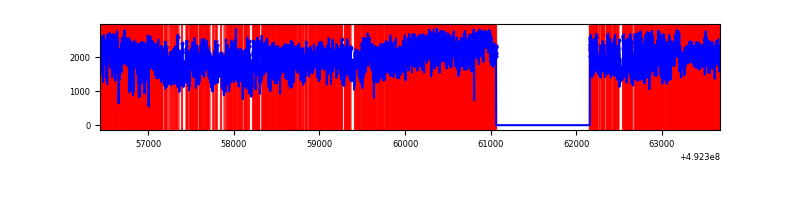 |
Top three noisy pixels from each quadrant. If the there are fewer than three noisy pixels in the level2.evt file, extra rows are filled as -1
| Pixel properties | Quadrant properties | ||||||
|---|---|---|---|---|---|---|---|
| Quadrant | DetID | PixID | Counts | Sigma | Mean | Median | Sigma |
| A | 15 | 174 | 370272 | 2273.56 | 653 | 637 | 162.6 |
| A | 11 | 3 | 198896 | 1219.45 | 653 | 637 | 162.6 |
| A | 3 | 14 | 95943 | 586.21 | 653 | 637 | 162.6 |
| B | 10 | 247 | 434173 | 3173.65 | 641 | 619 | 136.6 |
| B | 5 | 185 | 286987 | 2096.24 | 641 | 619 | 136.6 |
| B | 0 | 171 | 171491 | 1250.8 | 641 | 619 | 136.6 |
| C | 15 | 178 | 4470321 | 37685.14 | 432 | 429 | 118.6 |
| C | 1 | 241 | 3185703 | 26854.67 | 432 | 429 | 118.6 |
| C | 15 | 224 | 1239739 | 10448.48 | 432 | 429 | 118.6 |
| D | 2 | 62 | 11344020 | 333916.26 | 111 | 104 | 34.0 |
| D | 6 | 239 | 116761 | 3433.87 | 111 | 104 | 34.0 |
| D | 2 | 249 | 62445 | 1835.04 | 111 | 104 | 34.0 |
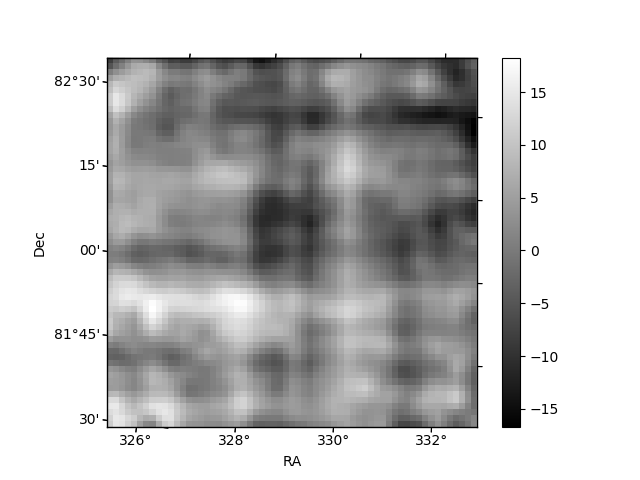
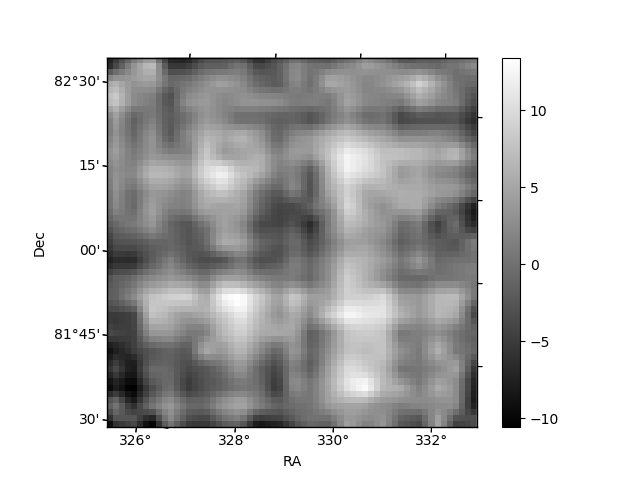
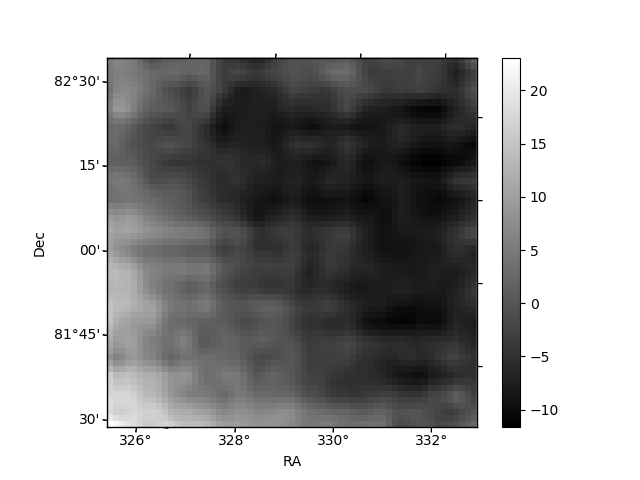
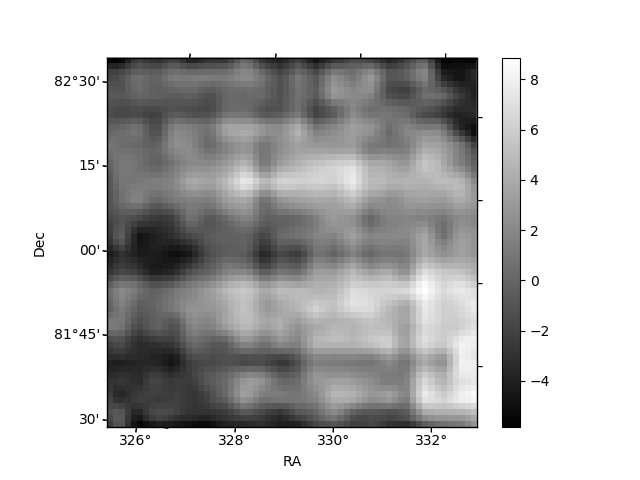
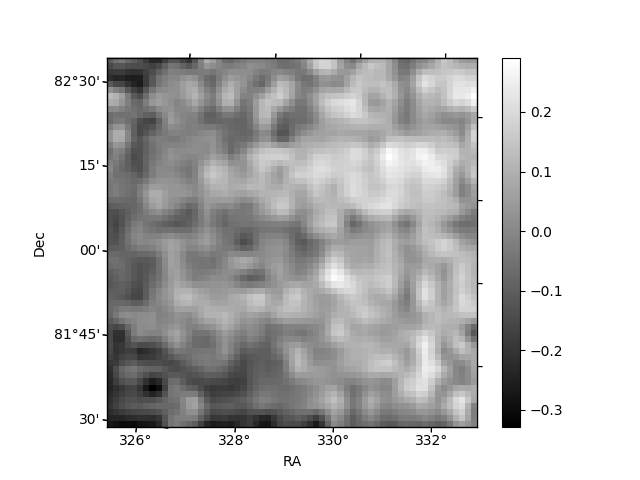
Histogram calculated using DETX and DETY for each event in the final _common_clean file
| Quadrant A | 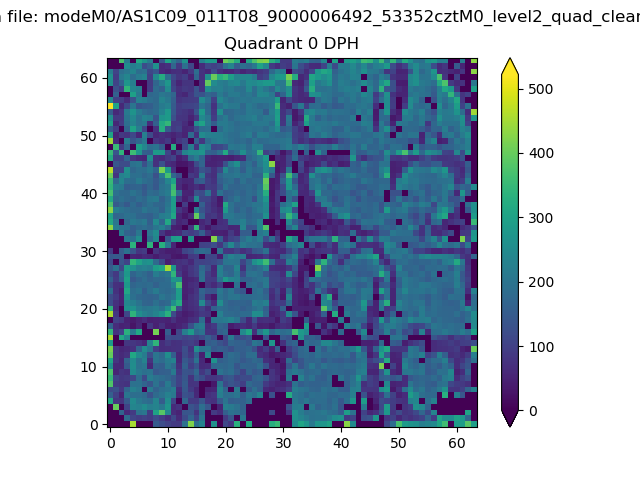 |
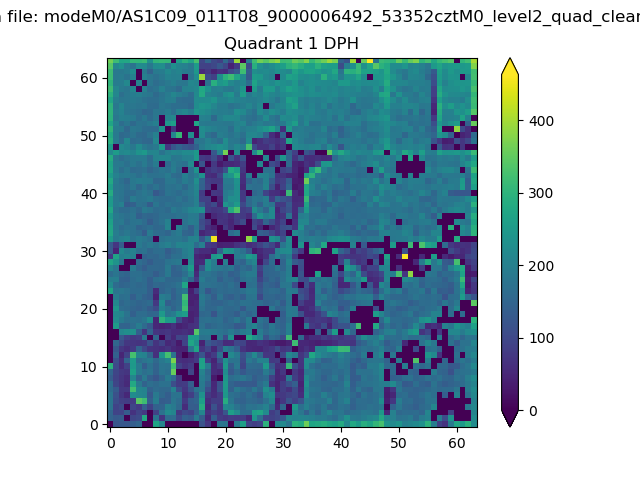 |
Quadrant B |
|---|---|---|---|
| Quadrant D | 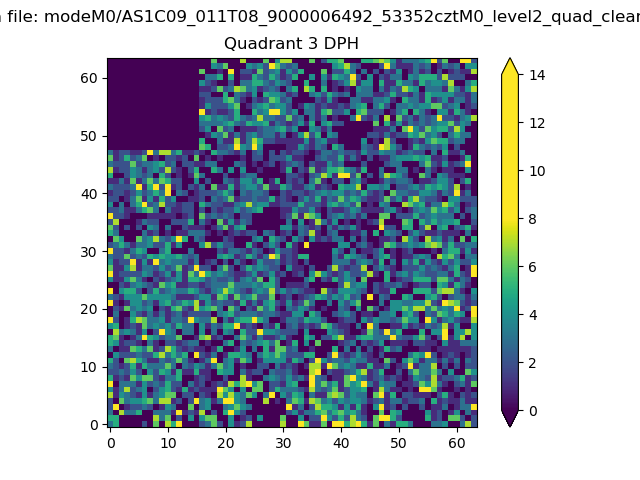 |
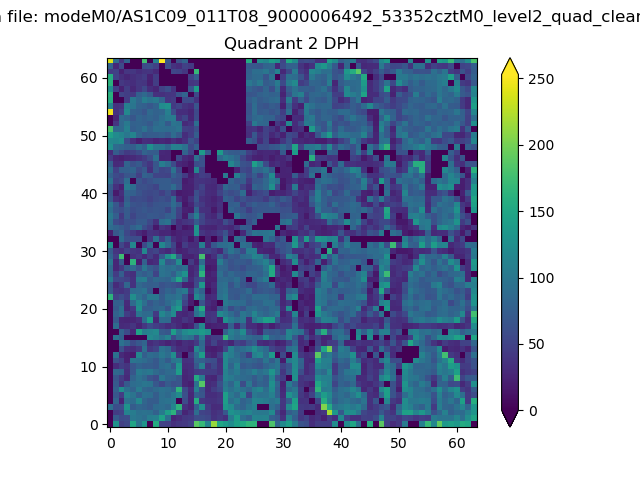 |
Quadrant C |
| Plot type | Count rate plots | Images |
|---|---|---|
| Comparison with Poisson distribution Blue bars denote a histogram of data divided into 1 sec bins. Red curve is a Poisson curve with rate = median count rate of data. |
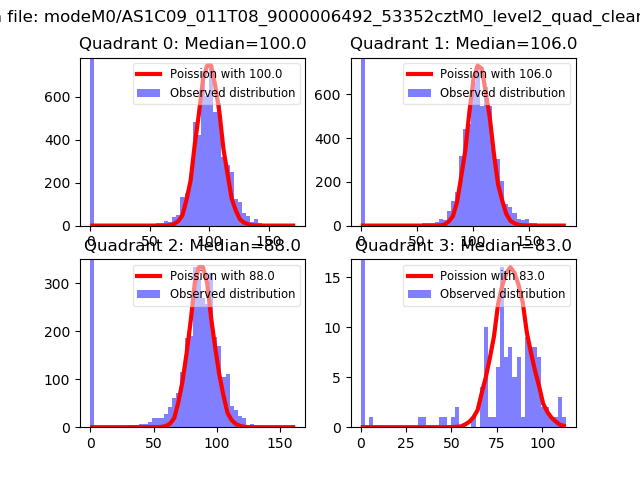 |
 |
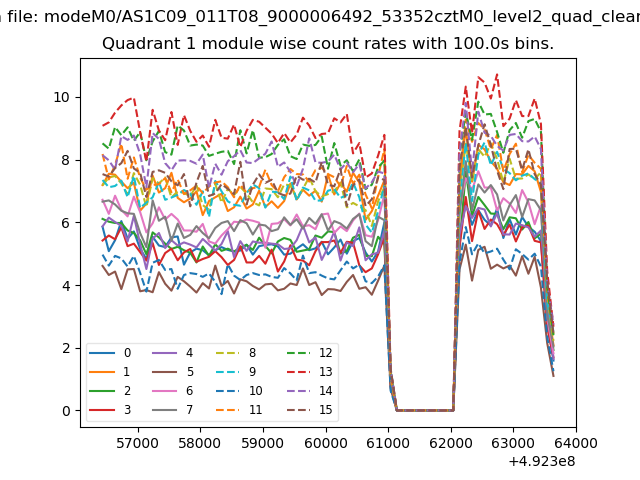
| Quadrant-wise count rates Data is divided into 100 sec bins |
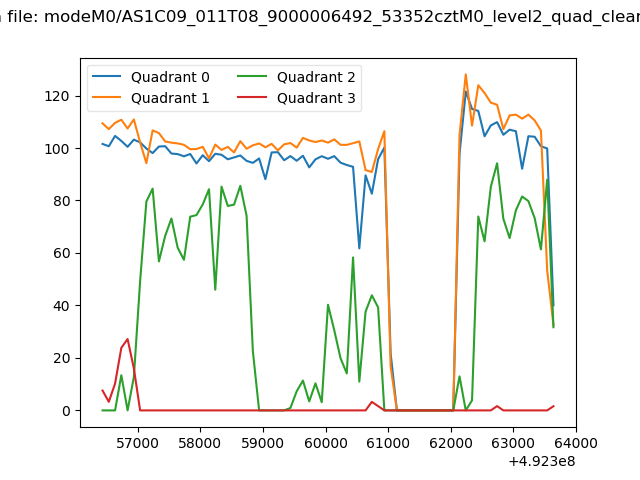 |
|
| Module-wise count rates for Quadrant A Data is divided into 100 sec bins |
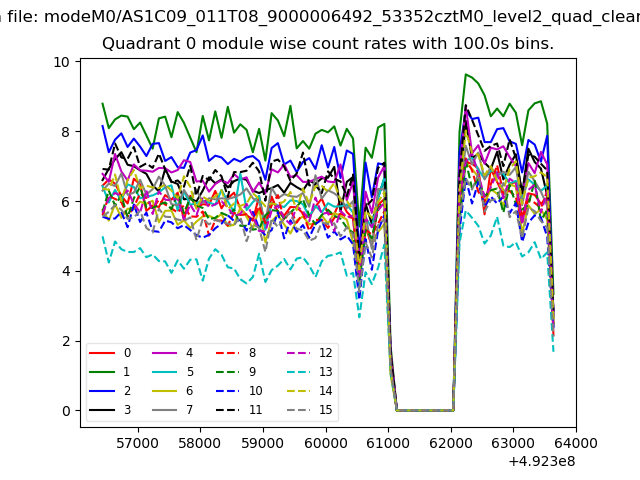 |
 |
| Module-wise count rates for Quadrant B Data is divided into 100 sec bins |
 |
 |
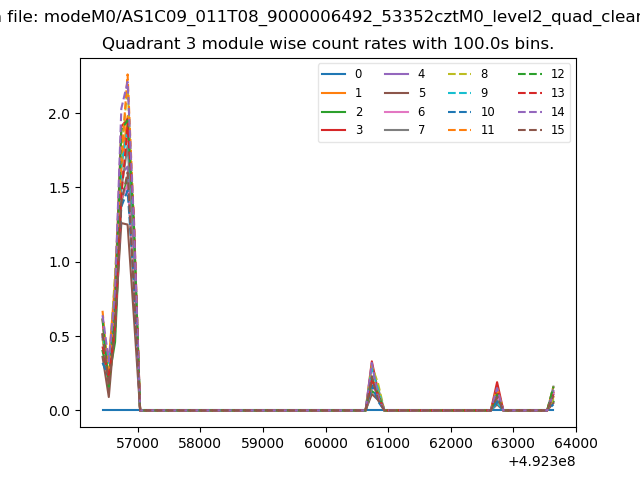
| Module-wise count rates for Quadrant C Data is divided into 100 sec bins |
 |
 |
| Module-wise count rates for Quadrant D Data is divided into 100 sec bins |
 |
 |
| Parameter | Plot |
|---|---|
| CZT HV Monitor | 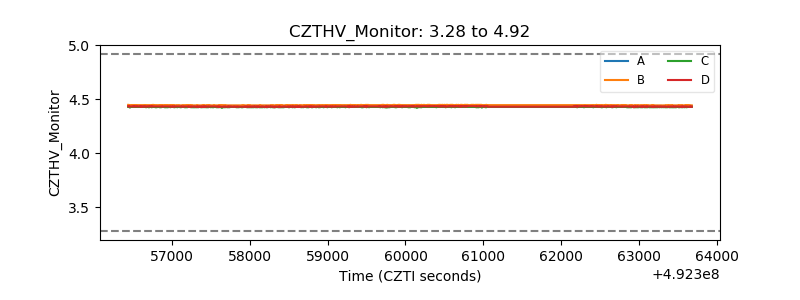 |
| D_VDD | 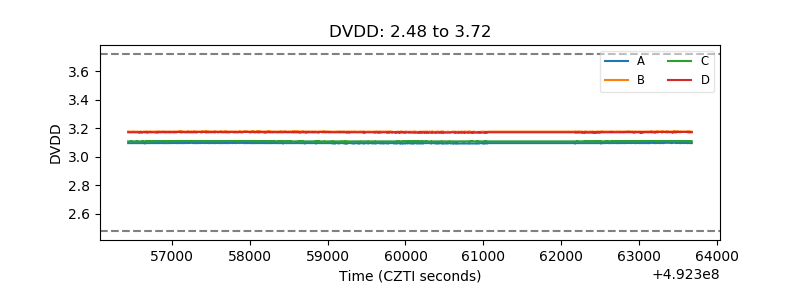 |
| Temperature 1 | 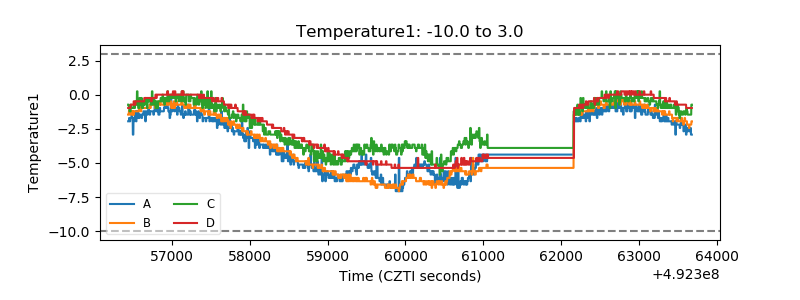 |
| Veto HV Monitor |  |
| Veto LLD | 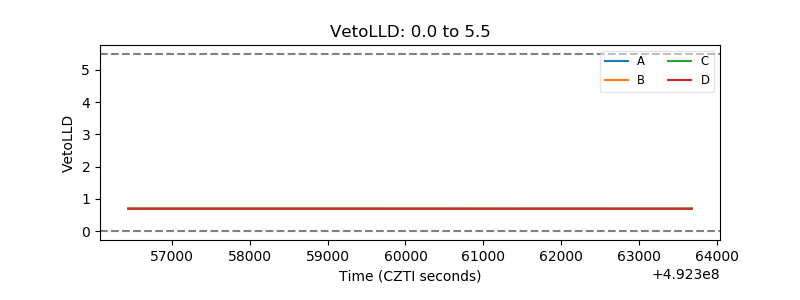 |
| Alpha Counter | 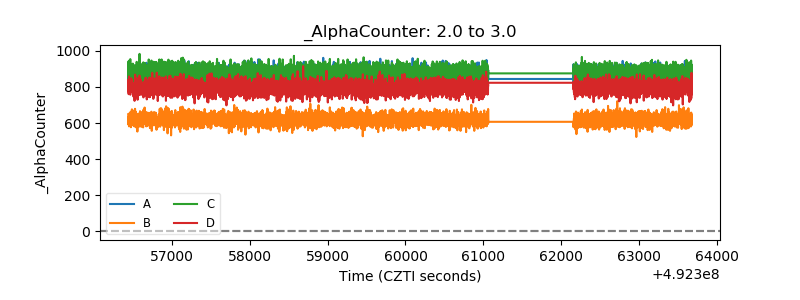 |
| _CPM_Rate | 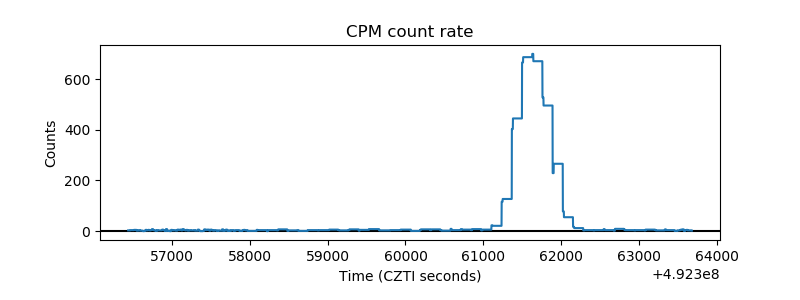 |
| CZT Counter | 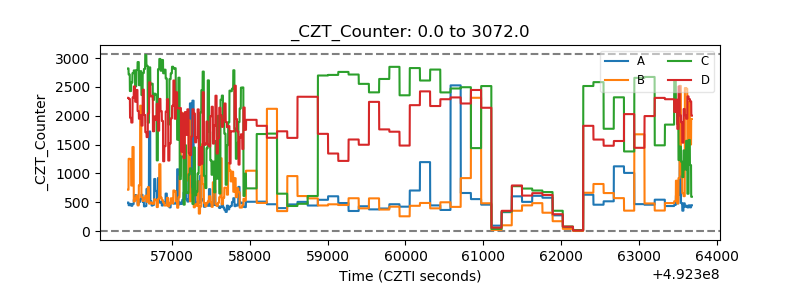 |
| +2.5 Volts monitor |  |
| +5 Volts monitor |  |
| _ROLL_ROT | 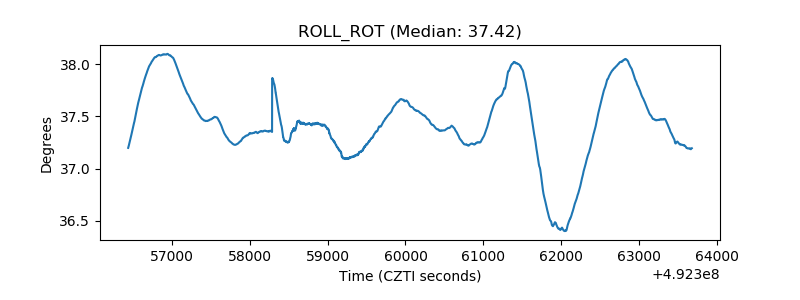 |
| _Roll_DEC | 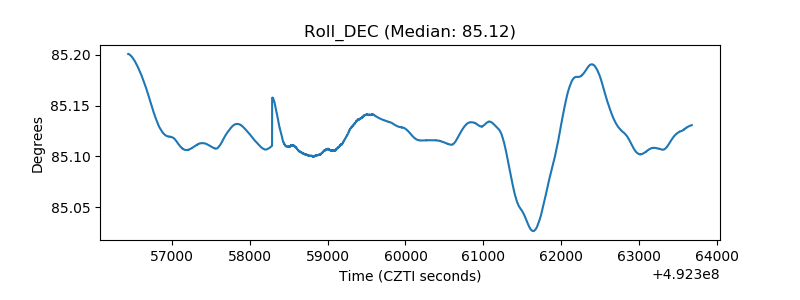 |
| _Roll_RA | 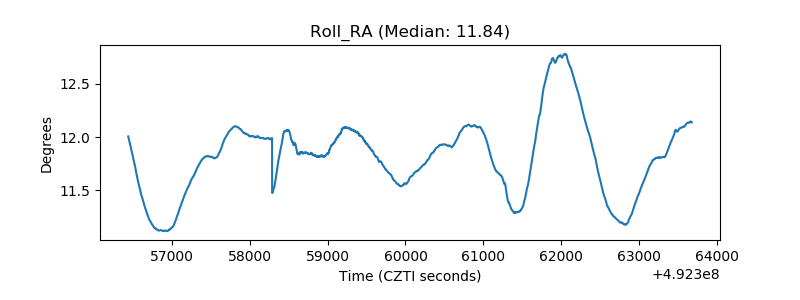 |
| Veto Counter | 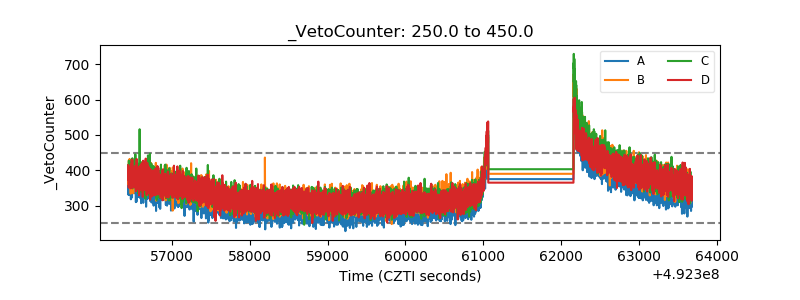 |