| Param | Original file | Final file |
|---|---|---|
| Filename | modeM0/AS1C09_011T08_9000006492_53353cztM0_level2.fits | modeM0/AS1C09_011T08_9000006492_53353cztM0_level2_quad_clean.evt |
| Size (bytes) | 896,215,680 | 66,369,600 |
| Size | 854.7 MB | 63.3 MB |
| Events in quadrant A | 3,843,684 | 626,708 |
| Events in quadrant B | 4,373,205 | 644,399 |
| Events in quadrant C | 11,664,702 | 294,726 |
| Events in quadrant D | 12,807,438 | 6,283 |
| Mode M0 | |||
|---|---|---|---|
| Quadrant | BADHDUFLAG | Total packets | Discarded packets |
| A | 0 | 15675 | 1 |
| B | 0 | 17318 | 1 |
| C | 0 | 38944 | 2 |
| D | 0 | 42370 | 1 |
| Mode M9 | |||
|---|---|---|---|
| Quadrant | BADHDUFLAG | Total packets | Discarded packets |
| A | 0 | 11 | 0 |
| B | 0 | 11 | 0 |
| C | 0 | 11 | 0 |
| D | 0 | 11 | 0 |
| Mode SS | |||
|---|---|---|---|
| Quadrant | BADHDUFLAG | Total packets | Discarded packets |
| A | 0 | 128 | 0 |
| B | 0 | 128 | 0 |
| C | 0 | 128 | 0 |
| D | 0 | 128 | 0 |
| Quadrant | Total seconds | Saturated seconds | Saturation percentage |
|---|---|---|---|
| A | 6261 | 193 | 3.082575% |
| B | 6261 | 442 | 7.059575% |
| C | 6260 | 3427 | 54.744409% |
| D | 6260 | 6213 | 99.249201% |
Noise dominated data is calculated using 1-second bins in cleaned event files. If a bin has >2000 counts, and if more than 50% of those come from <1% of pixels, then it is considered to be noise-dominated and hence unusable.
| Quadrant | # 1 sec bins | Bins with >0 counts | Bins with >2000 counts | High rate bins dominated by noise | Noise dominated (total time) | Noise dominated (detector-on time) | Marked lightcurve |
|---|---|---|---|---|---|---|---|
| A | 7401 | 6261 | 128 | 128 | 1.73% | 2.04% | 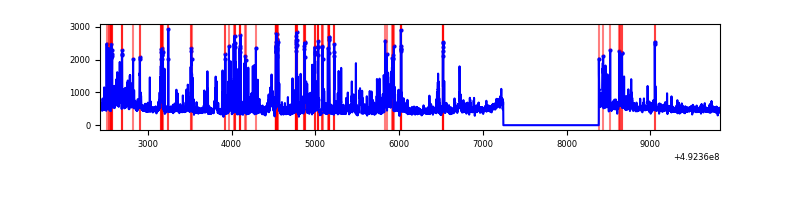 |
| B | 7401 | 6261 | 306 | 306 | 4.13% | 4.89% | 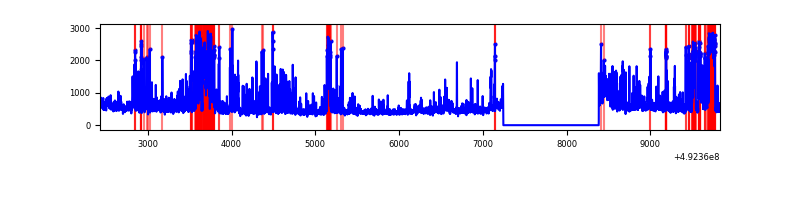 |
| C | 7400 | 6260 | 3395 | 3395 | 45.88% | 54.23% | 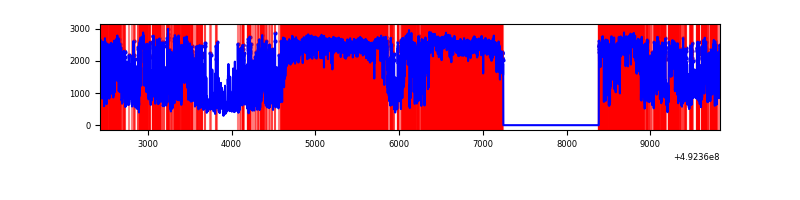 |
| D | 7399 | 6259 | 3643 | 3643 | 49.24% | 58.20% | 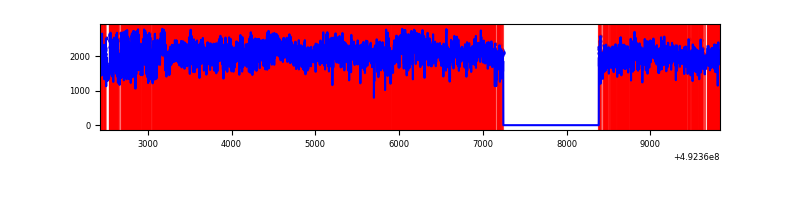 |
Top three noisy pixels from each quadrant. If the there are fewer than three noisy pixels in the level2.evt file, extra rows are filled as -1
| Pixel properties | Quadrant properties | ||||||
|---|---|---|---|---|---|---|---|
| Quadrant | DetID | PixID | Counts | Sigma | Mean | Median | Sigma |
| A | 15 | 174 | 360533 | 2123.3 | 673 | 657 | 169.5 |
| A | 3 | 62 | 146967 | 863.24 | 673 | 657 | 169.5 |
| A | 3 | 14 | 114220 | 670.03 | 673 | 657 | 169.5 |
| B | 10 | 247 | 566236 | 4043.49 | 657 | 634 | 139.9 |
| B | 5 | 185 | 255149 | 1819.53 | 657 | 634 | 139.9 |
| B | 0 | 171 | 170327 | 1213.14 | 657 | 634 | 139.9 |
| C | 15 | 178 | 5111160 | 39653.75 | 466 | 463 | 128.9 |
| C | 15 | 224 | 1827711 | 14177.57 | 466 | 463 | 128.9 |
| C | 15 | 158 | 1090324 | 8456.2 | 466 | 463 | 128.9 |
| D | 2 | 62 | 11690476 | 262445.12 | 147 | 140 | 44.5 |
| D | 6 | 239 | 235200 | 5277.04 | 147 | 140 | 44.5 |
| D | 11 | 245 | 79604 | 1783.95 | 147 | 140 | 44.5 |
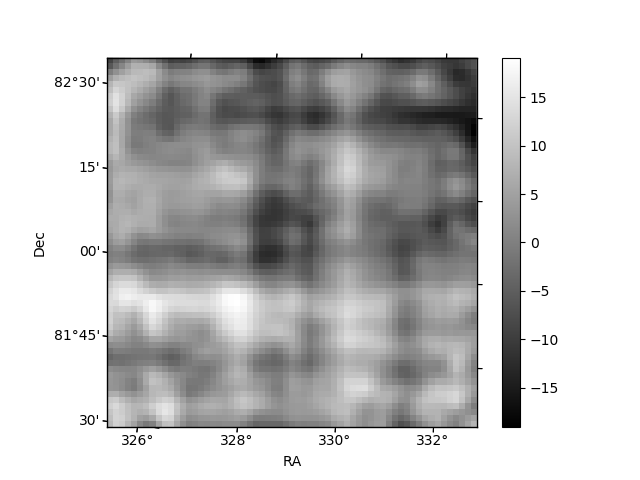
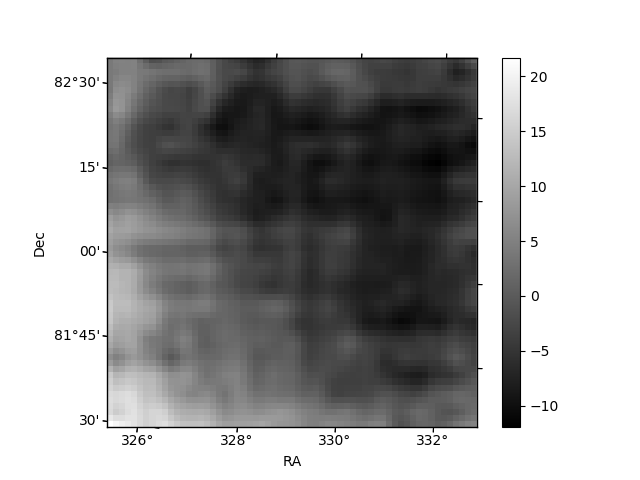
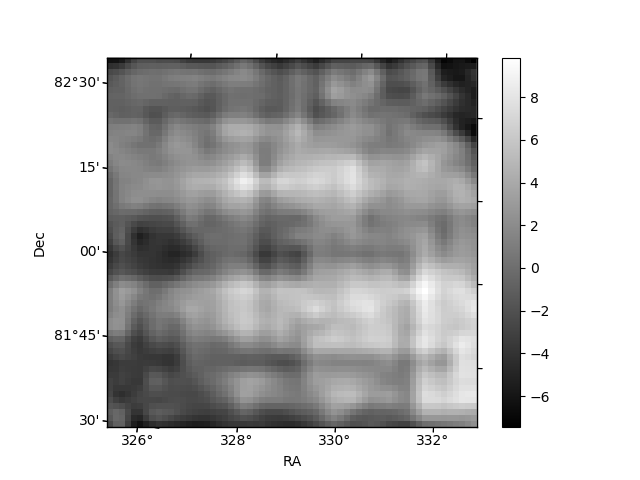
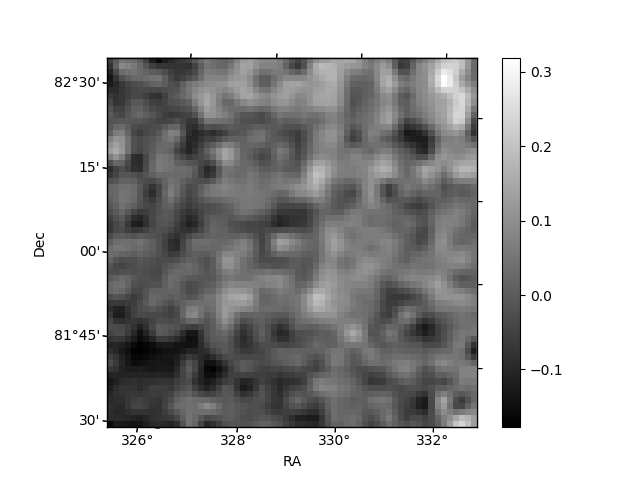
Histogram calculated using DETX and DETY for each event in the final _common_clean file
| Quadrant A | 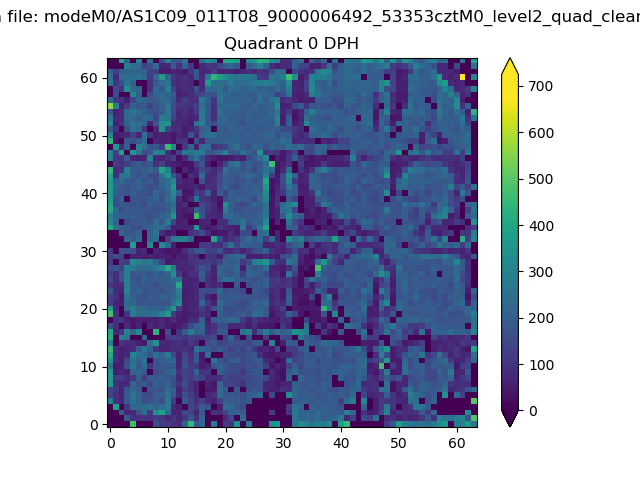 |
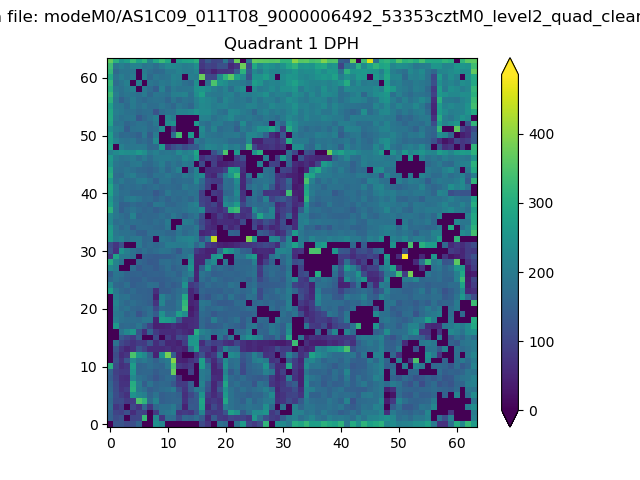 |
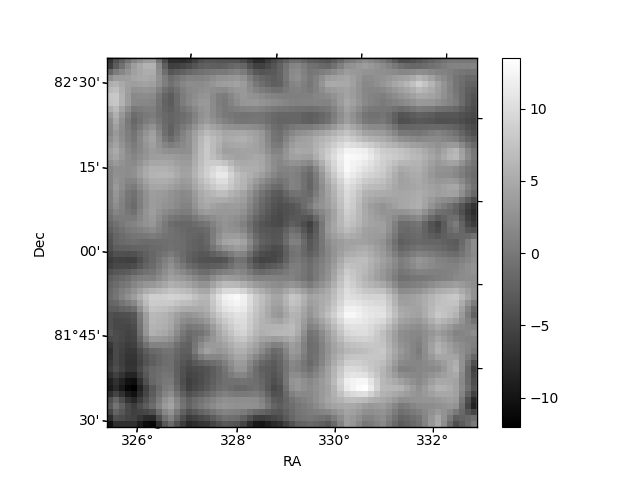
Quadrant B |
|---|---|---|---|
| Quadrant D |  |
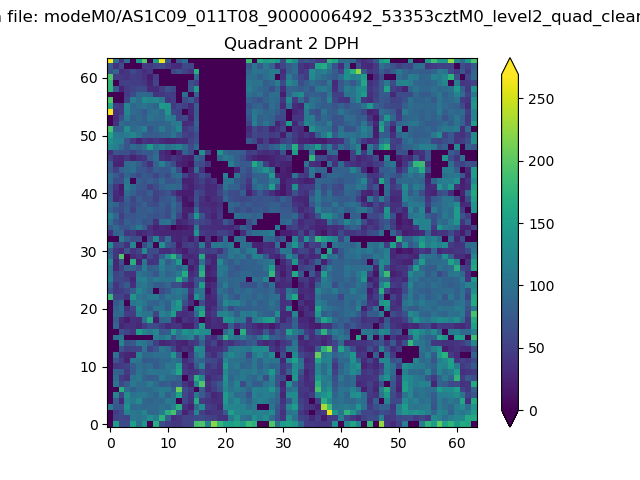 |
Quadrant C |
| Plot type | Count rate plots | Images |
|---|---|---|
| Comparison with Poisson distribution Blue bars denote a histogram of data divided into 1 sec bins. Red curve is a Poisson curve with rate = median count rate of data. |
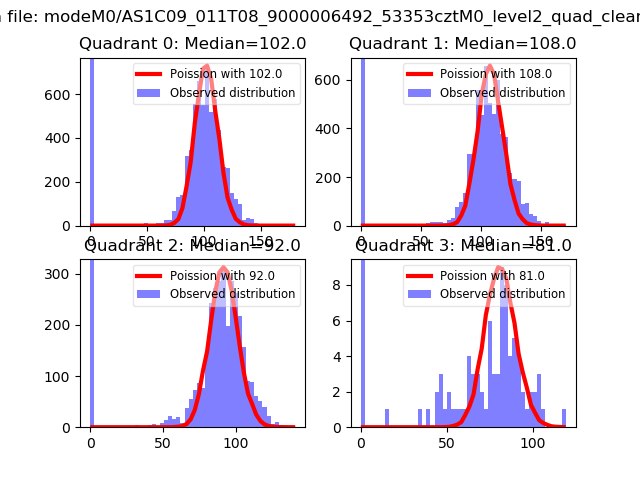 |
 |
| Quadrant-wise count rates Data is divided into 100 sec bins |
 |
|
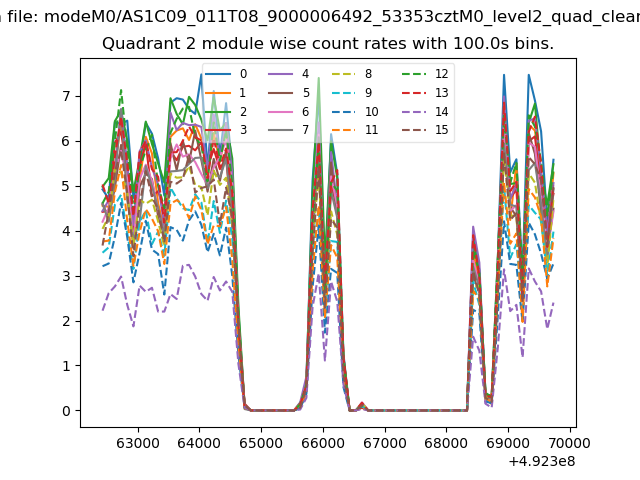
| Module-wise count rates for Quadrant A Data is divided into 100 sec bins |
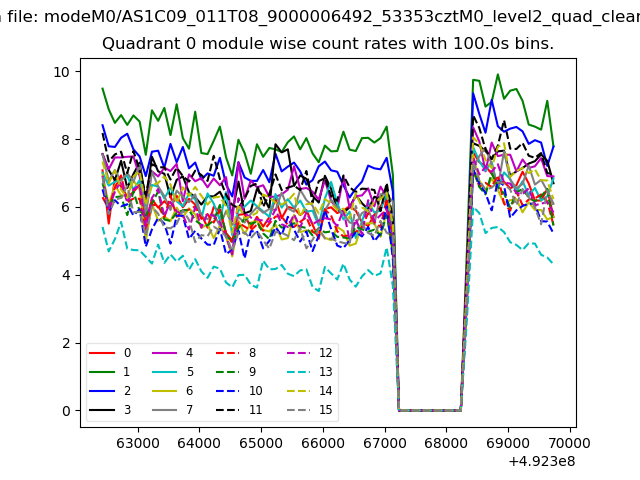 |
 |
| Module-wise count rates for Quadrant B Data is divided into 100 sec bins |
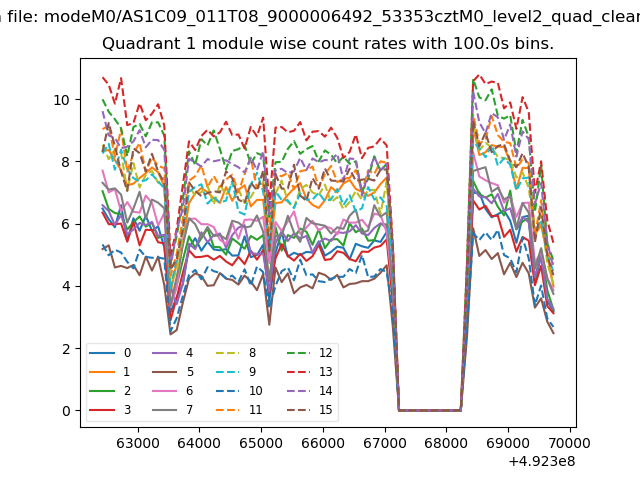 |
 |
| Module-wise count rates for Quadrant C Data is divided into 100 sec bins |
 |
 |
| Module-wise count rates for Quadrant D Data is divided into 100 sec bins |
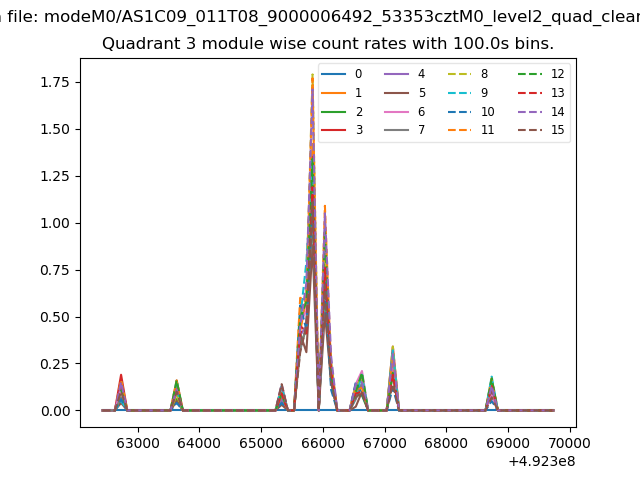 |
 |
| Parameter | Plot |
|---|---|
| CZT HV Monitor | 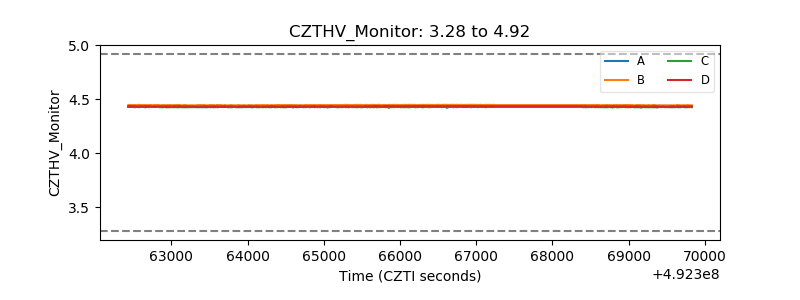 |
| D_VDD | 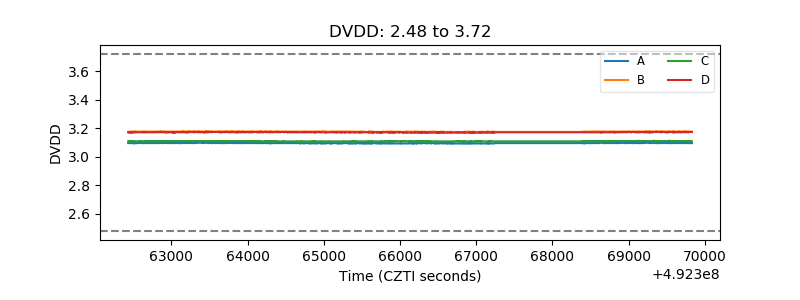 |
| Temperature 1 | 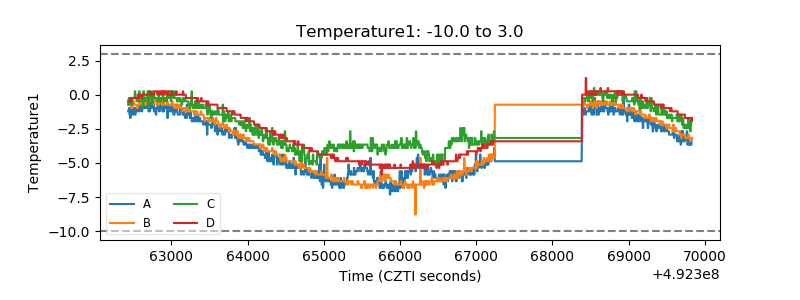 |
| Veto HV Monitor | 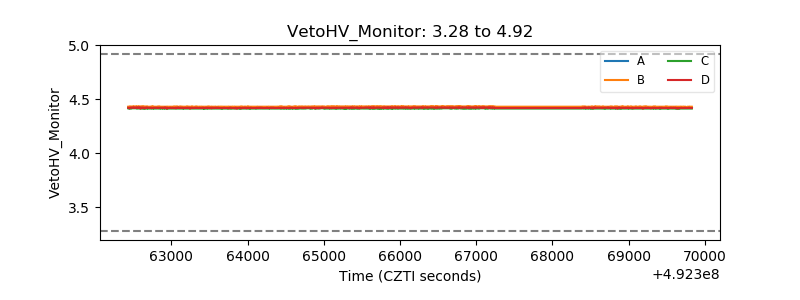 |
| Veto LLD | 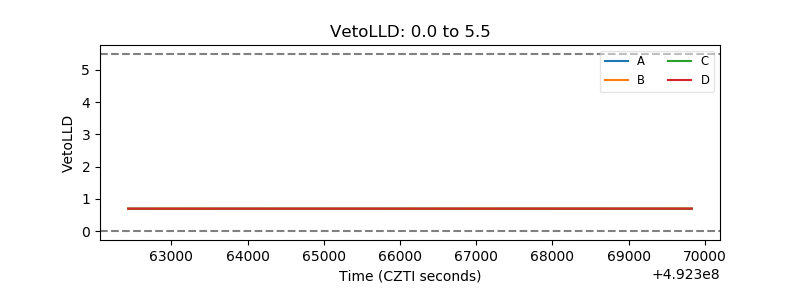 |
| Alpha Counter | 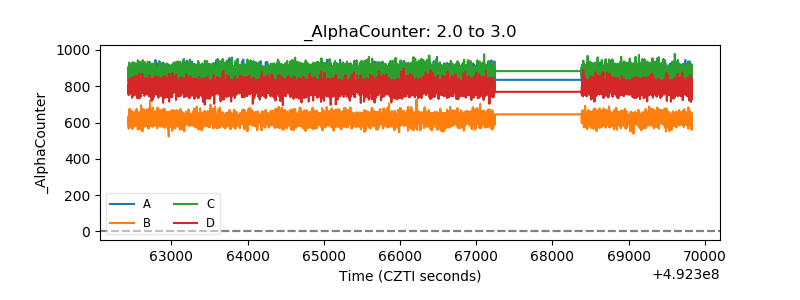 |
| _CPM_Rate | 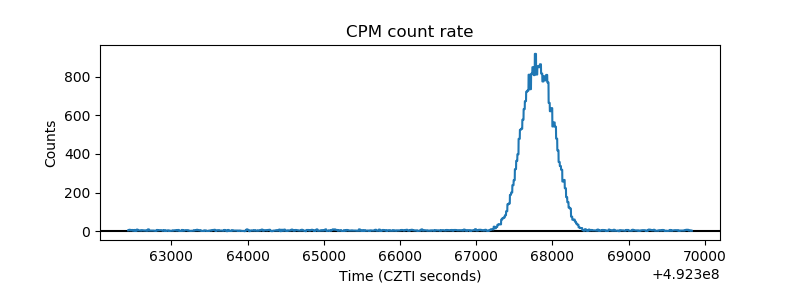 |
| CZT Counter | 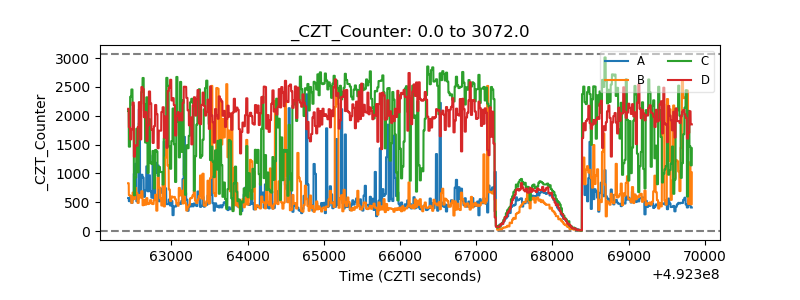 |
| +2.5 Volts monitor |  |
| +5 Volts monitor |  |
| _ROLL_ROT | 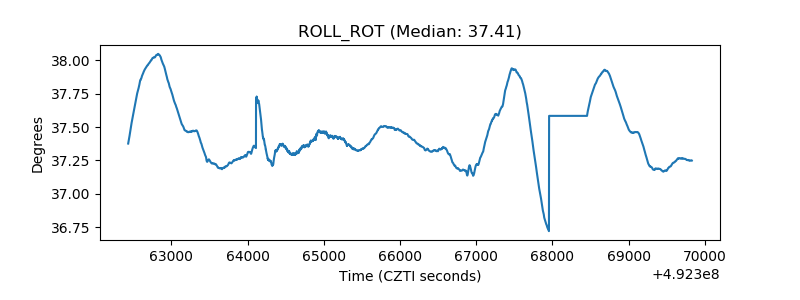 |
| _Roll_DEC | 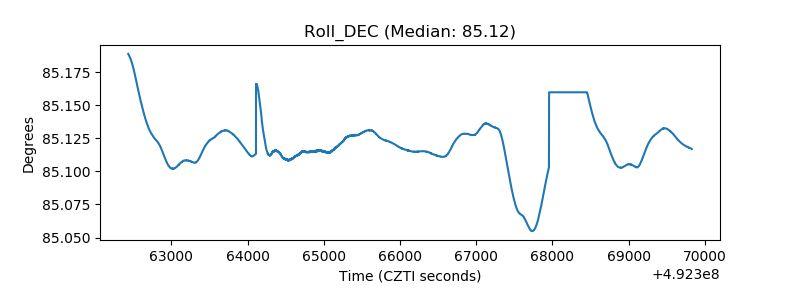 |
| _Roll_RA | 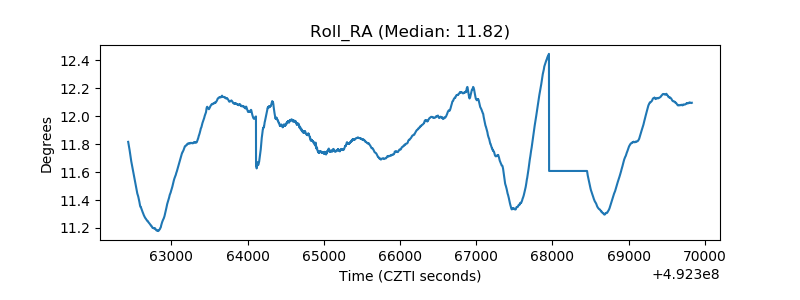 |
| Veto Counter | 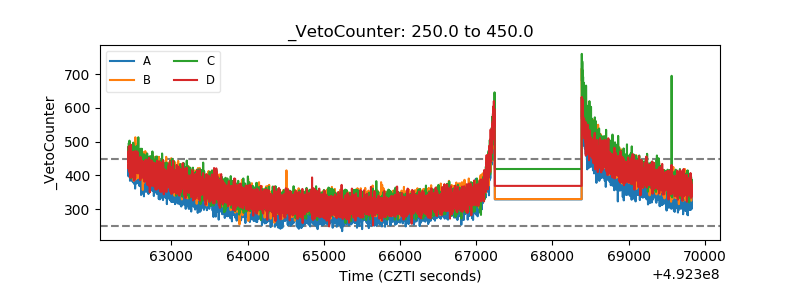 |