| Param | Original file | Final file |
|---|---|---|
| Filename | modeM0/AS1C09_011T08_9000006492_53354cztM0_level2.fits | modeM0/AS1C09_011T08_9000006492_53354cztM0_level2_quad_clean.evt |
| Size (bytes) | 845,634,240 | 72,365,760 |
| Size | 806.5 MB | 69.0 MB |
| Events in quadrant A | 5,553,349 | 547,389 |
| Events in quadrant B | 4,720,418 | 654,916 |
| Events in quadrant C | 12,932,693 | 197,423 |
| Events in quadrant D | 7,605,953 | 349,756 |
| Mode M0 | |||
|---|---|---|---|
| Quadrant | BADHDUFLAG | Total packets | Discarded packets |
| A | 0 | 20937 | 1 |
| B | 0 | 18450 | 1 |
| C | 0 | 42737 | 1 |
| D | 0 | 27184 | 2 |
| Mode M9 | |||
|---|---|---|---|
| Quadrant | BADHDUFLAG | Total packets | Discarded packets |
| A | 0 | 11 | 0 |
| B | 0 | 11 | 0 |
| C | 0 | 11 | 0 |
| D | 0 | 11 | 0 |
| Mode SS | |||
|---|---|---|---|
| Quadrant | BADHDUFLAG | Total packets | Discarded packets |
| A | 0 | 130 | 0 |
| B | 0 | 130 | 0 |
| C | 0 | 130 | 0 |
| D | 0 | 130 | 0 |
| Quadrant | Total seconds | Saturated seconds | Saturation percentage |
|---|---|---|---|
| A | 6321 | 1119 | 17.702895% |
| B | 6321 | 464 | 7.340611% |
| C | 6321 | 4551 | 71.998102% |
| D | 6320 | 2608 | 41.265823% |
Noise dominated data is calculated using 1-second bins in cleaned event files. If a bin has >2000 counts, and if more than 50% of those come from <1% of pixels, then it is considered to be noise-dominated and hence unusable.
| Quadrant | # 1 sec bins | Bins with >0 counts | Bins with >2000 counts | High rate bins dominated by noise | Noise dominated (total time) | Noise dominated (detector-on time) | Marked lightcurve |
|---|---|---|---|---|---|---|---|
| A | 7495 | 6320 | 1002 | 1002 | 13.37% | 15.85% | 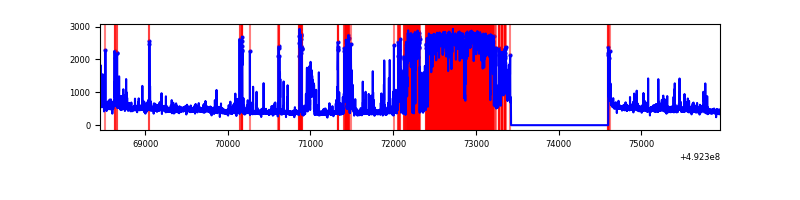 |
| B | 7495 | 6320 | 282 | 282 | 3.76% | 4.46% | 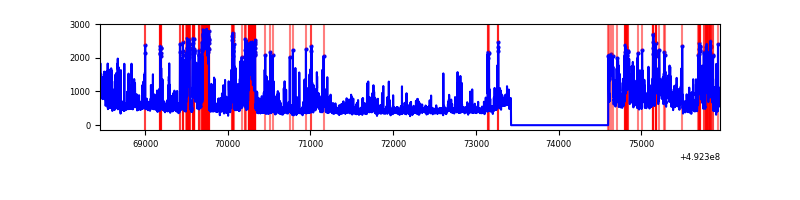 |
| C | 7495 | 6320 | 4346 | 4346 | 57.99% | 68.77% | 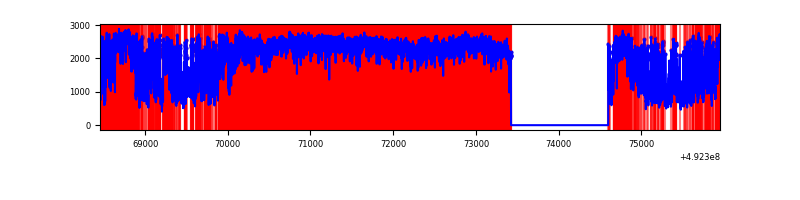 |
| D | 7495 | 6320 | 1418 | 1418 | 18.92% | 22.44% | 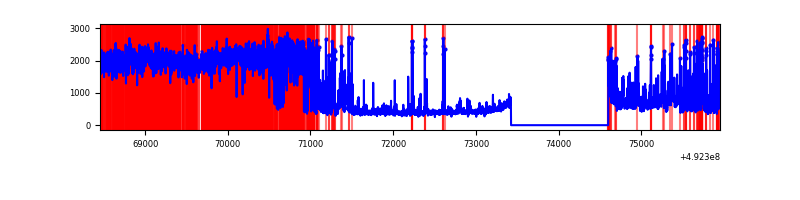 |
Top three noisy pixels from each quadrant. If the there are fewer than three noisy pixels in the level2.evt file, extra rows are filled as -1
| Pixel properties | Quadrant properties | ||||||
|---|---|---|---|---|---|---|---|
| Quadrant | DetID | PixID | Counts | Sigma | Mean | Median | Sigma |
| A | 15 | 174 | 2562140 | 16429.07 | 628 | 614 | 155.9 |
| A | 3 | 62 | 153293 | 979.25 | 628 | 614 | 155.9 |
| A | 3 | 30 | 60634 | 384.96 | 628 | 614 | 155.9 |
| B | 4 | 206 | 600880 | 4236.42 | 669 | 647 | 141.7 |
| B | 0 | 171 | 382070 | 2692.07 | 669 | 647 | 141.7 |
| B | 5 | 185 | 277095 | 1951.16 | 669 | 647 | 141.7 |
| C | 15 | 178 | 5575996 | 51247.14 | 394 | 391 | 108.8 |
| C | 15 | 158 | 2665684 | 24497.55 | 394 | 391 | 108.8 |
| C | 15 | 224 | 1542503 | 14174.04 | 394 | 391 | 108.8 |
| D | 2 | 62 | 4539706 | 34745.19 | 456 | 434 | 130.6 |
| D | 6 | 239 | 809975 | 6196.51 | 456 | 434 | 130.6 |
| D | 11 | 245 | 132150 | 1008.2 | 456 | 434 | 130.6 |
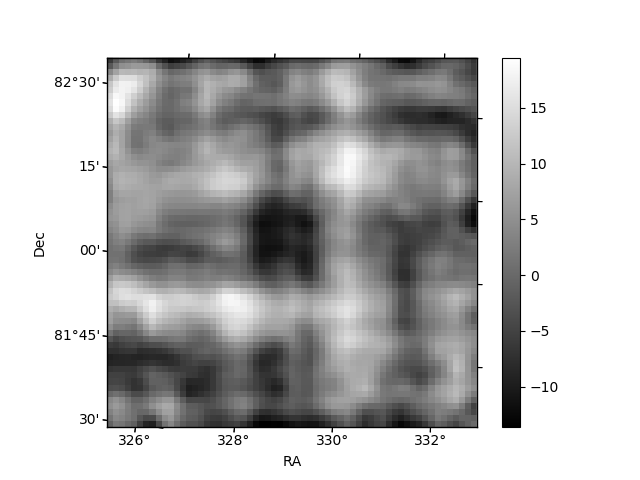
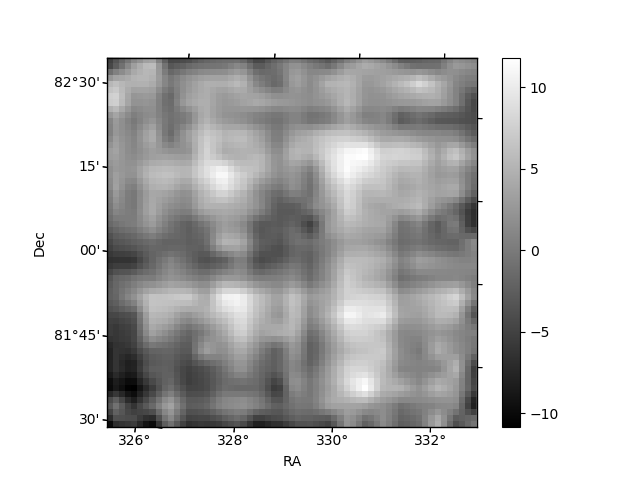
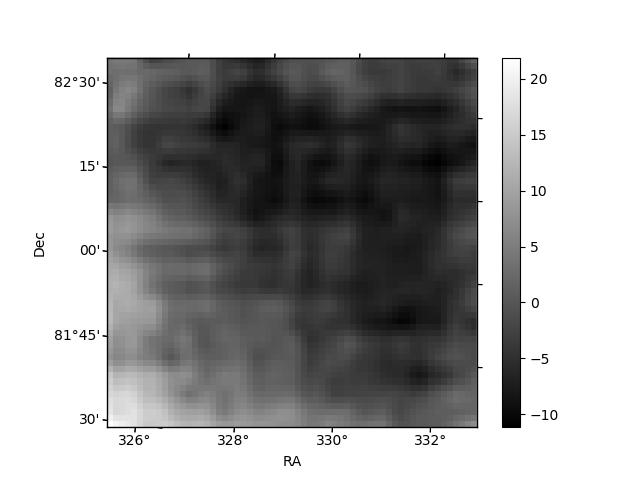
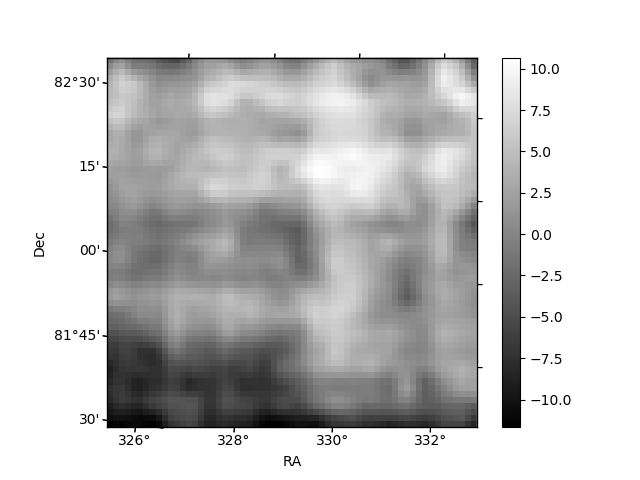
Histogram calculated using DETX and DETY for each event in the final _common_clean file
| Quadrant A | 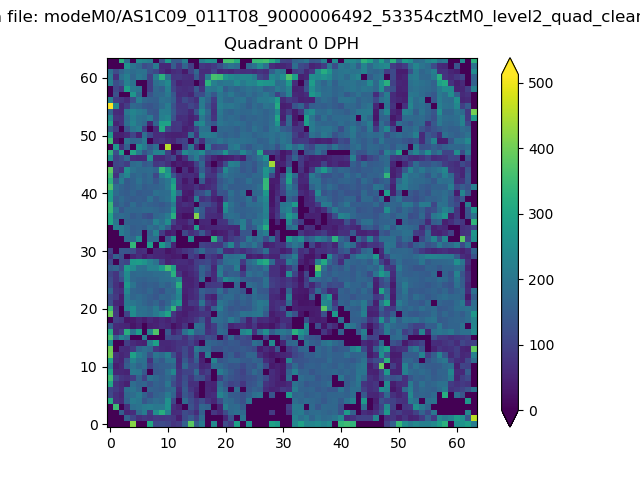 |
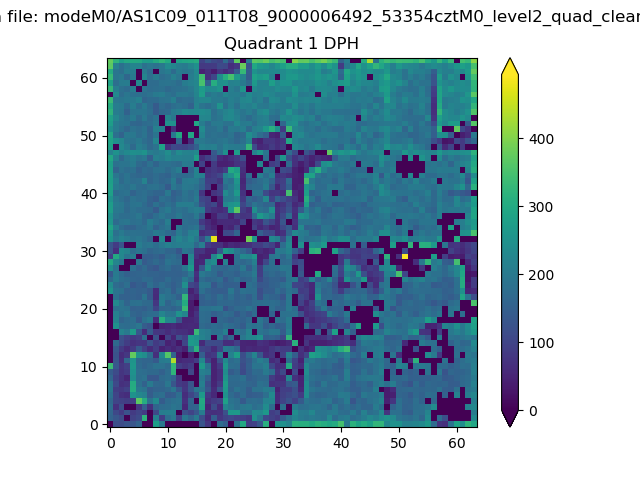 |
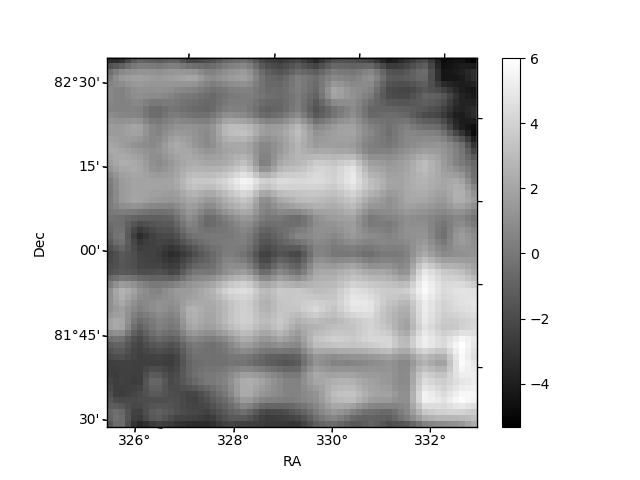
Quadrant B |
|---|---|---|---|
| Quadrant D | 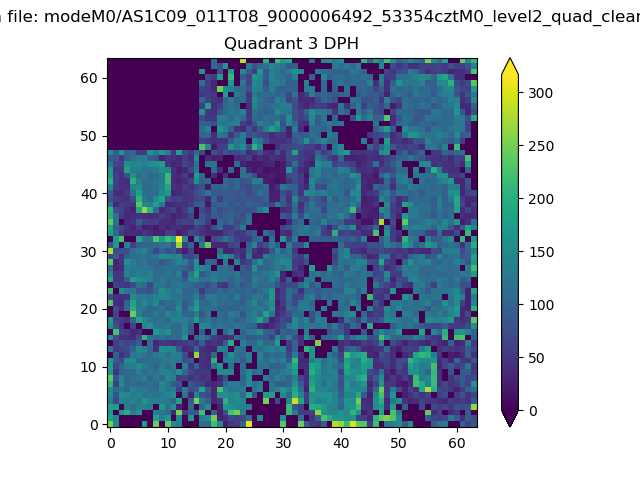 |
 |
Quadrant C |
| Plot type | Count rate plots | Images |
|---|---|---|
| Comparison with Poisson distribution Blue bars denote a histogram of data divided into 1 sec bins. Red curve is a Poisson curve with rate = median count rate of data. |
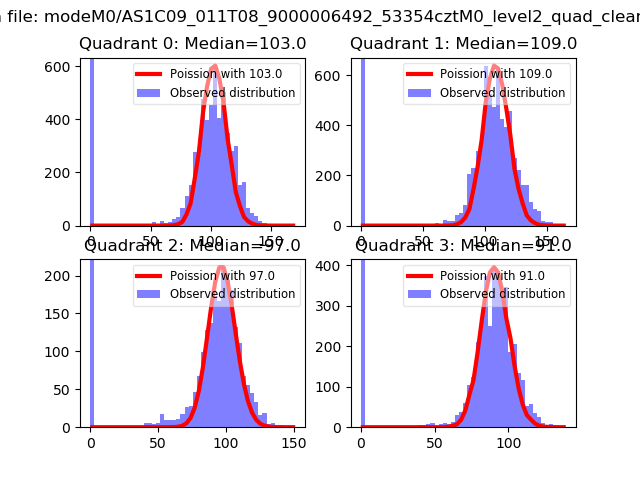 |
 |
| Quadrant-wise count rates Data is divided into 100 sec bins |
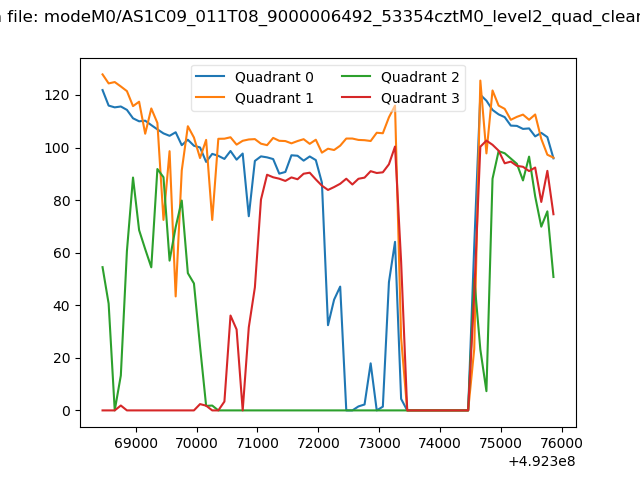 |
|
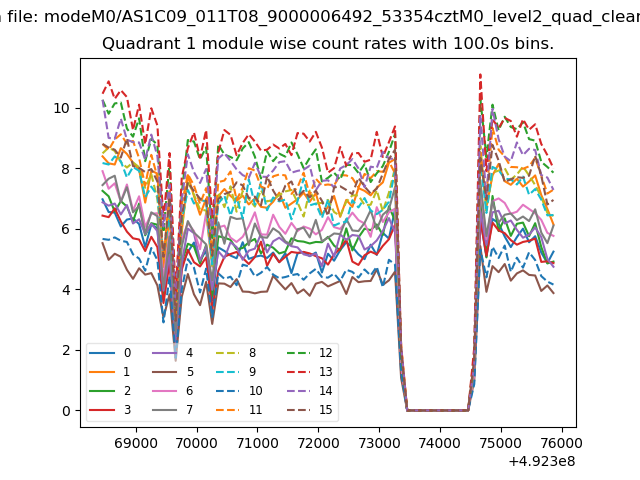
| Module-wise count rates for Quadrant A Data is divided into 100 sec bins |
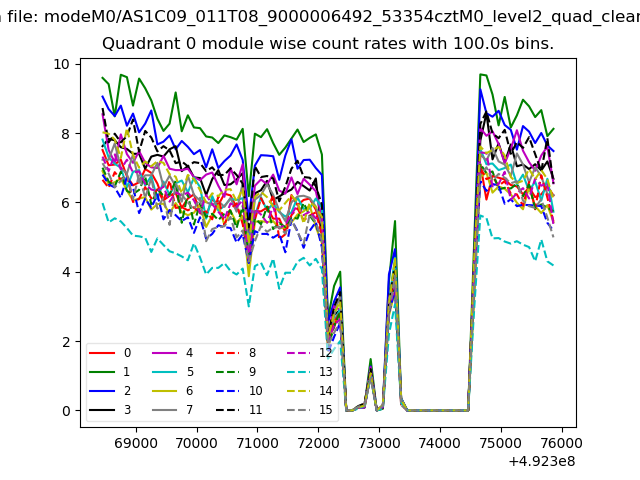 |
 |
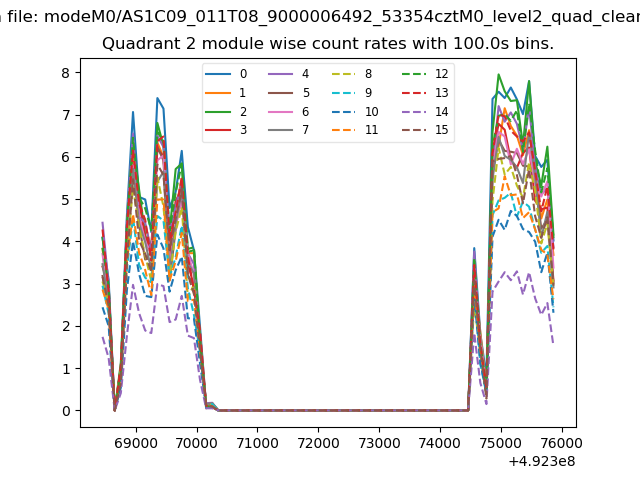
| Module-wise count rates for Quadrant B Data is divided into 100 sec bins |
 |
 |
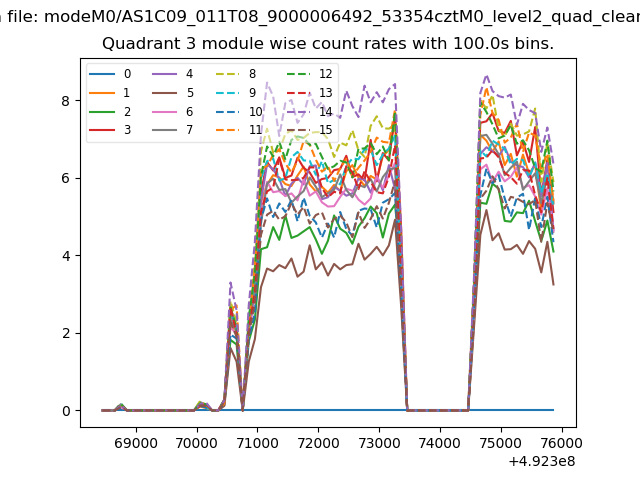
| Module-wise count rates for Quadrant C Data is divided into 100 sec bins |
 |
 |
| Module-wise count rates for Quadrant D Data is divided into 100 sec bins |
 |
 |
| Parameter | Plot |
|---|---|
| CZT HV Monitor | 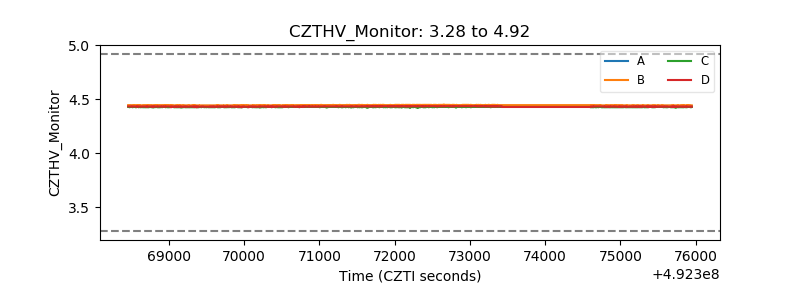 |
| D_VDD | 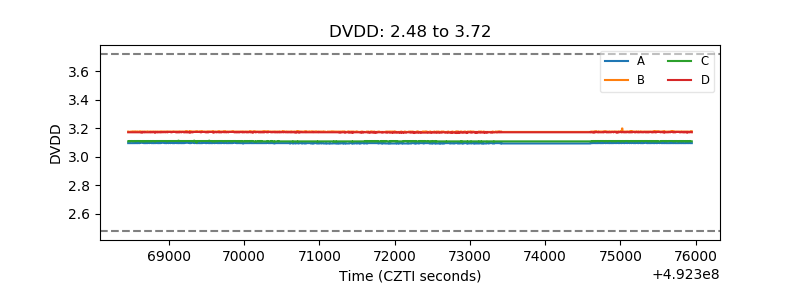 |
| Temperature 1 | 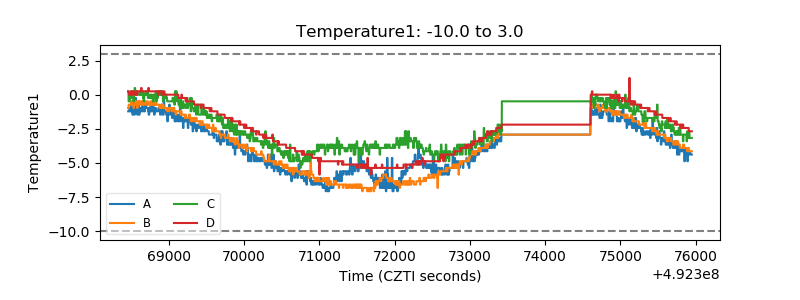 |
| Veto HV Monitor | 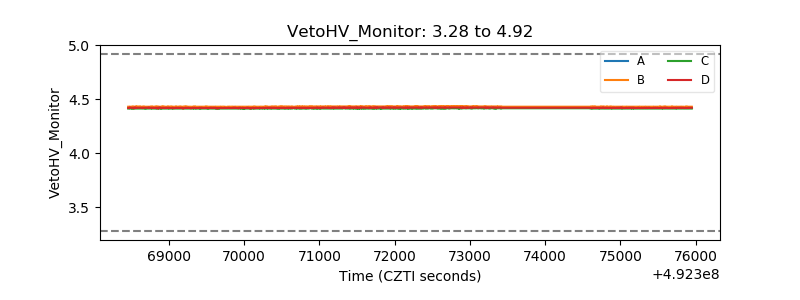 |
| Veto LLD | 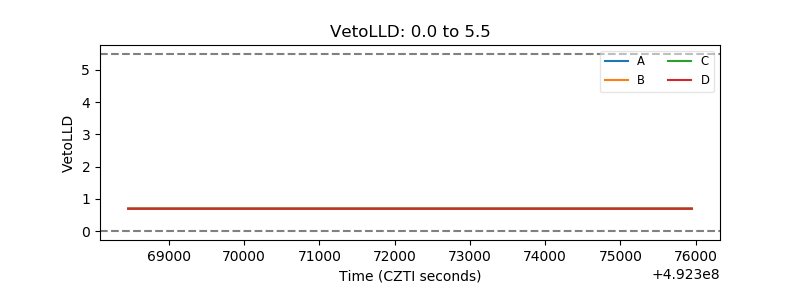 |
| Alpha Counter |  |
| _CPM_Rate | 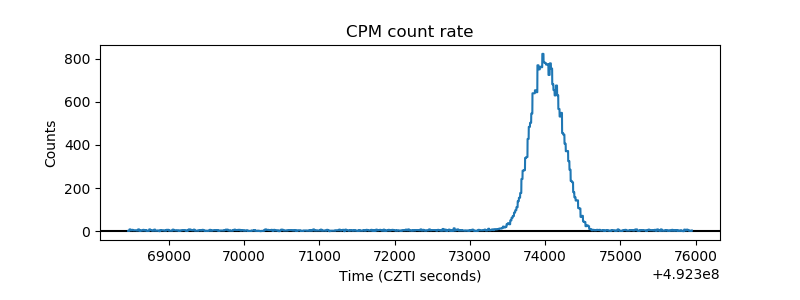 |
| CZT Counter | 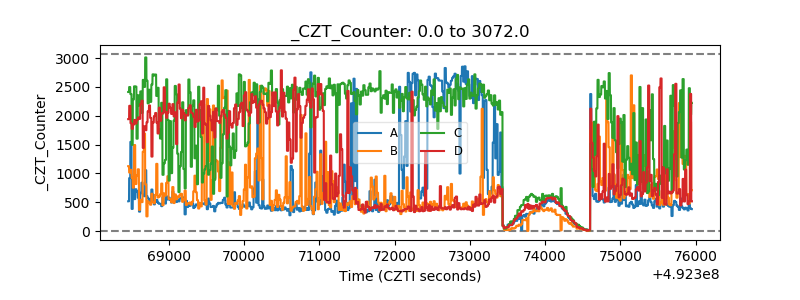 |
| +2.5 Volts monitor |  |
| +5 Volts monitor |  |
| _ROLL_ROT | 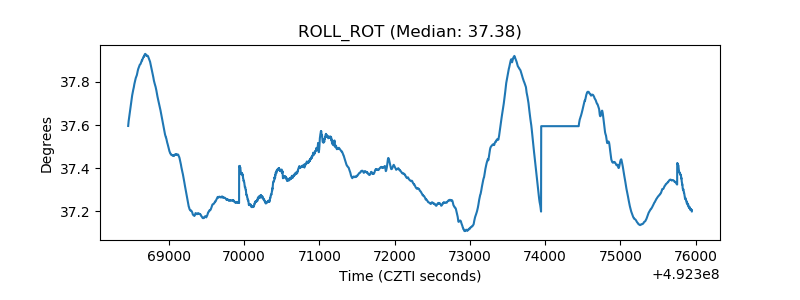 |
| _Roll_DEC | 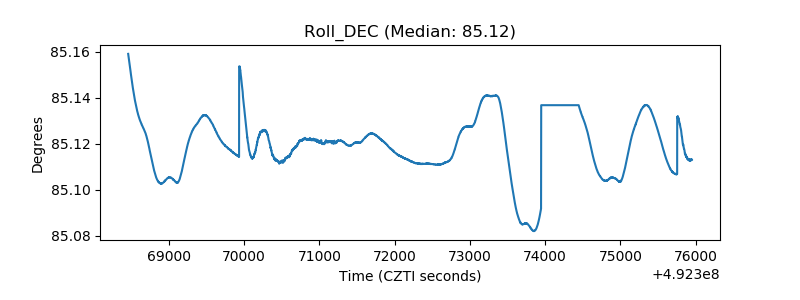 |
| _Roll_RA | 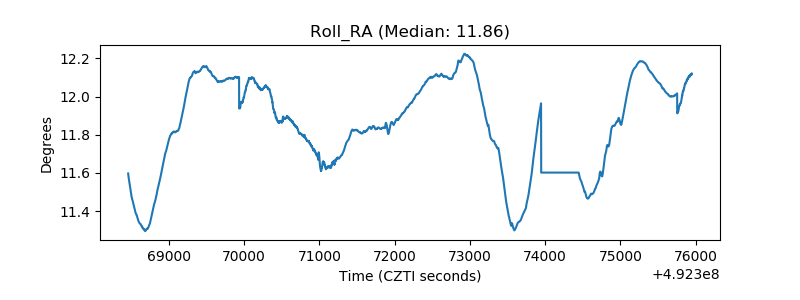 |
| Veto Counter | 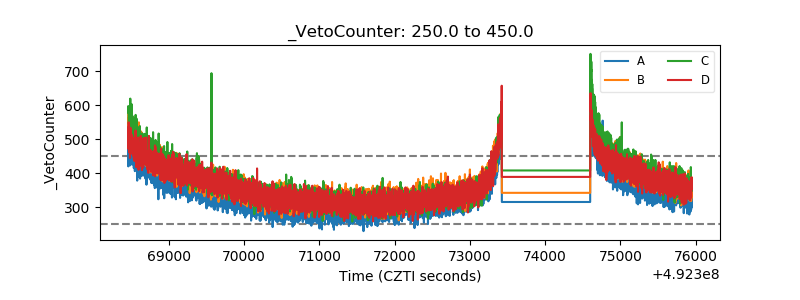 |