| Param | Original file | Final file |
|---|---|---|
| Filename | modeM0/AS1C09_011T08_9000006492_53355cztM0_level2.fits | modeM0/AS1C09_011T08_9000006492_53355cztM0_level2_quad_clean.evt |
| Size (bytes) | 752,944,320 | 79,182,720 |
| Size | 718.1 MB | 75.5 MB |
| Events in quadrant A | 3,470,307 | 629,080 |
| Events in quadrant B | 4,908,621 | 646,016 |
| Events in quadrant C | 14,415,643 | 116,831 |
| Events in quadrant D | 4,582,539 | 561,293 |
| Mode M0 | |||
|---|---|---|---|
| Quadrant | BADHDUFLAG | Total packets | Discarded packets |
| A | 0 | 14975 | 2 |
| B | 0 | 19172 | 2 |
| C | 0 | 47109 | 2 |
| D | 0 | 18252 | 2 |
| Mode M9 | |||
|---|---|---|---|
| Quadrant | BADHDUFLAG | Total packets | Discarded packets |
| A | 0 | 12 | 0 |
| B | 0 | 12 | 0 |
| C | 0 | 13 | 0 |
| D | 0 | 13 | 0 |
| Mode SS | |||
|---|---|---|---|
| Quadrant | BADHDUFLAG | Total packets | Discarded packets |
| A | 0 | 130 | 0 |
| B | 0 | 130 | 0 |
| C | 0 | 130 | 0 |
| D | 0 | 130 | 0 |
| Quadrant | Total seconds | Saturated seconds | Saturation percentage |
|---|---|---|---|
| A | 6364 | 182 | 2.859837% |
| B | 6364 | 522 | 8.202388% |
| C | 6364 | 5322 | 83.626650% |
| D | 6364 | 333 | 5.232558% |
Noise dominated data is calculated using 1-second bins in cleaned event files. If a bin has >2000 counts, and if more than 50% of those come from <1% of pixels, then it is considered to be noise-dominated and hence unusable.
| Quadrant | # 1 sec bins | Bins with >0 counts | Bins with >2000 counts | High rate bins dominated by noise | Noise dominated (total time) | Noise dominated (detector-on time) | Marked lightcurve |
|---|---|---|---|---|---|---|---|
| A | 7528 | 6364 | 100 | 100 | 1.33% | 1.57% | 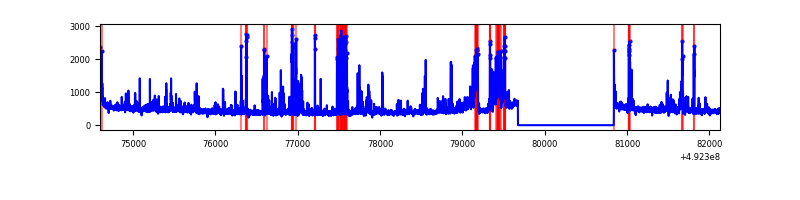 |
| B | 7528 | 6364 | 283 | 283 | 3.76% | 4.45% | 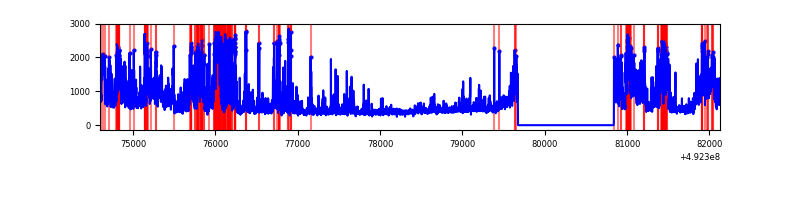 |
| C | 7528 | 6364 | 5193 | 5193 | 68.98% | 81.60% | 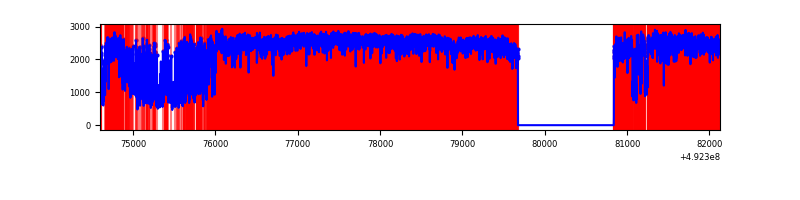 |
| D | 7528 | 6364 | 302 | 302 | 4.01% | 4.75% | 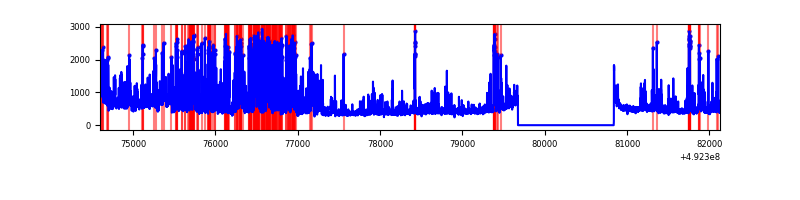 |
Top three noisy pixels from each quadrant. If the there are fewer than three noisy pixels in the level2.evt file, extra rows are filled as -1
| Pixel properties | Quadrant properties | ||||||
|---|---|---|---|---|---|---|---|
| Quadrant | DetID | PixID | Counts | Sigma | Mean | Median | Sigma |
| A | 15 | 174 | 351393 | 2109.26 | 672 | 657 | 166.3 |
| A | 8 | 6 | 234356 | 1405.42 | 672 | 657 | 166.3 |
| A | 0 | 8 | 93509 | 558.4 | 672 | 657 | 166.3 |
| B | 4 | 206 | 1043148 | 7443.48 | 664 | 640 | 140.1 |
| B | 0 | 171 | 365151 | 2602.6 | 664 | 640 | 140.1 |
| B | 4 | 171 | 255117 | 1816.96 | 664 | 640 | 140.1 |
| C | 15 | 178 | 7747183 | 91019.33 | 304 | 301 | 85.1 |
| C | 15 | 158 | 2197572 | 25816.08 | 304 | 301 | 85.1 |
| C | 15 | 224 | 1561699 | 18345.1 | 304 | 301 | 85.1 |
| D | 6 | 239 | 1104566 | 5974.65 | 657 | 629 | 184.8 |
| D | 2 | 62 | 193873 | 1045.86 | 657 | 629 | 184.8 |
| D | 11 | 245 | 175508 | 946.47 | 657 | 629 | 184.8 |
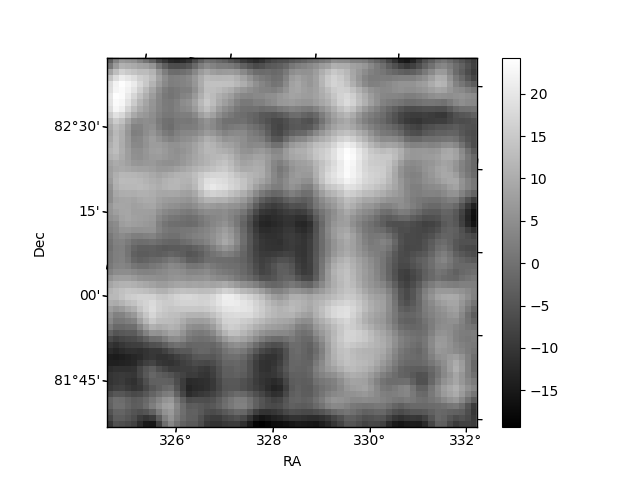
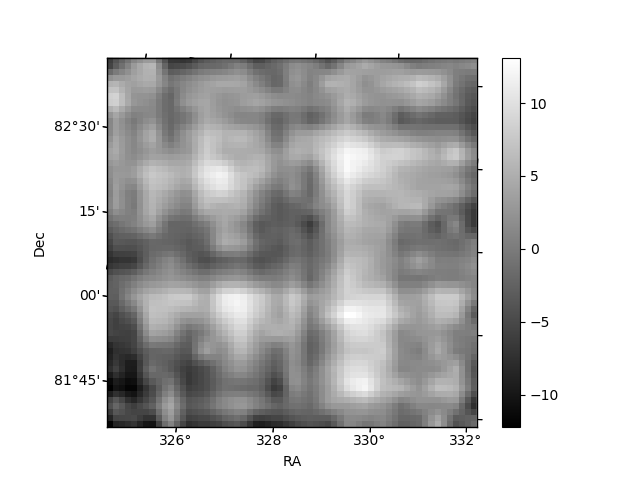
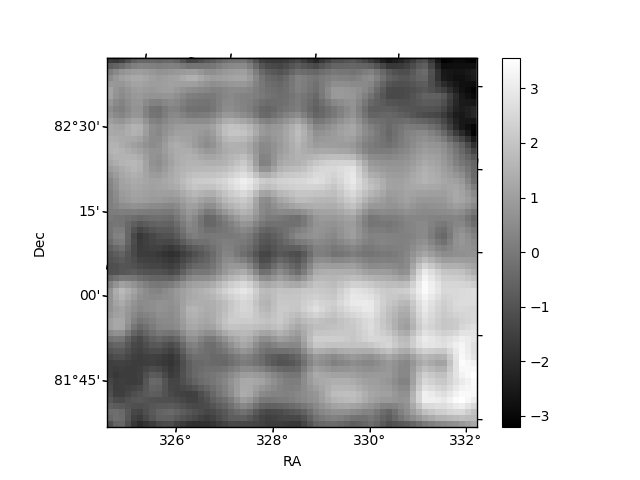
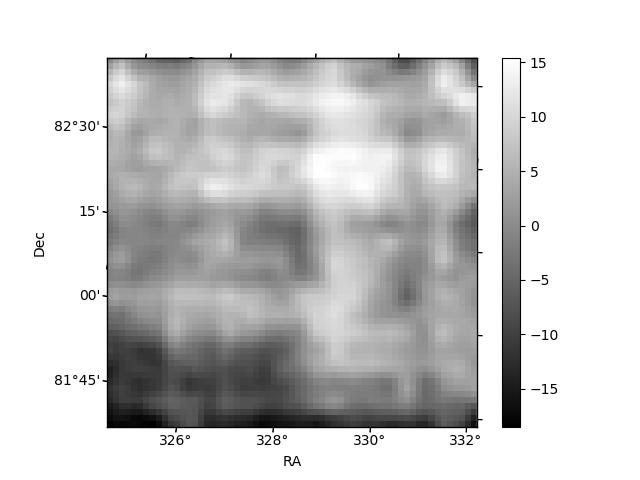
Histogram calculated using DETX and DETY for each event in the final _common_clean file
| Quadrant A | 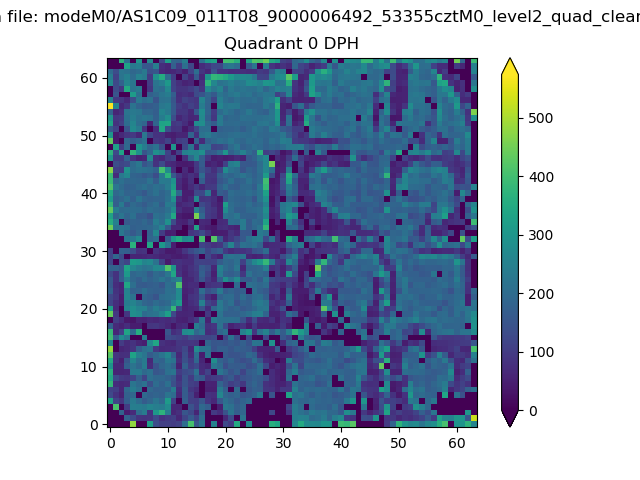 |
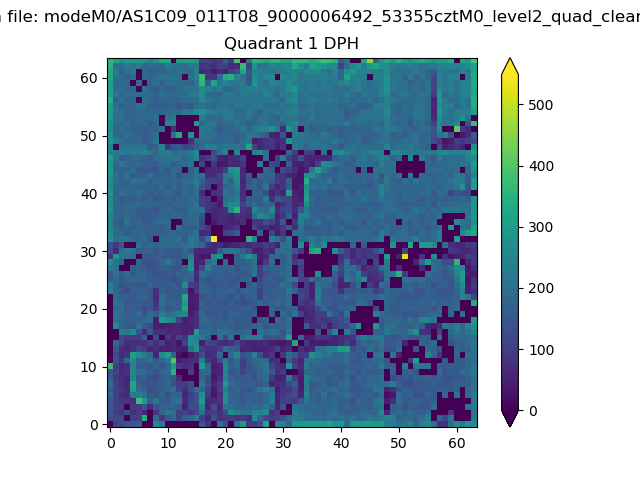 |
Quadrant B |
|---|---|---|---|
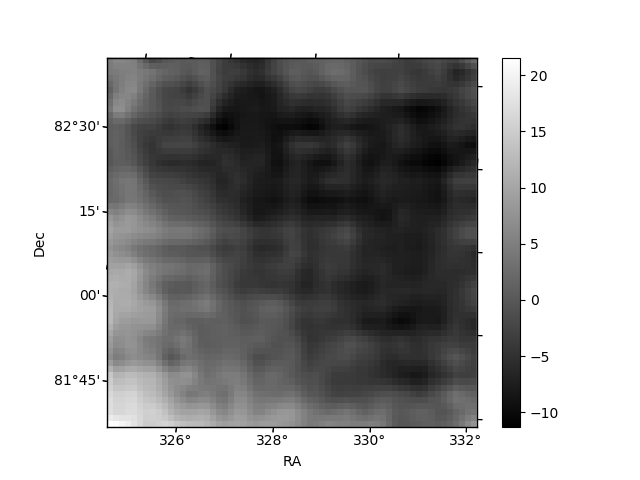
| Quadrant D | 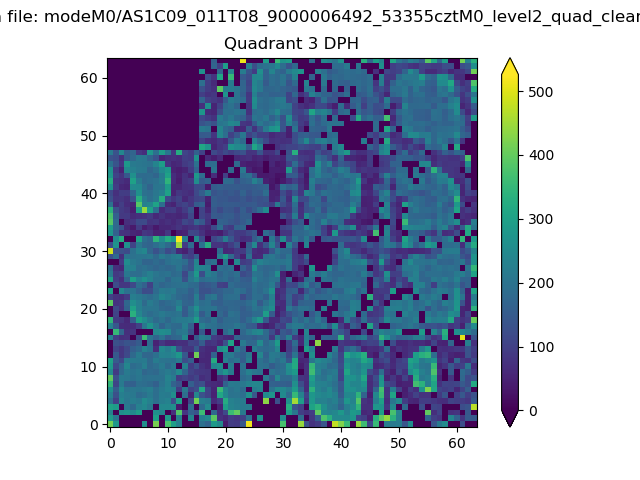 |
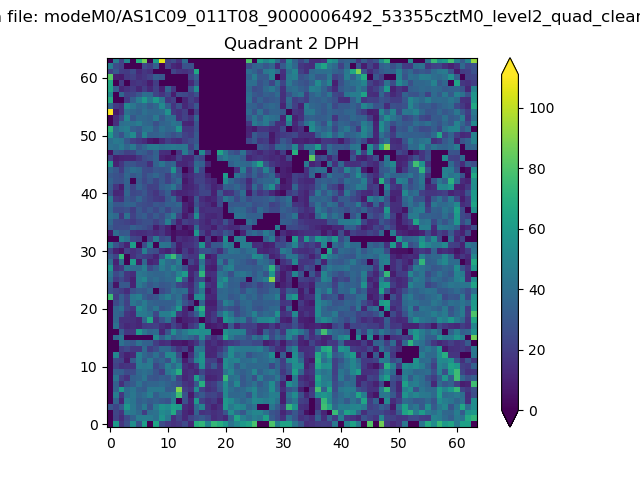 |
Quadrant C |
| Plot type | Count rate plots | Images |
|---|---|---|
| Comparison with Poisson distribution Blue bars denote a histogram of data divided into 1 sec bins. Red curve is a Poisson curve with rate = median count rate of data. |
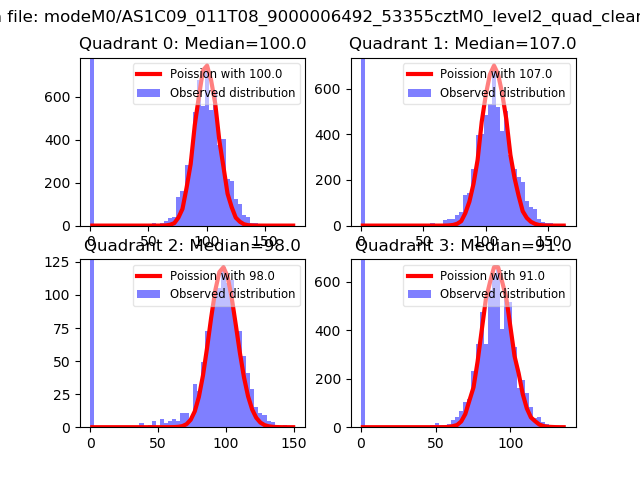 |
 |
| Quadrant-wise count rates Data is divided into 100 sec bins |
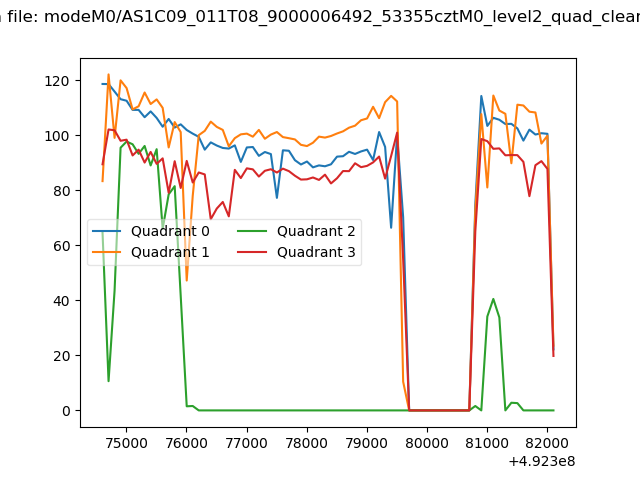 |
|
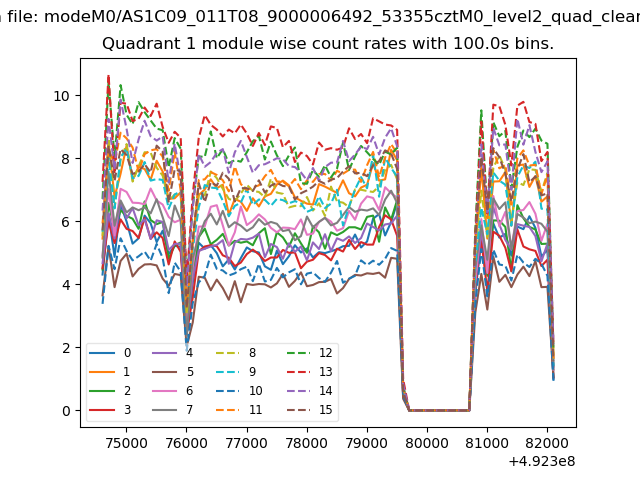
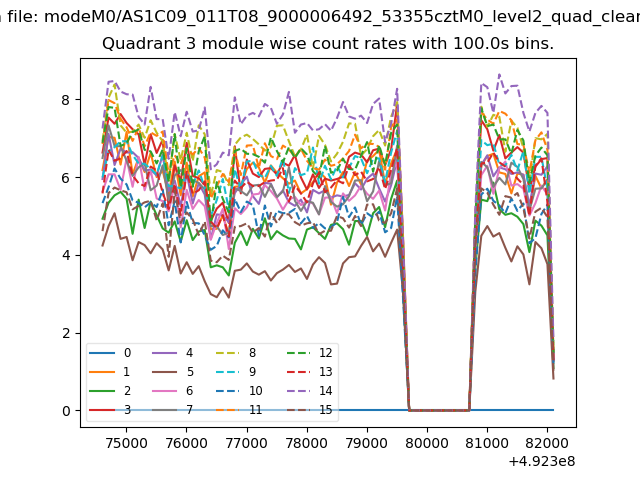
| Module-wise count rates for Quadrant A Data is divided into 100 sec bins |
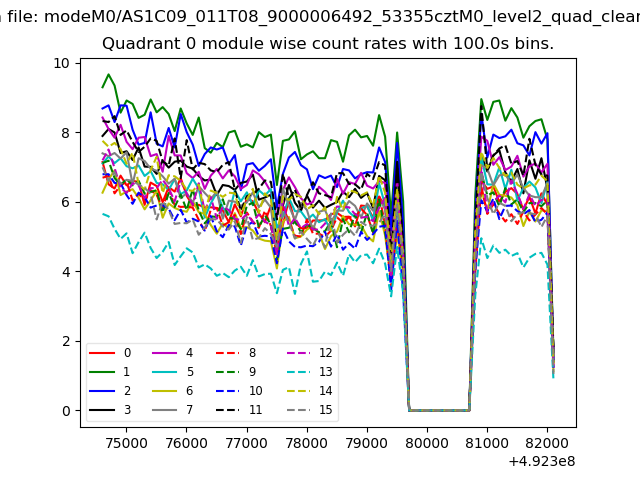 |
 |
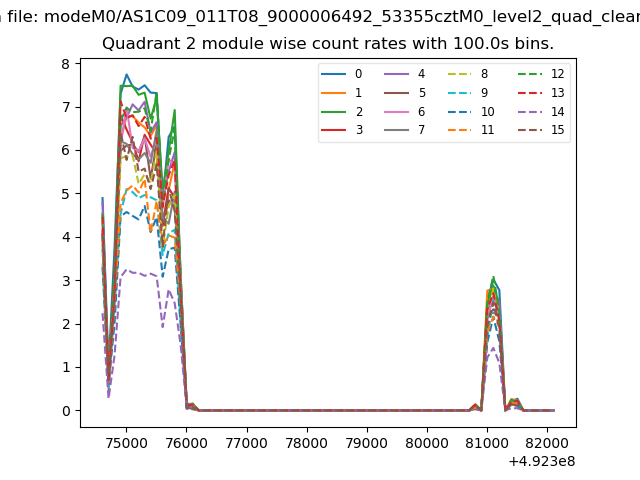
| Module-wise count rates for Quadrant B Data is divided into 100 sec bins |
 |
 |
| Module-wise count rates for Quadrant C Data is divided into 100 sec bins |
 |
 |
| Module-wise count rates for Quadrant D Data is divided into 100 sec bins |
 |
 |
| Parameter | Plot |
|---|---|
| CZT HV Monitor |  |
| D_VDD | 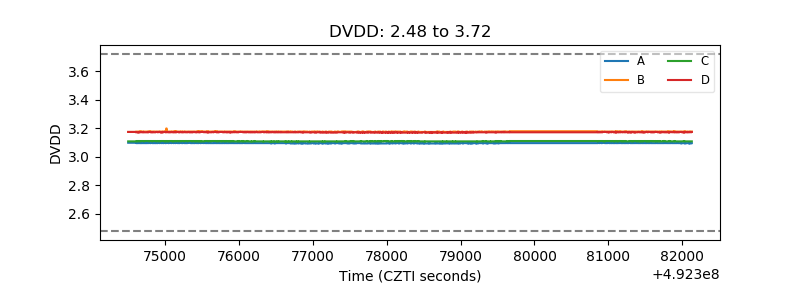 |
| Temperature 1 | 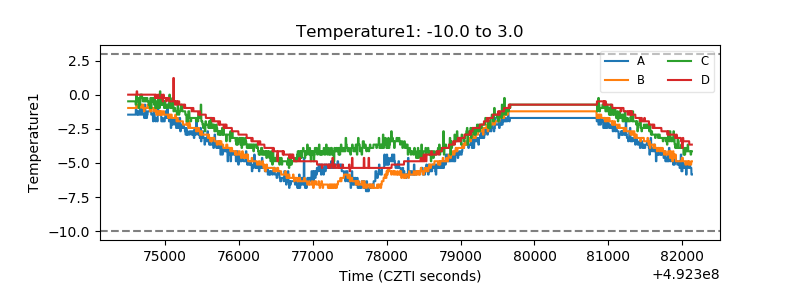 |
| Veto HV Monitor | 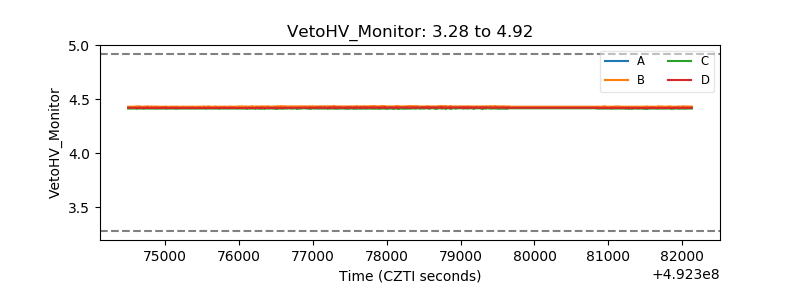 |
| Veto LLD | 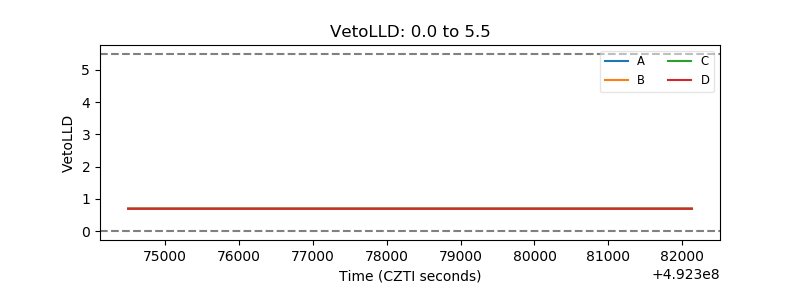 |
| Alpha Counter | 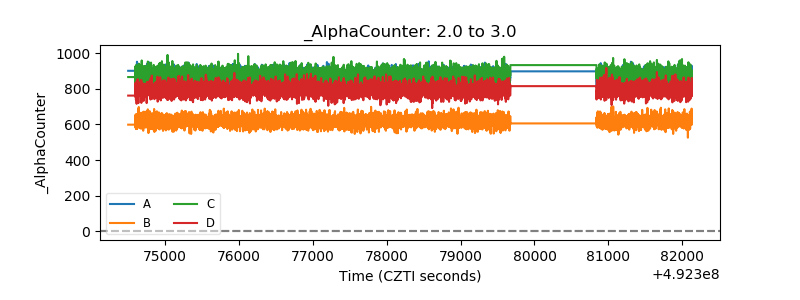 |
| _CPM_Rate | 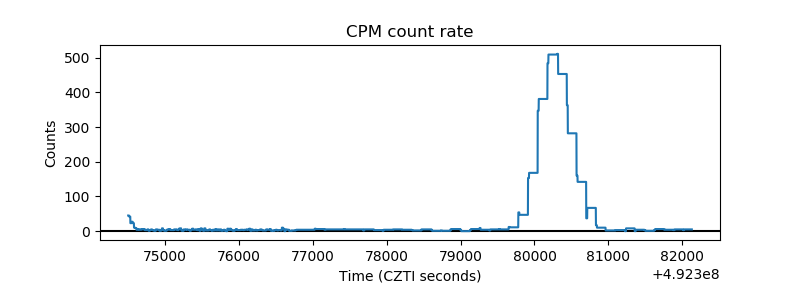 |
| CZT Counter | 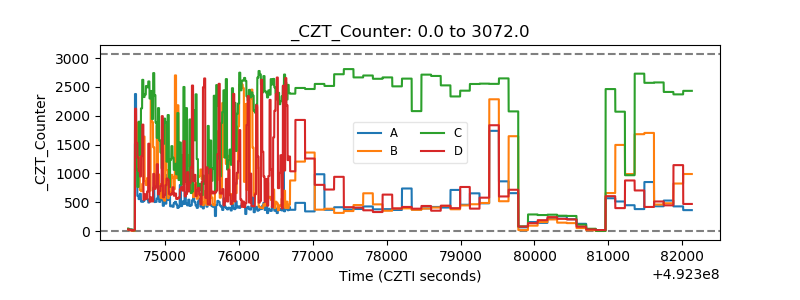 |
| +2.5 Volts monitor | 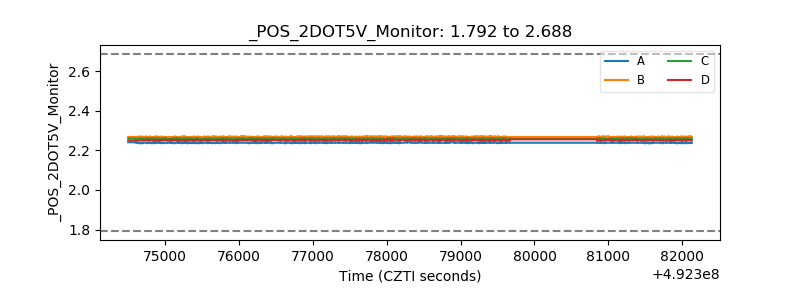 |
| +5 Volts monitor | 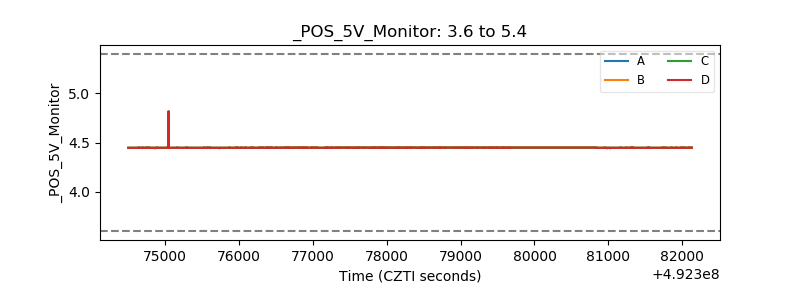 |
| _ROLL_ROT | 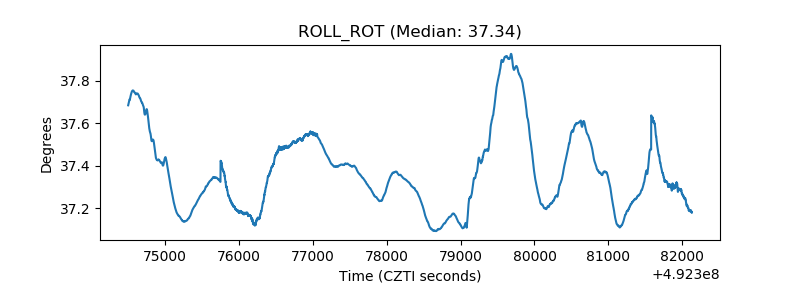 |
| _Roll_DEC | 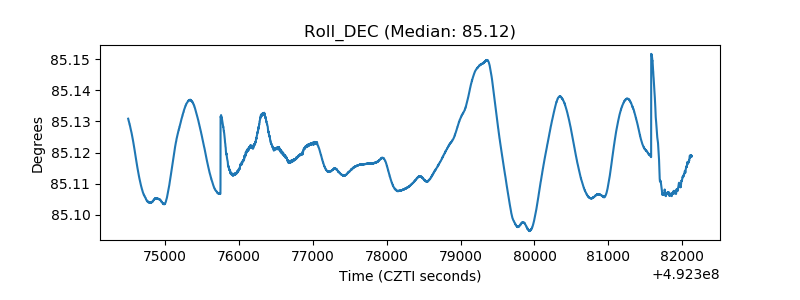 |
| _Roll_RA | 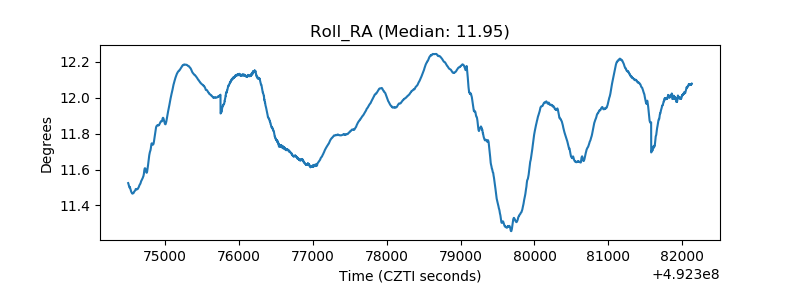 |
| Veto Counter | 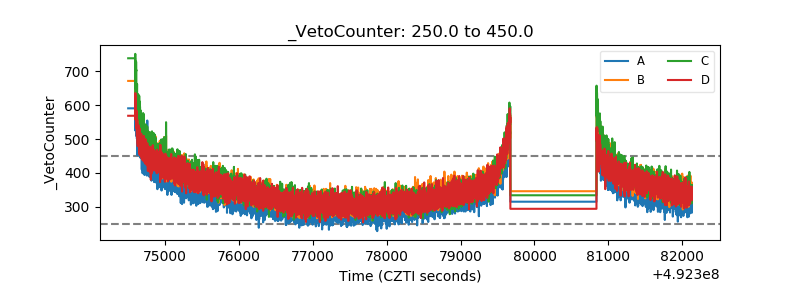 |