| Param | Original file | Final file |
|---|---|---|
| Filename | modeM0/AS1C09_011T08_9000006492_53356cztM0_level2.fits | modeM0/AS1C09_011T08_9000006492_53356cztM0_level2_quad_clean.evt |
| Size (bytes) | 747,495,360 | 79,050,240 |
| Size | 712.9 MB | 75.4 MB |
| Events in quadrant A | 3,791,639 | 630,532 |
| Events in quadrant B | 4,485,880 | 672,054 |
| Events in quadrant C | 15,323,261 | 50,010 |
| Events in quadrant D | 3,556,394 | 581,520 |
| Mode M0 | |||
|---|---|---|---|
| Quadrant | BADHDUFLAG | Total packets | Discarded packets |
| A | 0 | 16142 | 2 |
| B | 0 | 18088 | 2 |
| C | 0 | 49918 | 2 |
| D | 0 | 15430 | 2 |
| Mode M9 | |||
|---|---|---|---|
| Quadrant | BADHDUFLAG | Total packets | Discarded packets |
| A | 0 | 10 | 0 |
| B | 0 | 10 | 0 |
| C | 0 | 10 | 0 |
| D | 0 | 10 | 0 |
| Mode SS | |||
|---|---|---|---|
| Quadrant | BADHDUFLAG | Total packets | Discarded packets |
| A | 0 | 134 | 0 |
| B | 0 | 134 | 0 |
| C | 0 | 134 | 0 |
| D | 0 | 134 | 0 |
| Quadrant | Total seconds | Saturated seconds | Saturation percentage |
|---|---|---|---|
| A | 6585 | 233 | 3.538345% |
| B | 6586 | 330 | 5.010629% |
| C | 6586 | 6171 | 93.698755% |
| D | 6586 | 113 | 1.715761% |
Noise dominated data is calculated using 1-second bins in cleaned event files. If a bin has >2000 counts, and if more than 50% of those come from <1% of pixels, then it is considered to be noise-dominated and hence unusable.
| Quadrant | # 1 sec bins | Bins with >0 counts | Bins with >2000 counts | High rate bins dominated by noise | Noise dominated (total time) | Noise dominated (detector-on time) | Marked lightcurve |
|---|---|---|---|---|---|---|---|
| A | 7600 | 6586 | 204 | 204 | 2.68% | 3.10% | 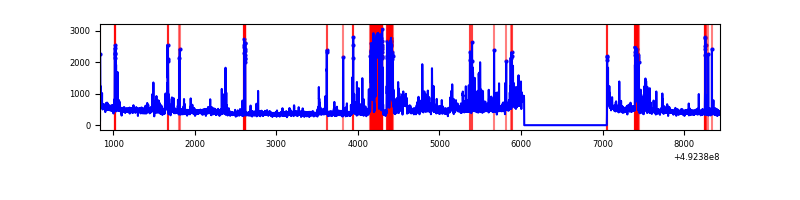 |
| B | 7601 | 6587 | 166 | 166 | 2.18% | 2.52% | 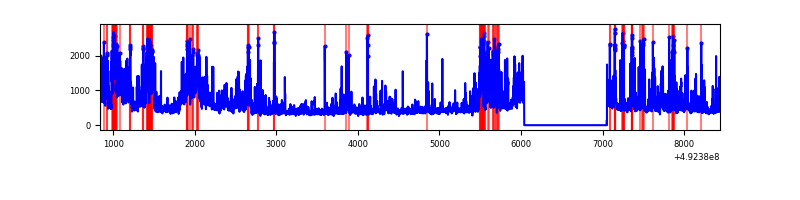 |
| C | 7601 | 6587 | 5834 | 5834 | 76.75% | 88.57% | 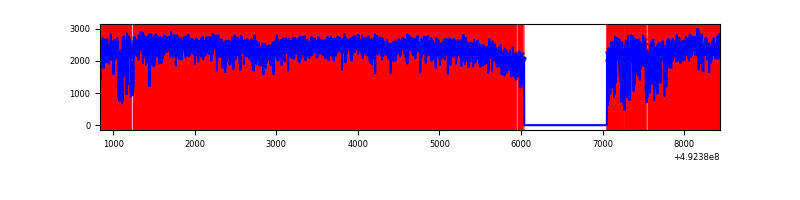 |
| D | 7601 | 6587 | 106 | 106 | 1.39% | 1.61% | 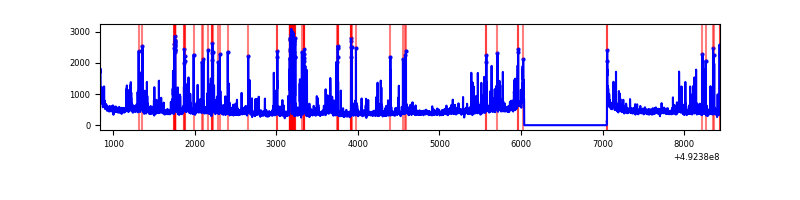 |
Top three noisy pixels from each quadrant. If the there are fewer than three noisy pixels in the level2.evt file, extra rows are filled as -1
| Pixel properties | Quadrant properties | ||||||
|---|---|---|---|---|---|---|---|
| Quadrant | DetID | PixID | Counts | Sigma | Mean | Median | Sigma |
| A | 15 | 174 | 792134 | 4630.97 | 680 | 663 | 170.9 |
| A | 8 | 6 | 122760 | 714.4 | 680 | 663 | 170.9 |
| A | 3 | 14 | 67846 | 393.09 | 680 | 663 | 170.9 |
| B | 4 | 206 | 676945 | 4719.13 | 679 | 659 | 143.3 |
| B | 5 | 185 | 205193 | 1427.24 | 679 | 659 | 143.3 |
| B | 0 | 171 | 196890 | 1369.3 | 679 | 659 | 143.3 |
| C | 15 | 178 | 7071994 | 75147.31 | 339 | 335 | 94.1 |
| C | 15 | 158 | 4965043 | 52757.7 | 339 | 335 | 94.1 |
| C | 15 | 224 | 1397123 | 14843.03 | 339 | 335 | 94.1 |
| D | 3 | 12 | 304695 | 1566.09 | 674 | 644 | 194.1 |
| D | 2 | 249 | 202623 | 1040.34 | 674 | 644 | 194.1 |
| D | 2 | 62 | 80235 | 409.95 | 674 | 644 | 194.1 |
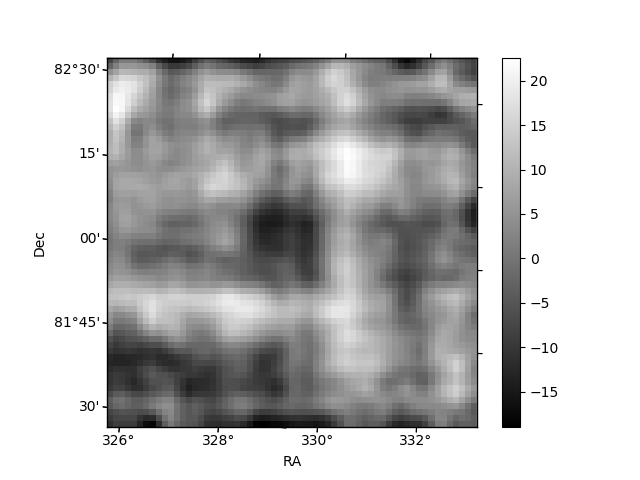
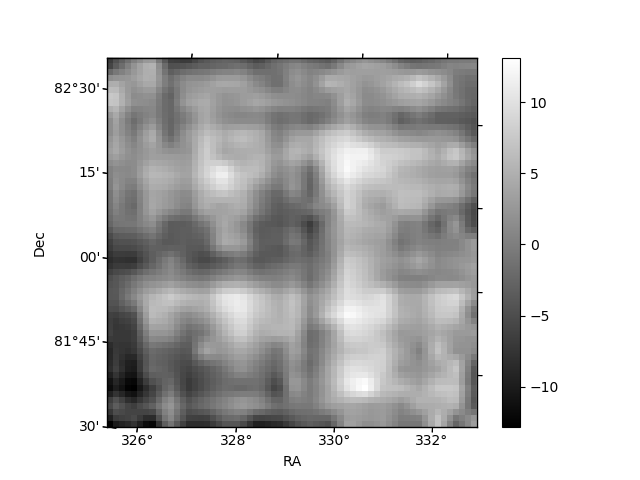
Histogram calculated using DETX and DETY for each event in the final _common_clean file
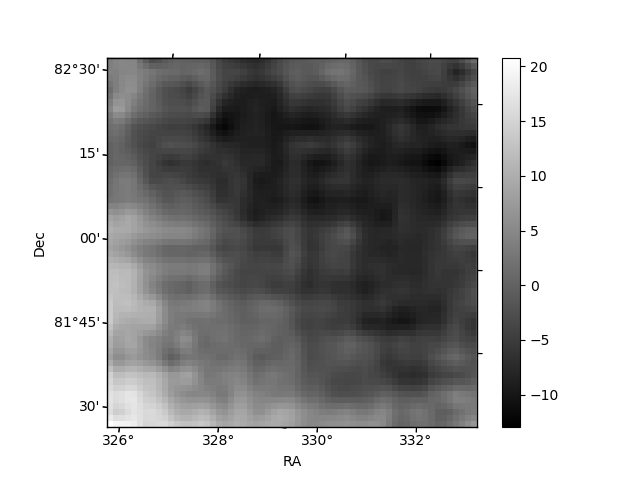
| Quadrant A | 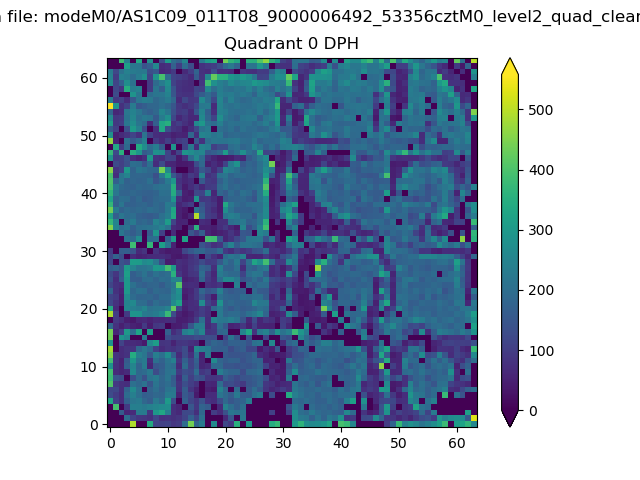 |
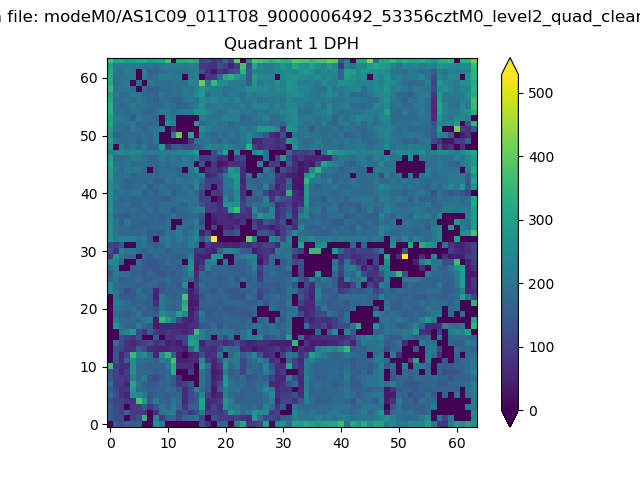 |
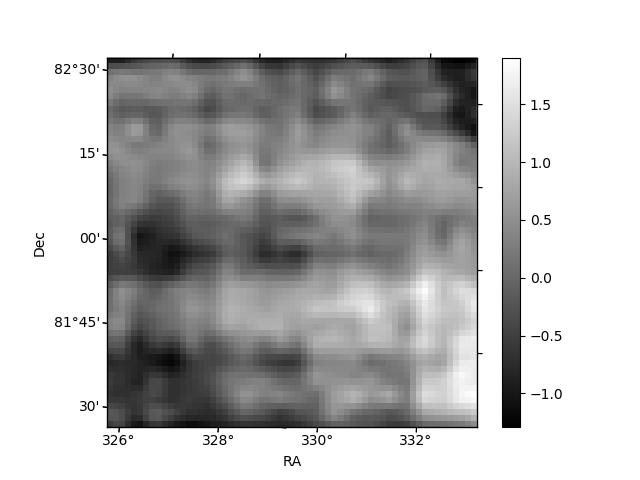
Quadrant B |
|---|---|---|---|
| Quadrant D | 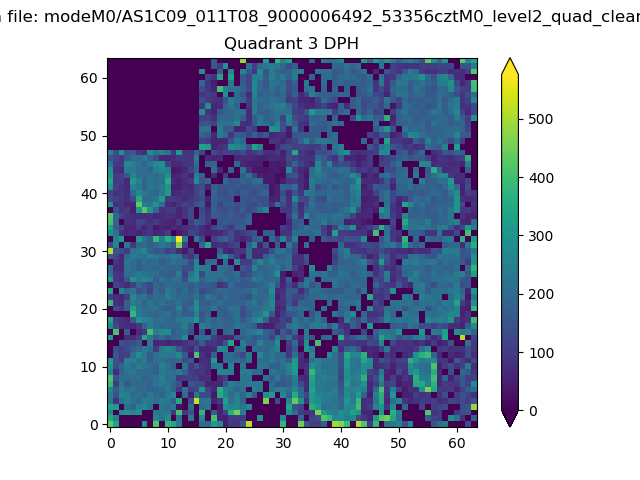 |
 |
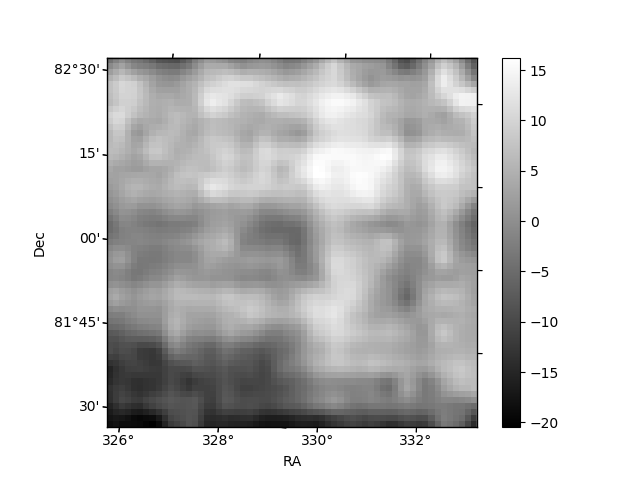
Quadrant C |
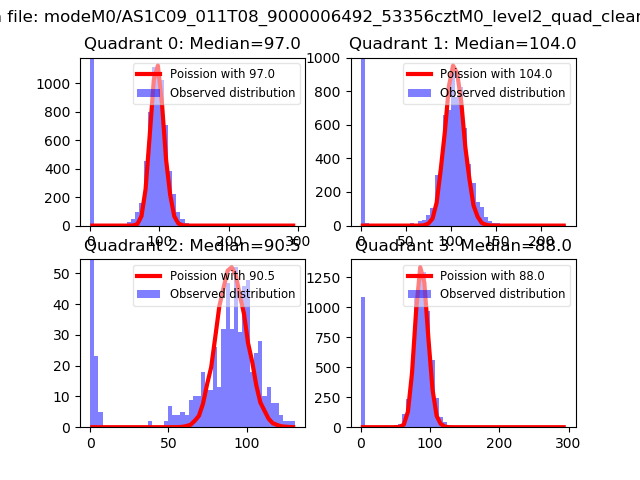
| Plot type | Count rate plots | Images |
|---|---|---|
| Comparison with Poisson distribution Blue bars denote a histogram of data divided into 1 sec bins. Red curve is a Poisson curve with rate = median count rate of data. |
 |
 |
| Quadrant-wise count rates Data is divided into 100 sec bins |
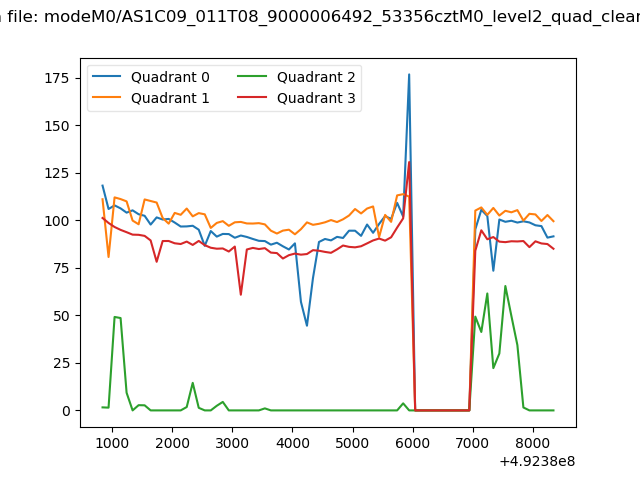 |
|
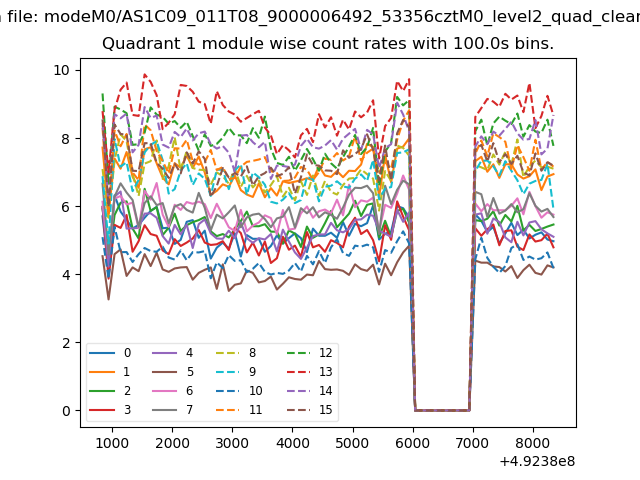
| Module-wise count rates for Quadrant A Data is divided into 100 sec bins |
 |
 |
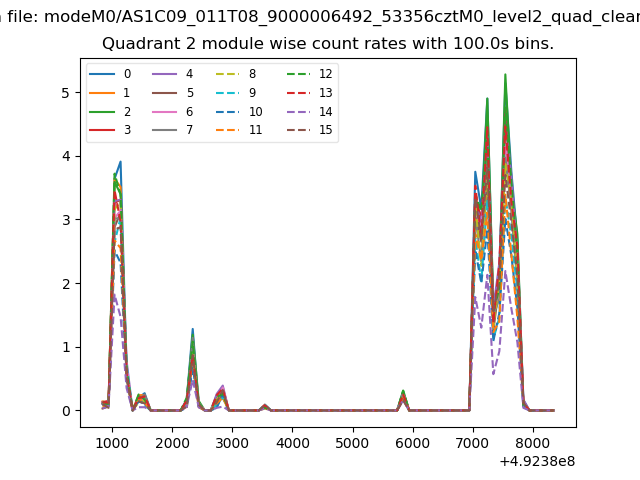
| Module-wise count rates for Quadrant B Data is divided into 100 sec bins |
 |
 |
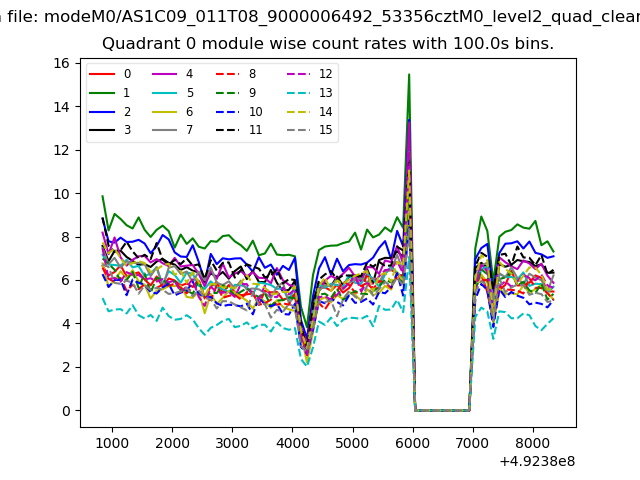
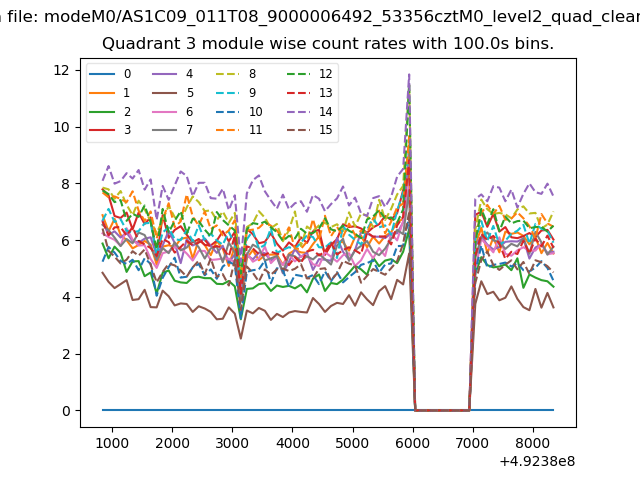
| Module-wise count rates for Quadrant C Data is divided into 100 sec bins |
 |
 |
| Module-wise count rates for Quadrant D Data is divided into 100 sec bins |
 |
 |
| Parameter | Plot |
|---|---|
| CZT HV Monitor | 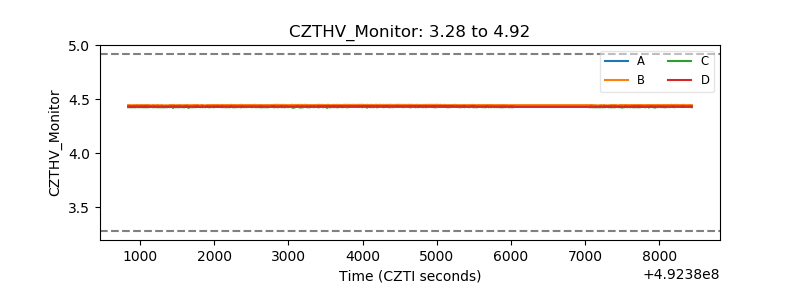 |
| D_VDD | 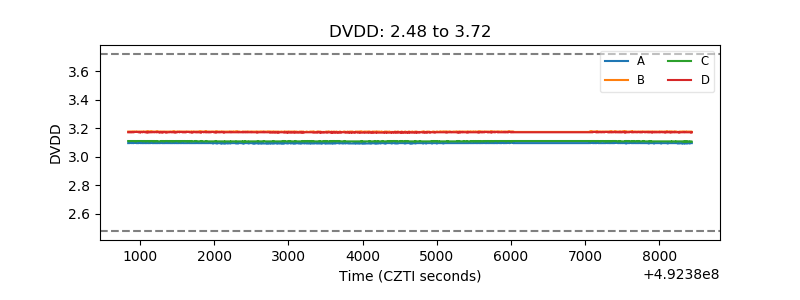 |
| Temperature 1 | 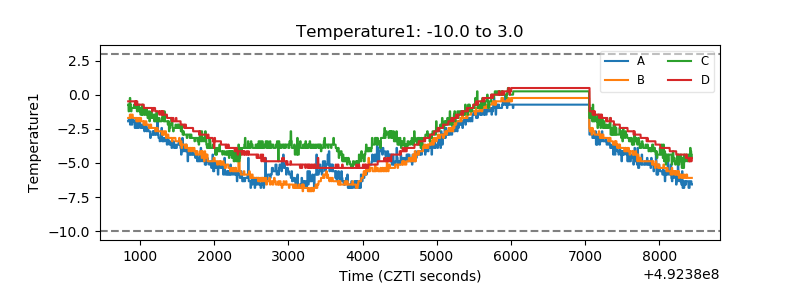 |
| Veto HV Monitor | 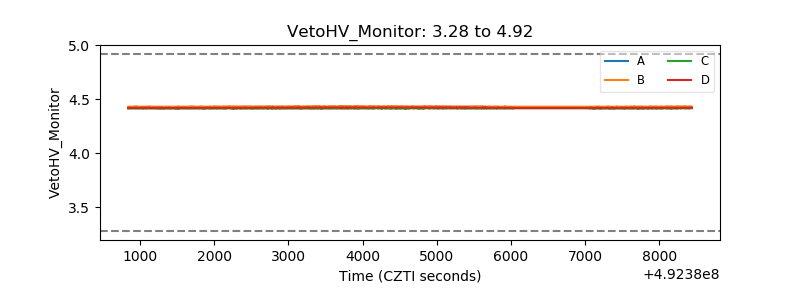 |
| Veto LLD | 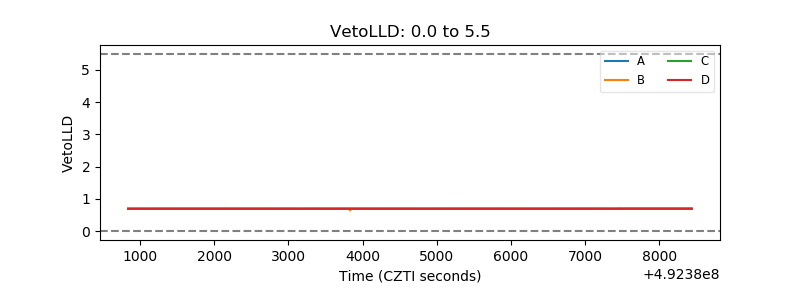 |
| Alpha Counter |  |
| _CPM_Rate | 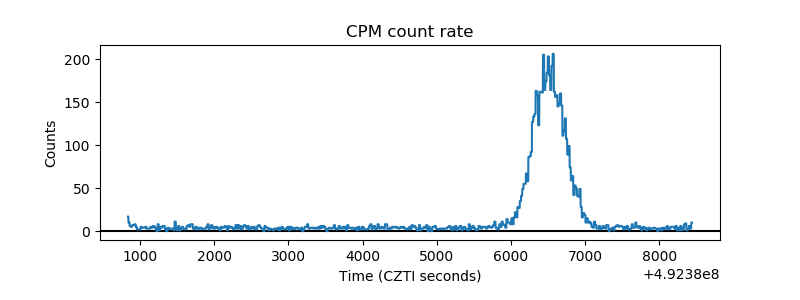 |
| CZT Counter | 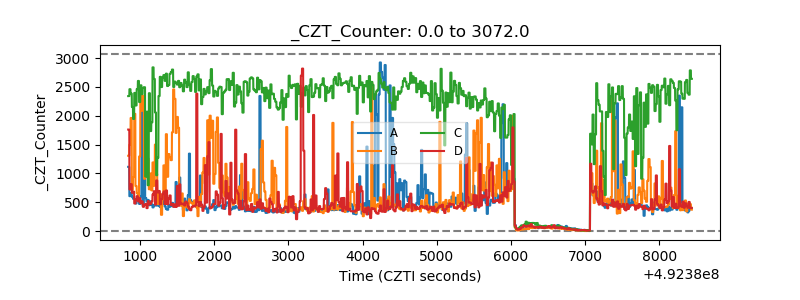 |
| +2.5 Volts monitor |  |
| +5 Volts monitor |  |
| _ROLL_ROT | 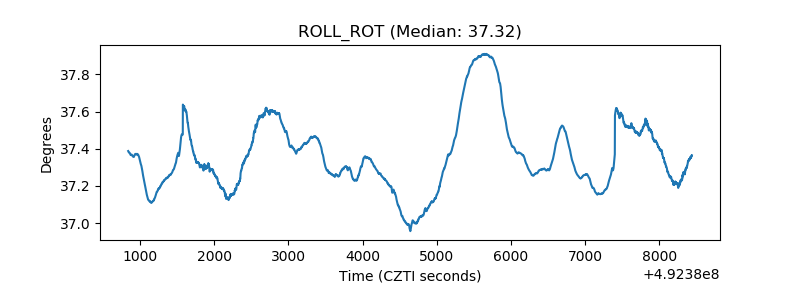 |
| _Roll_DEC | 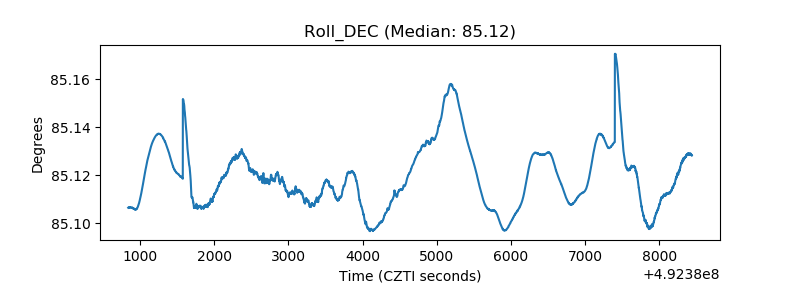 |
| _Roll_RA | 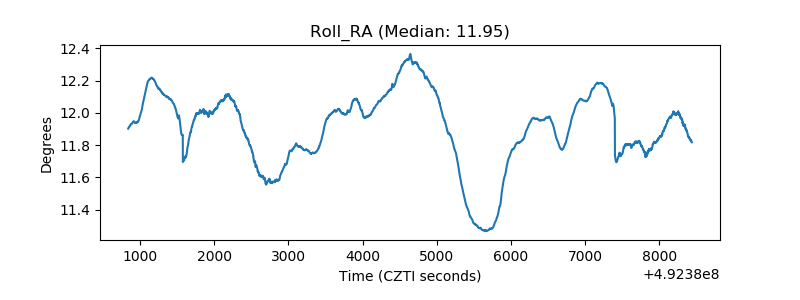 |
| Veto Counter | 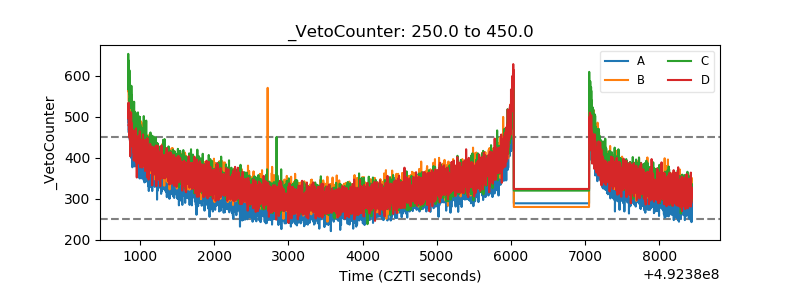 |