| Param | Original file | Final file |
|---|---|---|
| Filename | modeM0/AS1C09_011T08_9000006492_53357cztM0_level2.fits | modeM0/AS1C09_011T08_9000006492_53357cztM0_level2_quad_clean.evt |
| Size (bytes) | 796,132,800 | 84,271,680 |
| Size | 759.3 MB | 80.4 MB |
| Events in quadrant A | 4,762,249 | 645,095 |
| Events in quadrant B | 4,210,964 | 720,211 |
| Events in quadrant C | 16,141,345 | 83,235 |
| Events in quadrant D | 3,809,664 | 614,123 |
| Mode M0 | |||
|---|---|---|---|
| Quadrant | BADHDUFLAG | Total packets | Discarded packets |
| A | 0 | 19495 | 2 |
| B | 0 | 17630 | 2 |
| C | 0 | 52690 | 5 |
| D | 0 | 16754 | 2 |
| Mode M9 | |||
|---|---|---|---|
| Quadrant | BADHDUFLAG | Total packets | Discarded packets |
| A | 0 | 16 | 0 |
| B | 0 | 17 | 0 |
| C | 0 | 17 | 0 |
| D | 0 | 17 | 0 |
| Mode SS | |||
|---|---|---|---|
| Quadrant | BADHDUFLAG | Total packets | Discarded packets |
| A | 0 | 144 | 0 |
| B | 0 | 146 | 0 |
| C | 0 | 146 | 0 |
| D | 0 | 146 | 0 |
| Quadrant | Total seconds | Saturated seconds | Saturation percentage |
|---|---|---|---|
| A | 7022 | 540 | 7.690117% |
| B | 7022 | 199 | 2.833950% |
| C | 7021 | 6290 | 89.588378% |
| D | 7021 | 191 | 2.720410% |
Noise dominated data is calculated using 1-second bins in cleaned event files. If a bin has >2000 counts, and if more than 50% of those come from <1% of pixels, then it is considered to be noise-dominated and hence unusable.
| Quadrant | # 1 sec bins | Bins with >0 counts | Bins with >2000 counts | High rate bins dominated by noise | Noise dominated (total time) | Noise dominated (detector-on time) | Marked lightcurve |
|---|---|---|---|---|---|---|---|
| A | 7667 | 7024 | 483 | 483 | 6.30% | 6.88% | 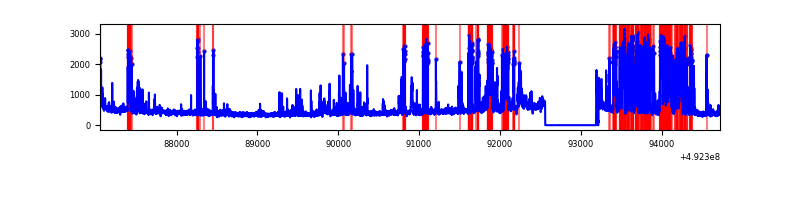 |
| B | 7667 | 7024 | 88 | 88 | 1.15% | 1.25% | 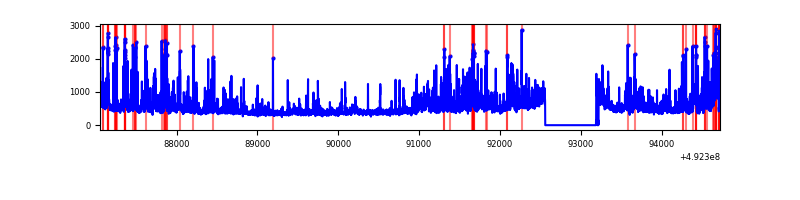 |
| C | 7666 | 7023 | 5967 | 5967 | 77.84% | 84.96% | 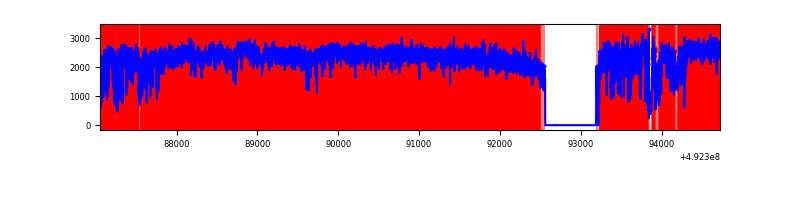 |
| D | 7666 | 7023 | 142 | 142 | 1.85% | 2.02% | 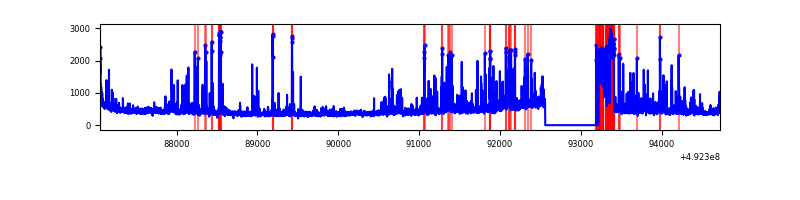 |
Top three noisy pixels from each quadrant. If the there are fewer than three noisy pixels in the level2.evt file, extra rows are filled as -1
| Pixel properties | Quadrant properties | ||||||
|---|---|---|---|---|---|---|---|
| Quadrant | DetID | PixID | Counts | Sigma | Mean | Median | Sigma |
| A | 15 | 174 | 1051744 | 5844.12 | 712 | 693 | 179.8 |
| A | 0 | 8 | 499623 | 2774.18 | 712 | 693 | 179.8 |
| A | 12 | 115 | 218339 | 1210.17 | 712 | 693 | 179.8 |
| B | 0 | 171 | 206720 | 1325.67 | 727 | 700 | 155.4 |
| B | 2 | 249 | 143755 | 920.51 | 727 | 700 | 155.4 |
| B | 4 | 206 | 137862 | 882.59 | 727 | 700 | 155.4 |
| C | 15 | 178 | 6047368 | 54158.39 | 400 | 396 | 111.7 |
| C | 15 | 158 | 4763864 | 42662.97 | 400 | 396 | 111.7 |
| C | 15 | 224 | 1629016 | 14586.38 | 400 | 396 | 111.7 |
| D | 2 | 62 | 323861 | 1600.43 | 709 | 677 | 201.9 |
| D | 2 | 249 | 108329 | 533.1 | 709 | 677 | 201.9 |
| D | 8 | 176 | 92747 | 455.94 | 709 | 677 | 201.9 |
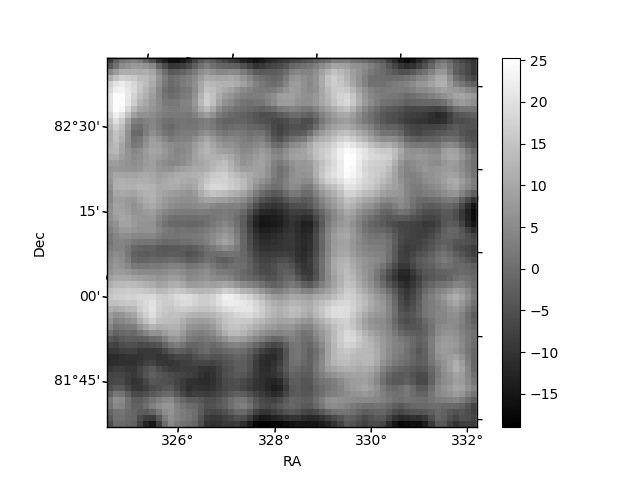
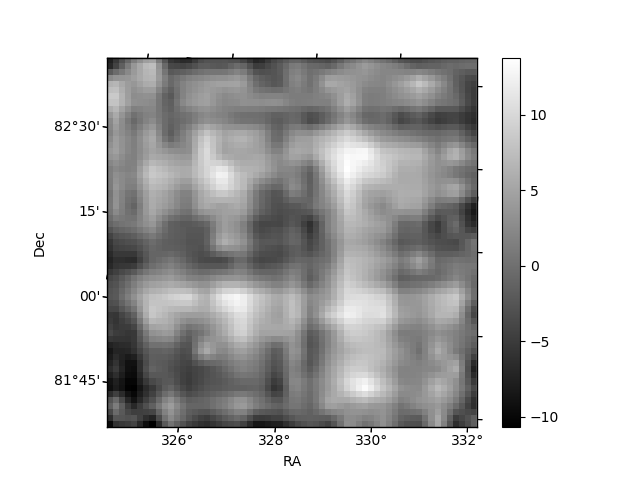
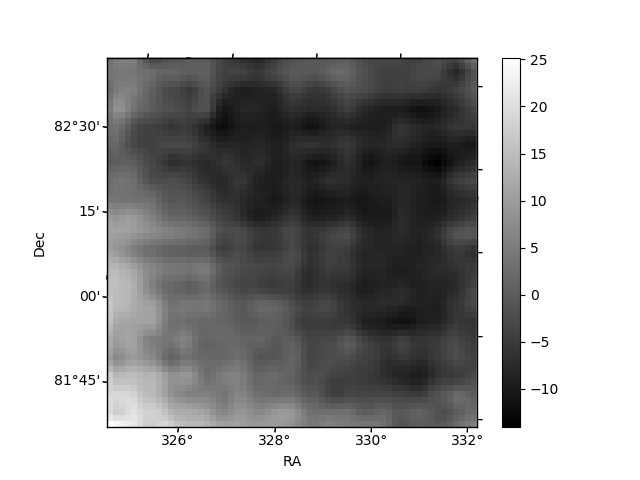
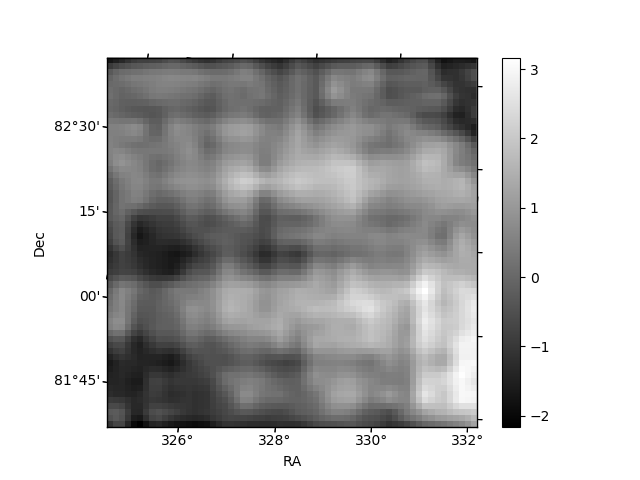
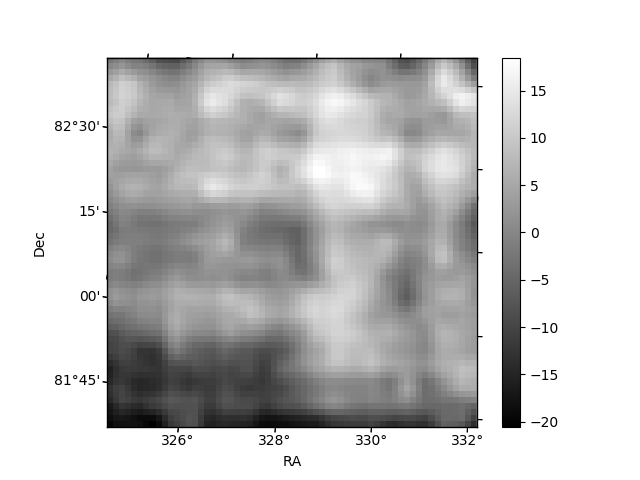
Histogram calculated using DETX and DETY for each event in the final _common_clean file
| Quadrant A | 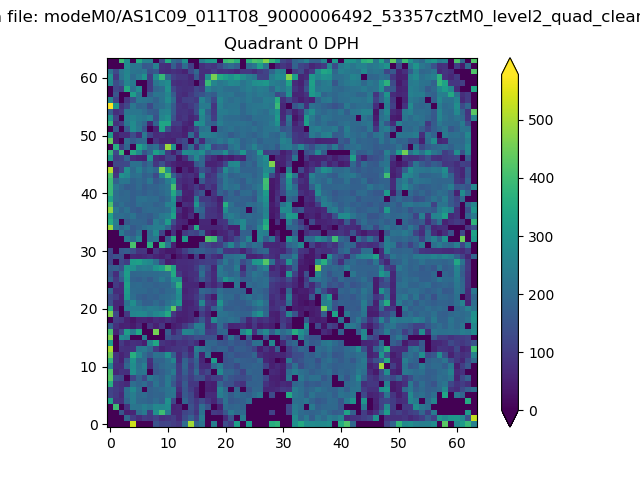 |
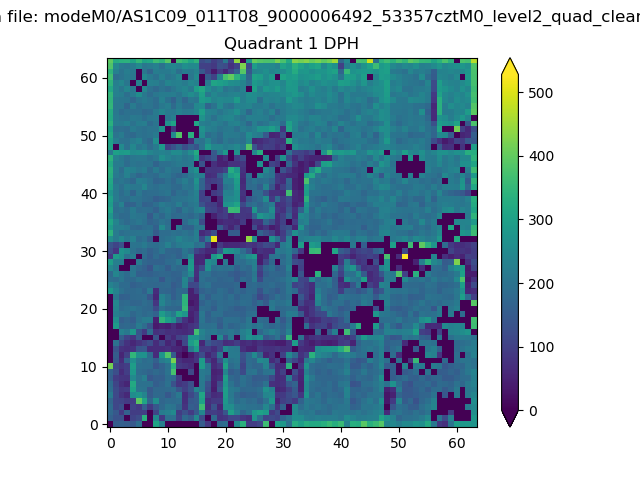 |
Quadrant B |
|---|---|---|---|
| Quadrant D | 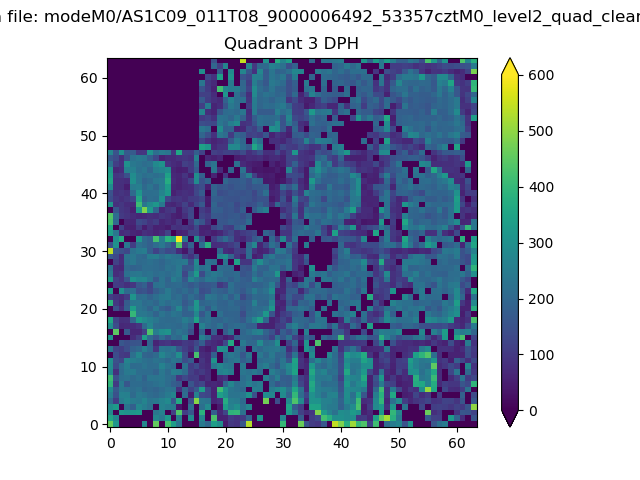 |
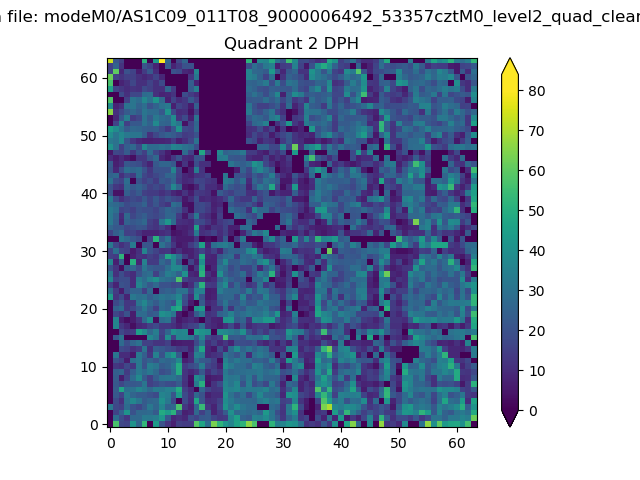 |
Quadrant C |
| Plot type | Count rate plots | Images |
|---|---|---|
| Comparison with Poisson distribution Blue bars denote a histogram of data divided into 1 sec bins. Red curve is a Poisson curve with rate = median count rate of data. |
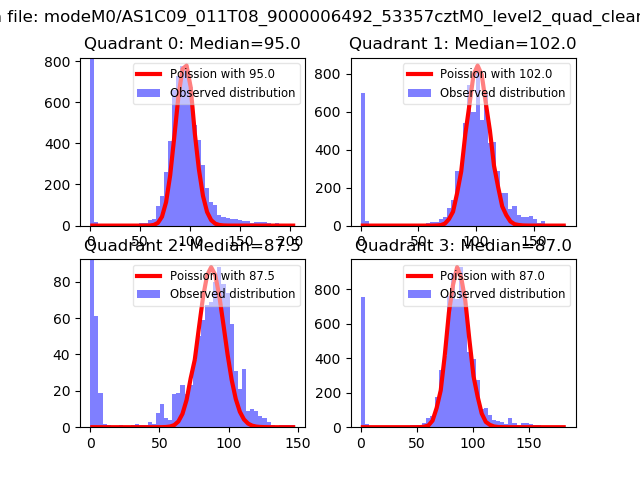 |
 |
| Quadrant-wise count rates Data is divided into 100 sec bins |
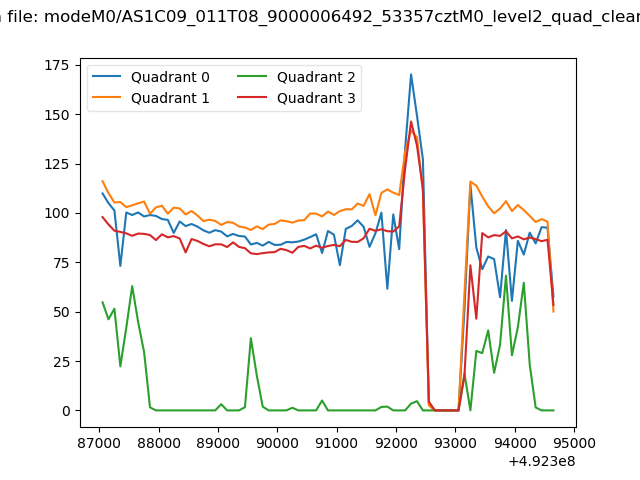 |
|
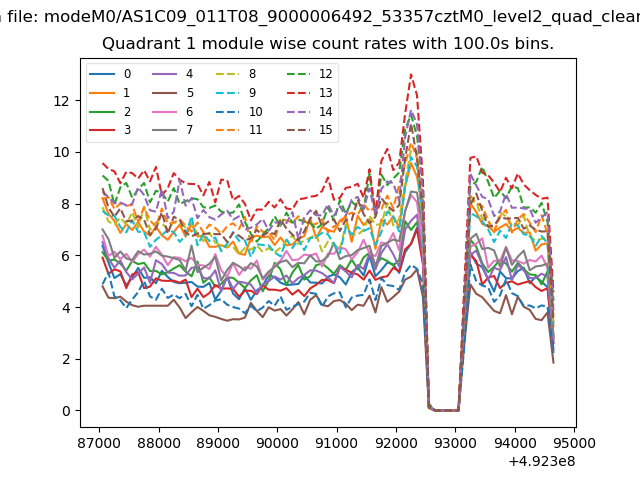
| Module-wise count rates for Quadrant A Data is divided into 100 sec bins |
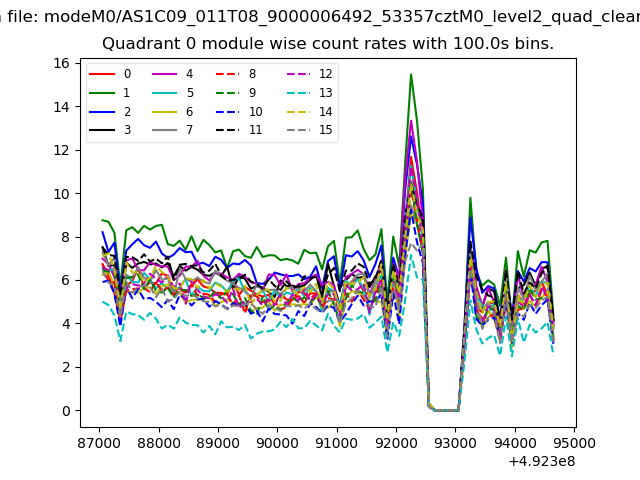 |
 |
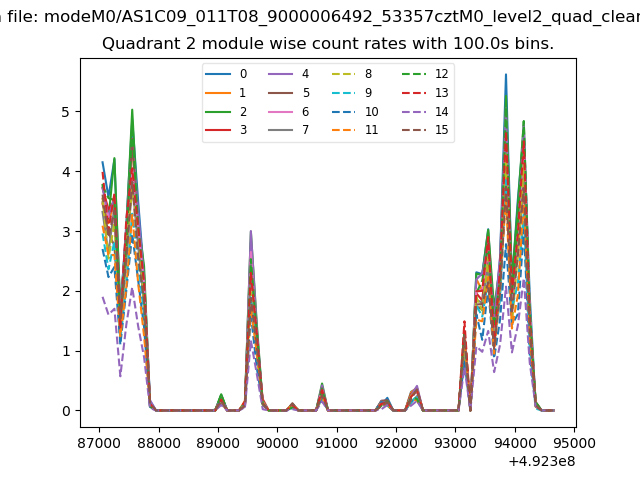
| Module-wise count rates for Quadrant B Data is divided into 100 sec bins |
 |
 |
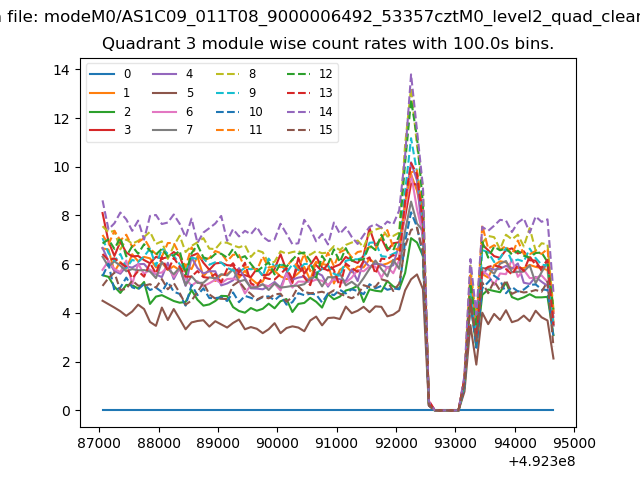
| Module-wise count rates for Quadrant C Data is divided into 100 sec bins |
 |
 |
| Module-wise count rates for Quadrant D Data is divided into 100 sec bins |
 |
 |
| Parameter | Plot |
|---|---|
| CZT HV Monitor | 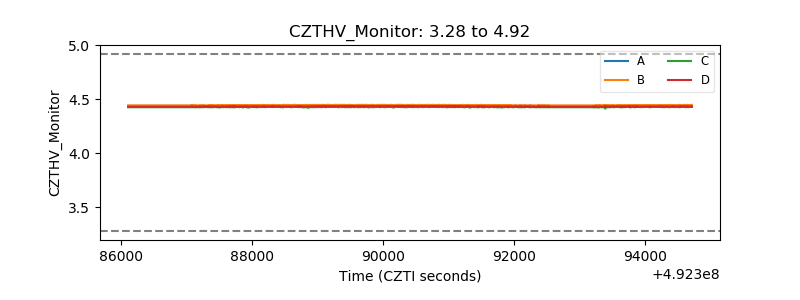 |
| D_VDD | 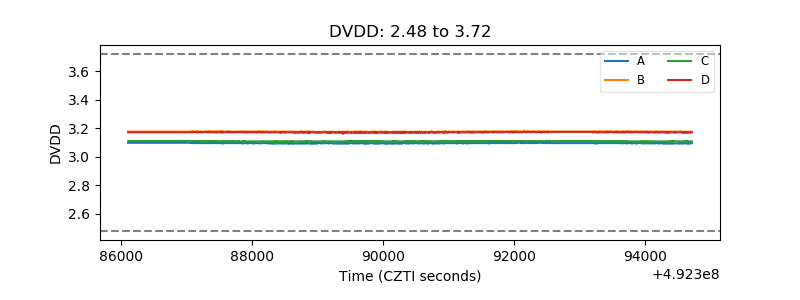 |
| Temperature 1 | 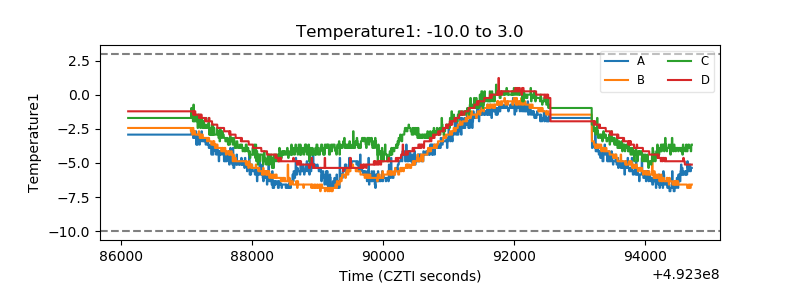 |
| Veto HV Monitor | 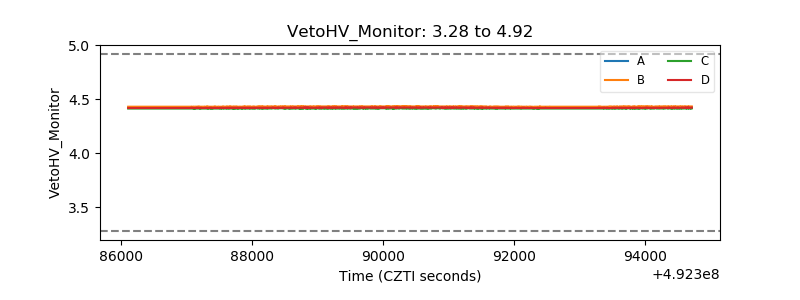 |
| Veto LLD | 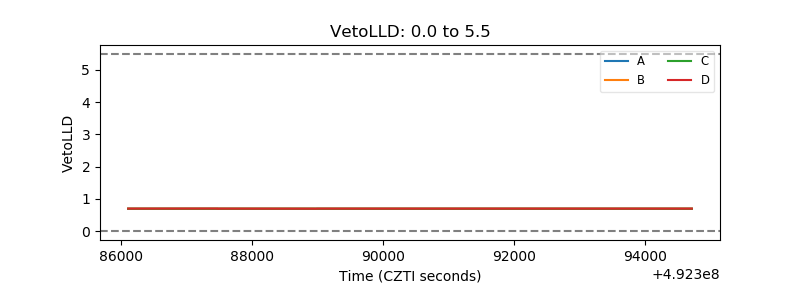 |
| Alpha Counter | 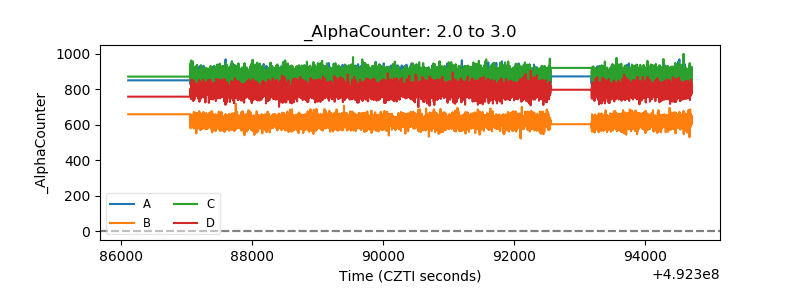 |
| _CPM_Rate | 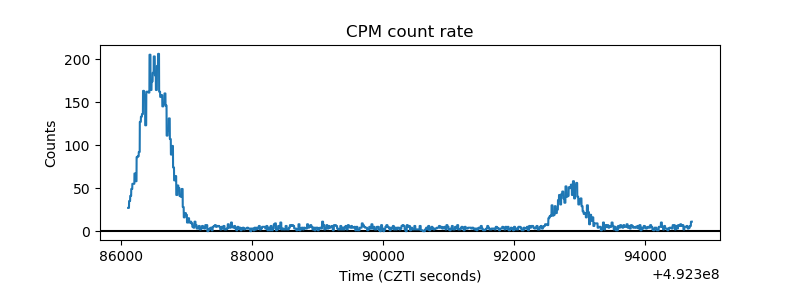 |
| CZT Counter | 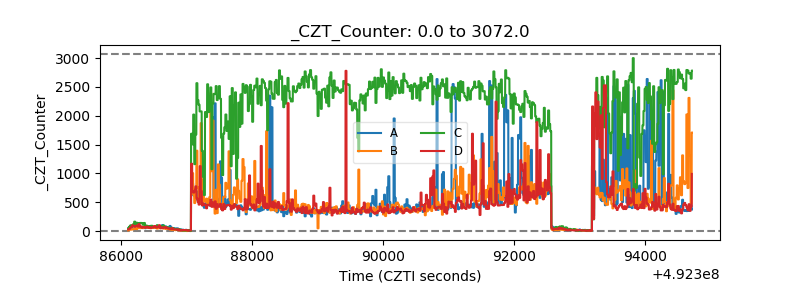 |
| +2.5 Volts monitor | 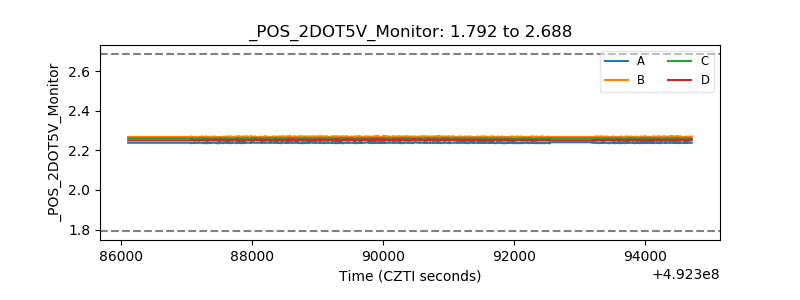 |
| +5 Volts monitor |  |
| _ROLL_ROT | 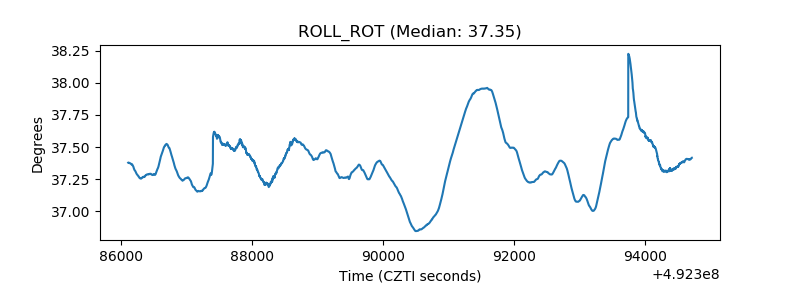 |
| _Roll_DEC | 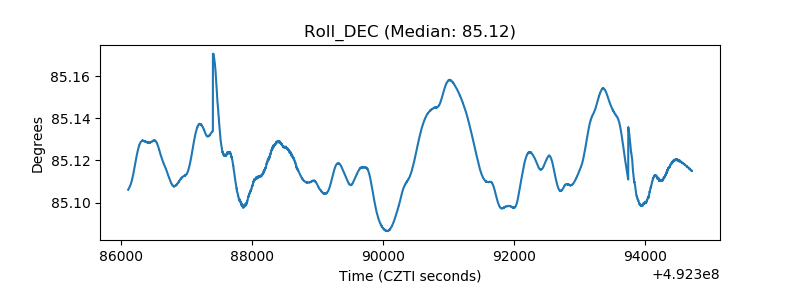 |
| _Roll_RA | 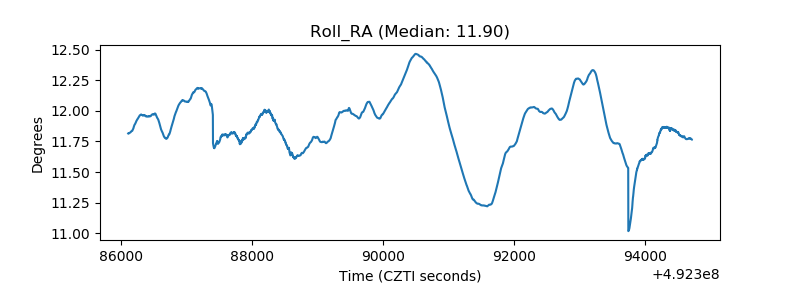 |
| Veto Counter | 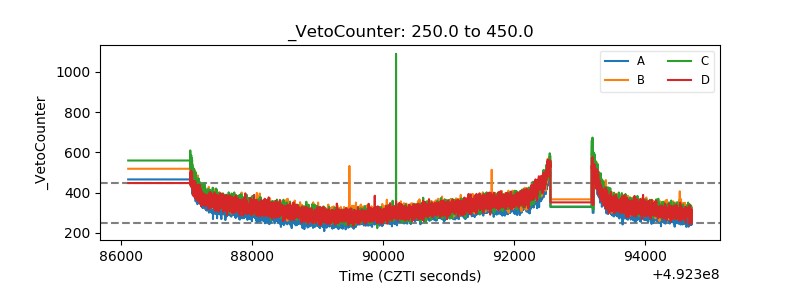 |