| Param | Original file | Final file |
|---|---|---|
| Filename | modeM0/AS1C09_011T09_9000006494cztM0_level2.fits | modeM0/AS1C09_011T09_9000006494cztM0_level2_quad_clean.evt |
| Size (bytes) | 2,841,721,920 | 1,046,162,880 |
| Size | 2.6 GB | 997.7 MB |
| Events in quadrant A | 18,106,310 | 1,949,424 |
| Events in quadrant B | 16,225,092 | 1,788,710 |
| Events in quadrant C | 10,629,848 | 479,232 |
| Events in quadrant D | 15,212,236 | 1,710,587 |
| Mode SS | |||
|---|---|---|---|
| Quadrant | BADHDUFLAG | Total packets | Discarded packets |
| A | 0 | 7635 | 0 |
| B | 0 | 7633 | 0 |
| C | 0 | 7633 | 0 |
| D | 0 | 7635 | 0 |
| Mode M0 | |||
|---|---|---|---|
| Quadrant | BADHDUFLAG | Total packets | Discarded packets |
| A | 0 | 1017739 | 0 |
| B | 0 | 1315505 | 0 |
| C | 0 | 2447982 | 0 |
| D | 0 | 1144056 | 0 |
| Mode M9 | |||
|---|---|---|---|
| Quadrant | BADHDUFLAG | Total packets | Discarded packets |
| A | 0 | 431 | 0 |
| B | 0 | 431 | 0 |
| C | 0 | 431 | 0 |
| D | 0 | 431 | 0 |
| Quadrant | Total seconds | Saturated seconds | Saturation percentage |
|---|---|---|---|
| A | 375793 | 22142 | 5.892074% |
| B | 375729 | 56122 | 14.936829% |
| C | 375240 | 229187 | 61.077444% |
| D | 375638 | 27296 | 7.266570% |
Noise dominated data is calculated using 1-second bins in cleaned event files. If a bin has >2000 counts, and if more than 50% of those come from <1% of pixels, then it is considered to be noise-dominated and hence unusable.
| Quadrant | # 1 sec bins | Bins with >0 counts | Bins with >2000 counts | High rate bins dominated by noise | Noise dominated (total time) | Noise dominated (detector-on time) | Marked lightcurve |
|---|---|---|---|---|---|---|---|
| A | 436412 | 375572 | 0 | 0 | 0.00% | 0.00% | 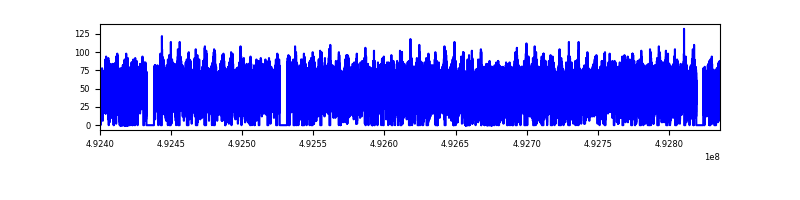 |
| B | 436413 | 374252 | 0 | 0 | 0.00% | 0.00% | 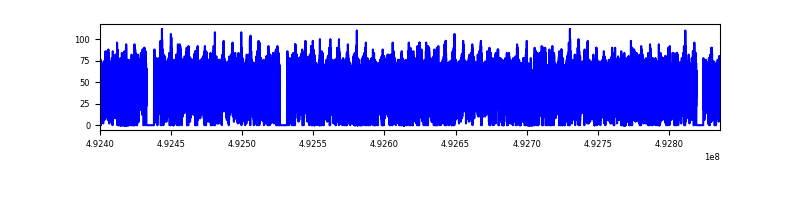 |
| C | 436412 | 361247 | 0 | 0 | 0.00% | 0.00% | 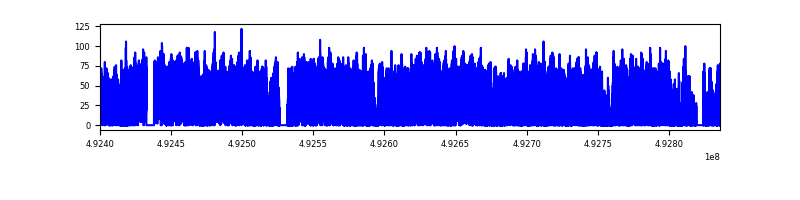 |
| D | 436414 | 374925 | 0 | 0 | 0.00% | 0.00% | 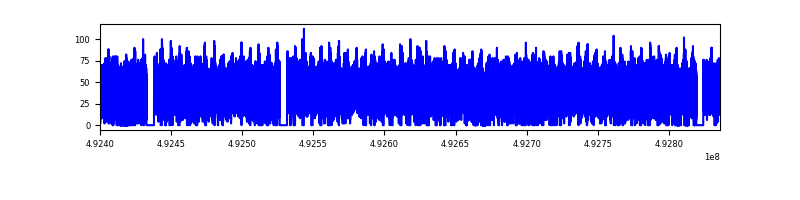 |
Top three noisy pixels from each quadrant. If the there are fewer than three noisy pixels in the level2.evt file, extra rows are filled as -1
| Pixel properties | Quadrant properties | ||||||
|---|---|---|---|---|---|---|---|
| Quadrant | DetID | PixID | Counts | Sigma | Mean | Median | Sigma |
| A | 14 | 188 | 21250 | 10.6 | 4779 | 4418 | 1588.1 |
| A | 9 | 255 | 19636 | 9.58 | 4779 | 4418 | 1588.1 |
| A | 14 | 204 | 17162 | 8.02 | 4779 | 4418 | 1588.1 |
| B | 2 | 9 | 19107 | 14.99 | 4313 | 4096 | 1001.3 |
| B | 2 | 8 | 17244 | 13.13 | 4313 | 4096 | 1001.3 |
| B | 9 | 173 | 13759 | 9.65 | 4313 | 4096 | 1001.3 |
| C | 2 | 31 | 8470 | 6.01 | 2845 | 2599 | 977.7 |
| C | 3 | 202 | 8410 | 5.94 | 2845 | 2599 | 977.7 |
| C | 7 | 221 | 8352 | 5.88 | 2845 | 2599 | 977.7 |
| D | 6 | 218 | 20339 | 11.01 | 4358 | 3860 | 1497.0 |
| D | 6 | 207 | 13564 | 6.48 | 4358 | 3860 | 1497.0 |
| D | 6 | 223 | 13555 | 6.48 | 4358 | 3860 | 1497.0 |
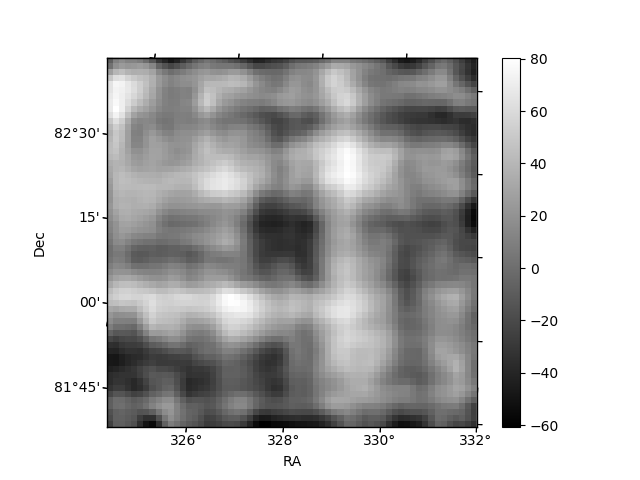
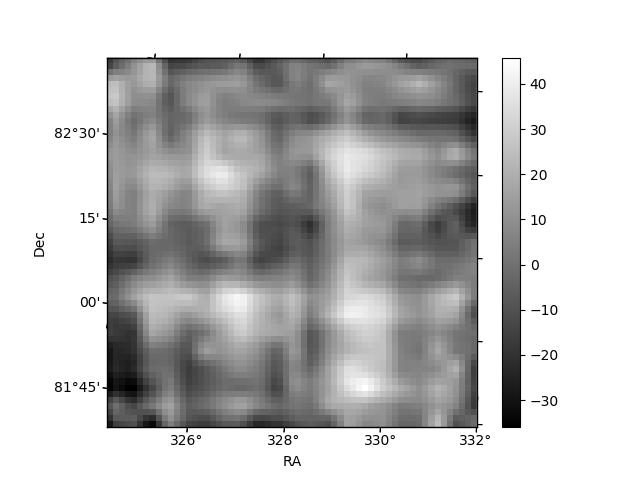
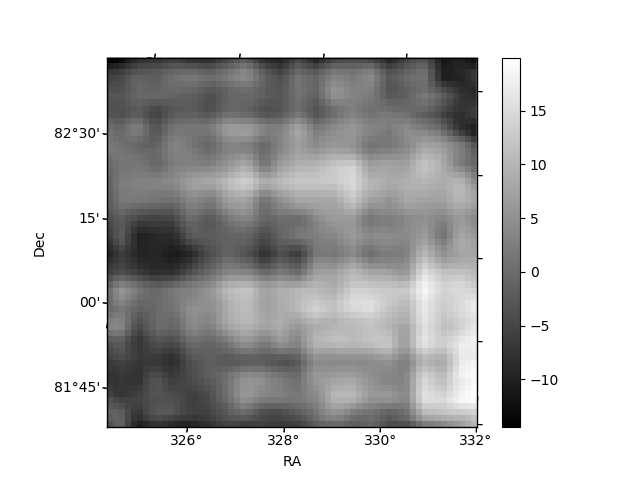
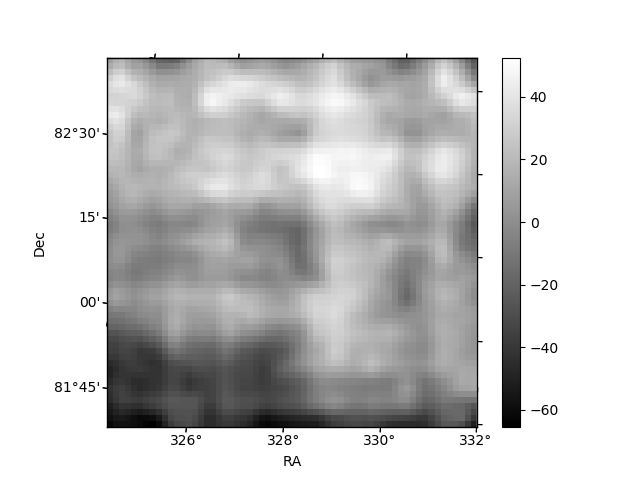
Histogram calculated using DETX and DETY for each event in the final _common_clean file
| Quadrant A | 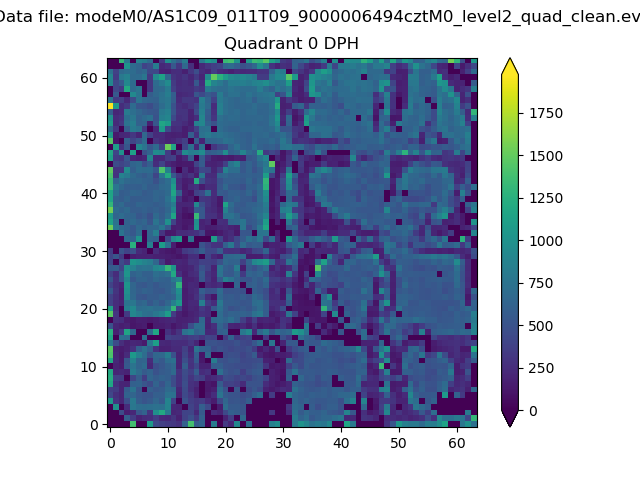 |
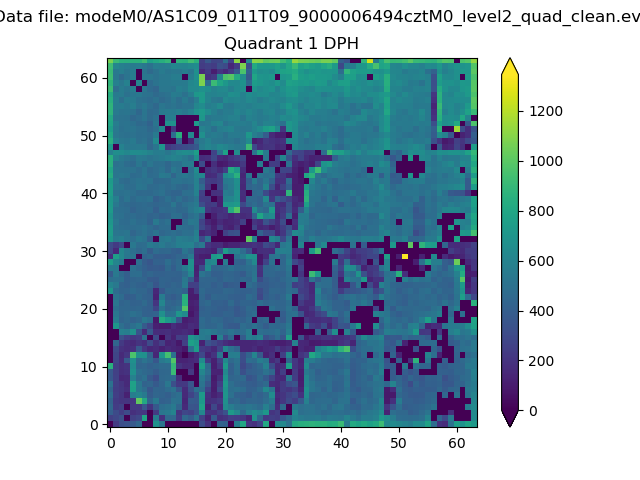 |
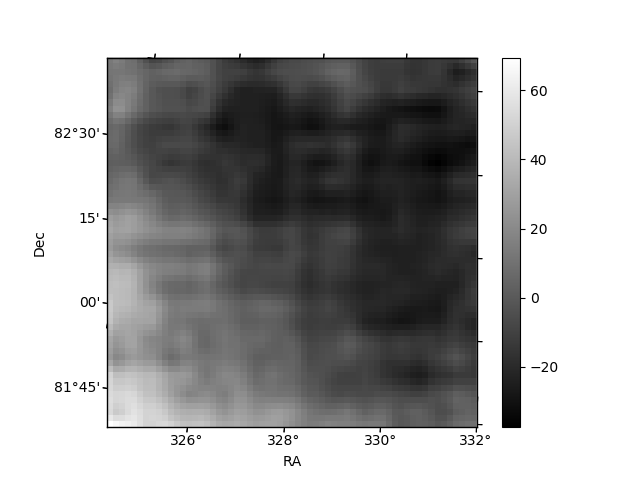
Quadrant B |
|---|---|---|---|
| Quadrant D | 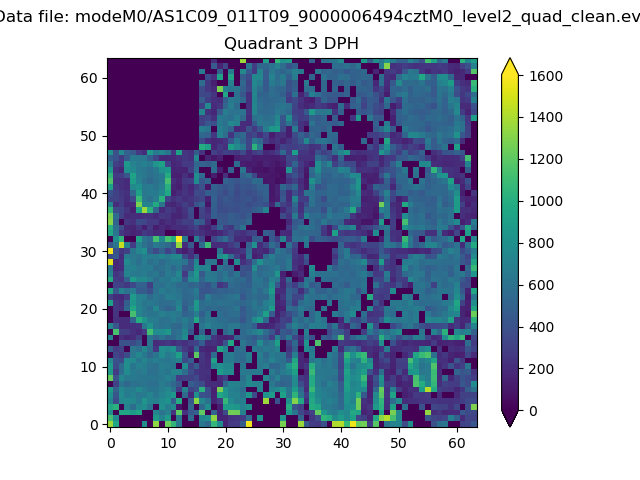 |
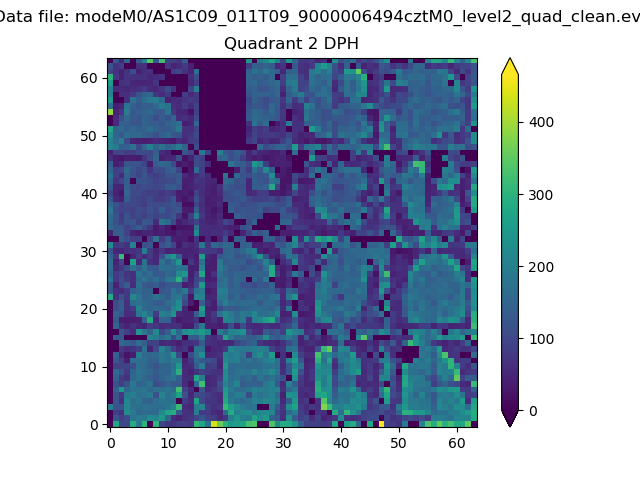 |
Quadrant C |
| Plot type | Count rate plots | Images |
|---|---|---|
| Comparison with Poisson distribution Blue bars denote a histogram of data divided into 1 sec bins. Red curve is a Poisson curve with rate = median count rate of data. |
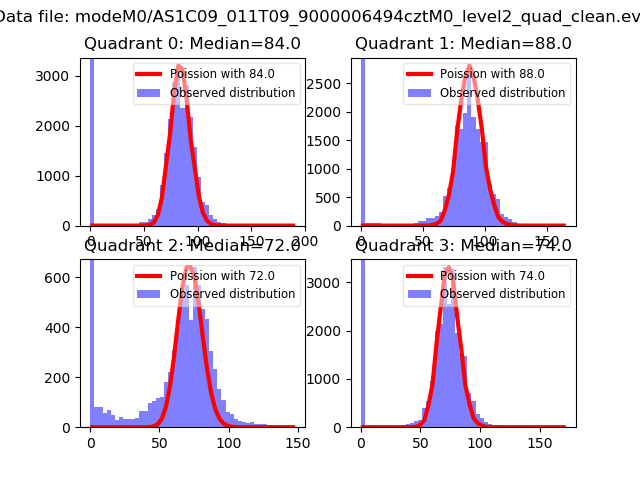 |
 |
| Quadrant-wise count rates Data is divided into 100 sec bins |
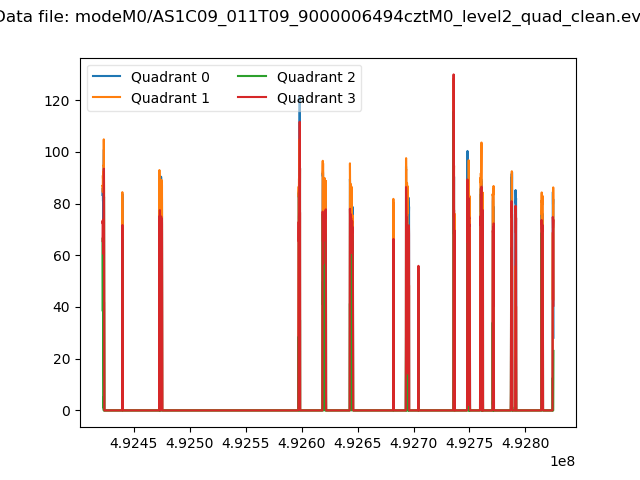 |
|
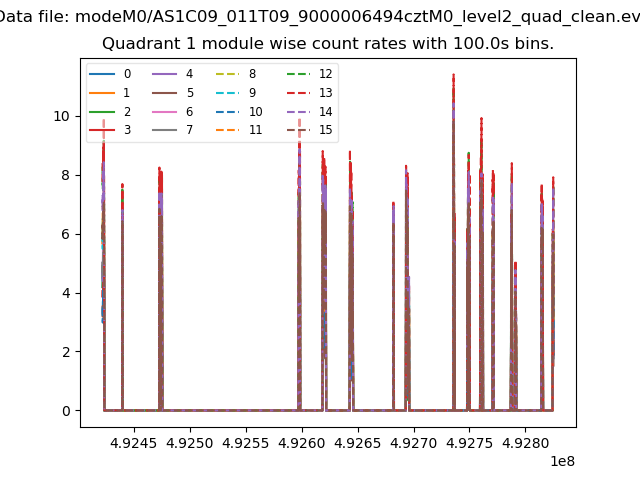
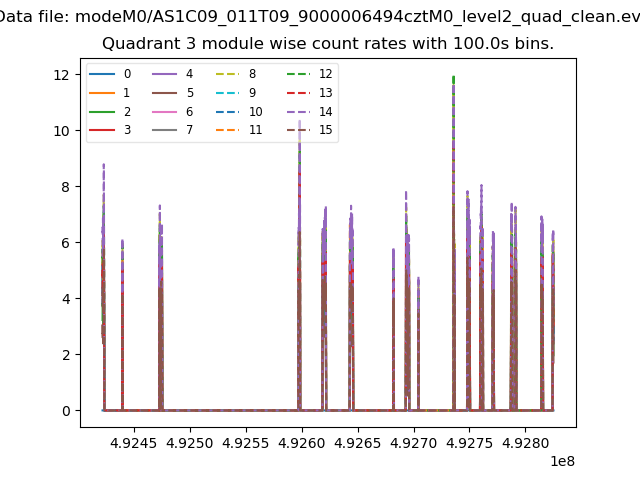
| Module-wise count rates for Quadrant A Data is divided into 100 sec bins |
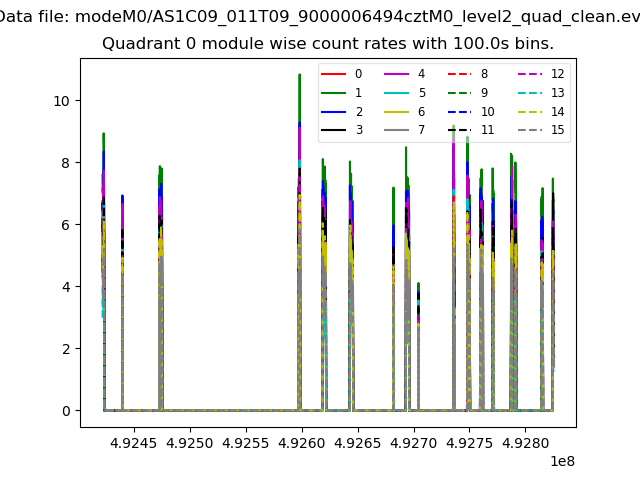 |
 |
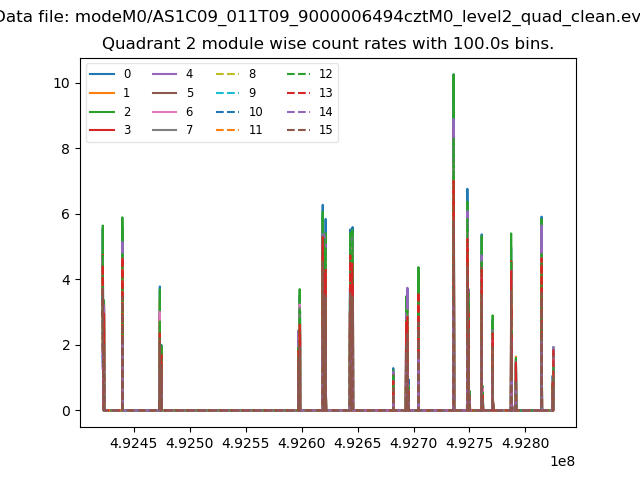
| Module-wise count rates for Quadrant B Data is divided into 100 sec bins |
 |
 |
| Module-wise count rates for Quadrant C Data is divided into 100 sec bins |
 |
 |
| Module-wise count rates for Quadrant D Data is divided into 100 sec bins |
 |
 |
| Parameter | Plot |
|---|---|
| CZT HV Monitor | 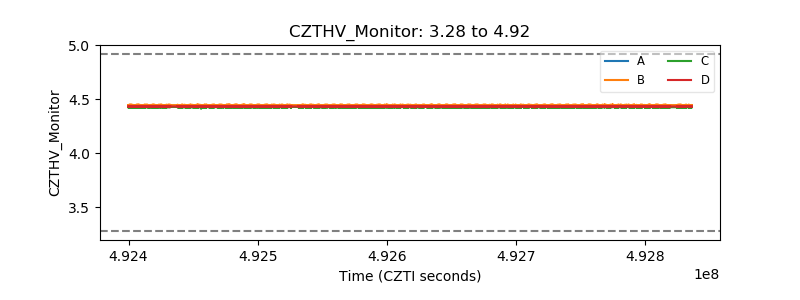 |
| D_VDD | 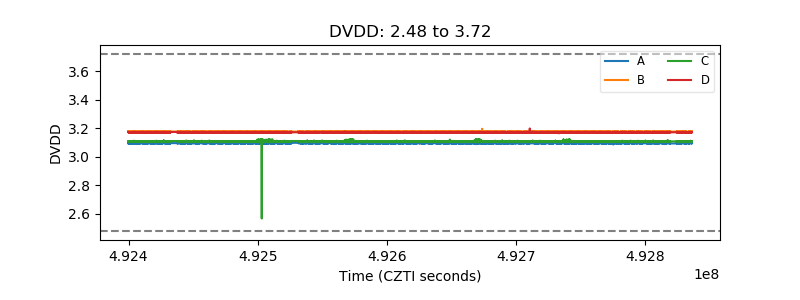 |
| Temperature 1 | 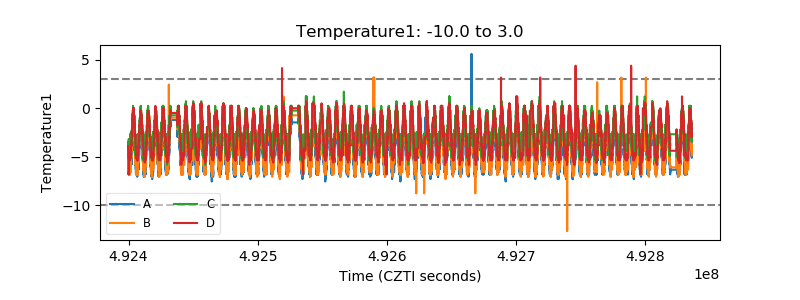 |
| Veto HV Monitor | 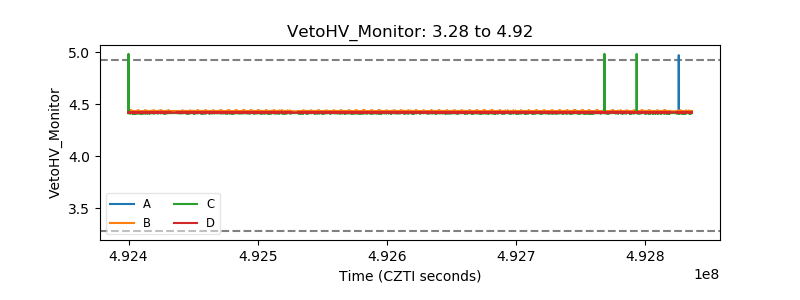 |
| Veto LLD | 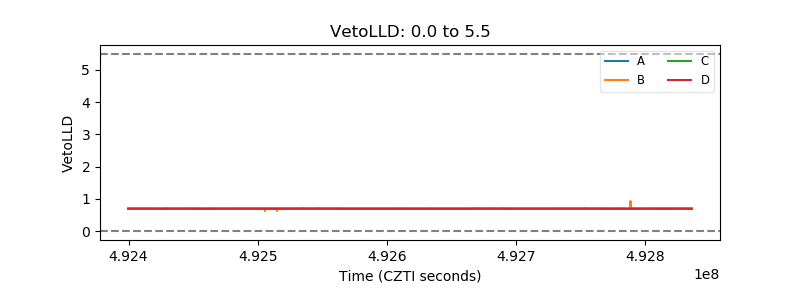 |
| Alpha Counter | 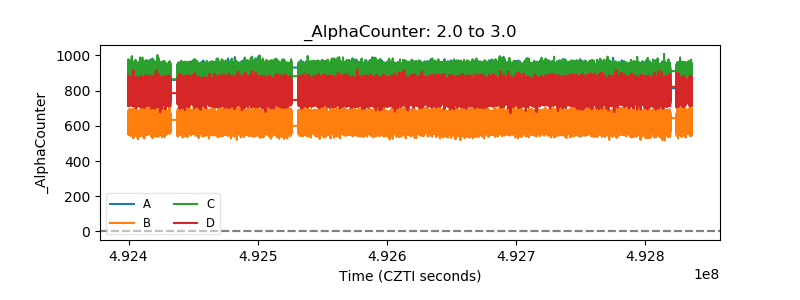 |
| _CPM_Rate | 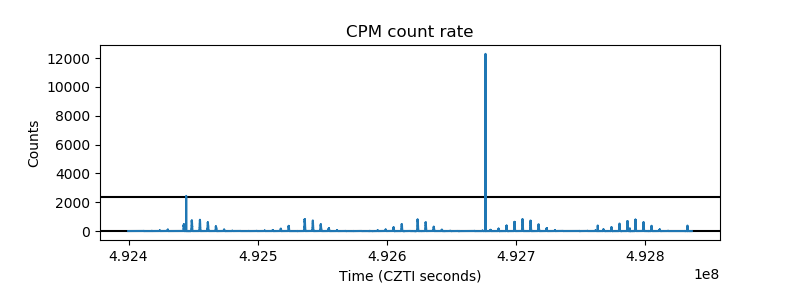 |
| CZT Counter | 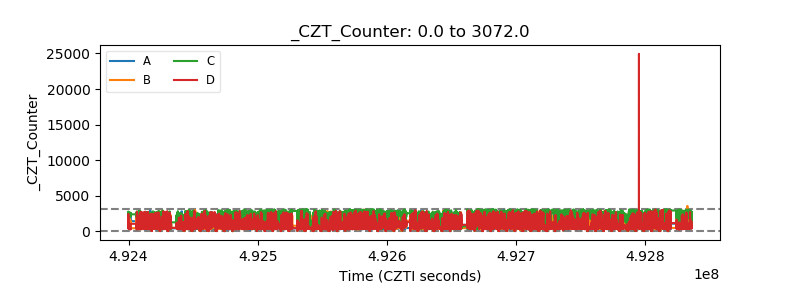 |
| +2.5 Volts monitor | 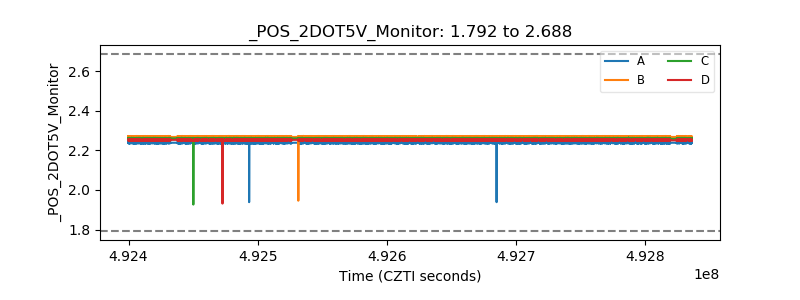 |
| +5 Volts monitor | 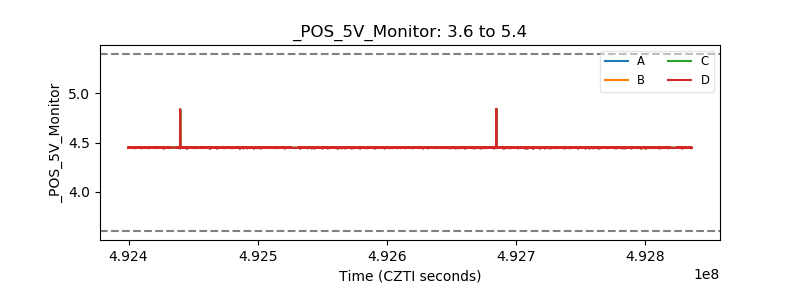 |
| _ROLL_ROT | 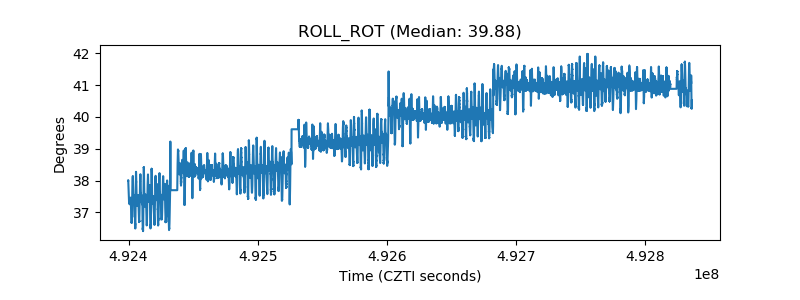 |
| _Roll_DEC | 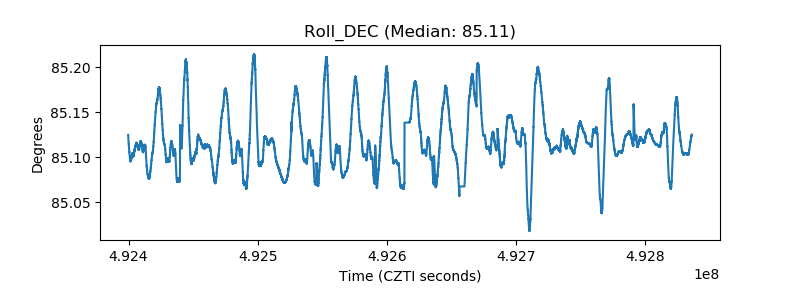 |
| _Roll_RA | 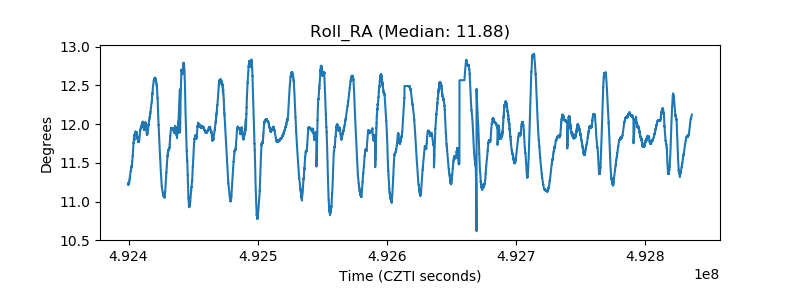 |
| Veto Counter | 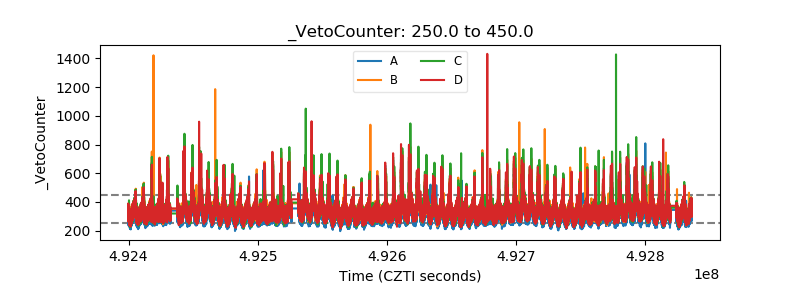 |