| Param | Original file | Final file |
|---|---|---|
| Filename | modeM0/AS1C09_011T09_9000006494_53359cztM0_level2.fits | modeM0/AS1C09_011T09_9000006494_53359cztM0_level2_quad_clean.evt |
| Size (bytes) | 921,240,000 | 86,912,640 |
| Size | 878.6 MB | 82.9 MB |
| Events in quadrant A | 5,296,604 | 698,988 |
| Events in quadrant B | 6,110,773 | 734,708 |
| Events in quadrant C | 17,501,166 | 21,402 |
| Events in quadrant D | 4,598,032 | 643,840 |
| Mode SS | |||
|---|---|---|---|
| Quadrant | BADHDUFLAG | Total packets | Discarded packets |
| A | 0 | 154 | 0 |
| B | 0 | 152 | 0 |
| C | 0 | 152 | 0 |
| D | 0 | 152 | 0 |
| Mode M0 | |||
|---|---|---|---|
| Quadrant | BADHDUFLAG | Total packets | Discarded packets |
| A | 0 | 21147 | 0 |
| B | 0 | 23507 | 1 |
| C | 0 | 57076 | 0 |
| D | 0 | 19440 | 0 |
| Quadrant | Total seconds | Saturated seconds | Saturation percentage |
|---|---|---|---|
| A | 7659 | 259 | 3.381643% |
| B | 7658 | 591 | 7.717420% |
| C | 7658 | 7502 | 97.962915% |
| D | 7659 | 208 | 2.715759% |
Noise dominated data is calculated using 1-second bins in cleaned event files. If a bin has >2000 counts, and if more than 50% of those come from <1% of pixels, then it is considered to be noise-dominated and hence unusable.
| Quadrant | # 1 sec bins | Bins with >0 counts | Bins with >2000 counts | High rate bins dominated by noise | Noise dominated (total time) | Noise dominated (detector-on time) | Marked lightcurve |
|---|---|---|---|---|---|---|---|
| A | 7659 | 7659 | 213 | 213 | 2.78% | 2.78% | 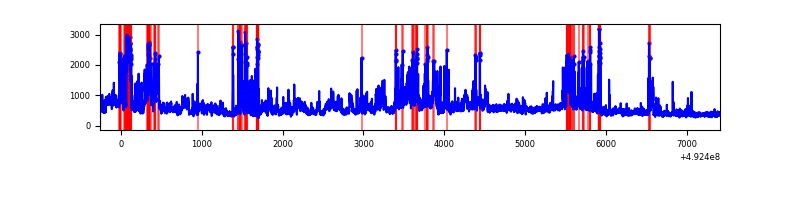 |
| B | 7658 | 7658 | 363 | 363 | 4.74% | 4.74% | 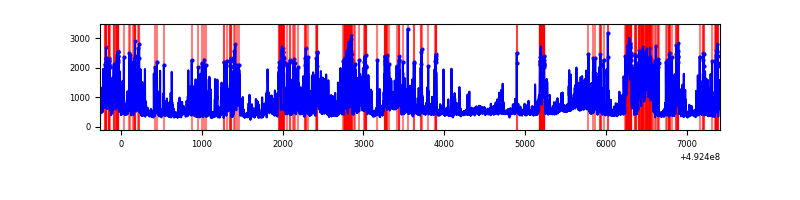 |
| C | 7658 | 7658 | 6669 | 6669 | 87.09% | 87.09% | 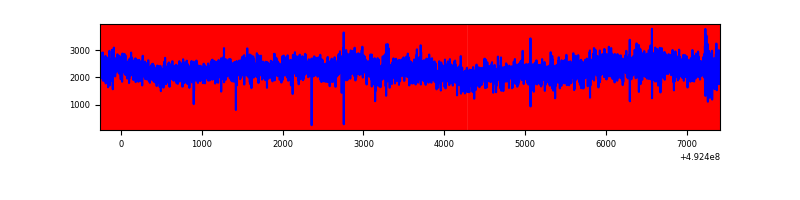 |
| D | 7659 | 7659 | 174 | 174 | 2.27% | 2.27% | 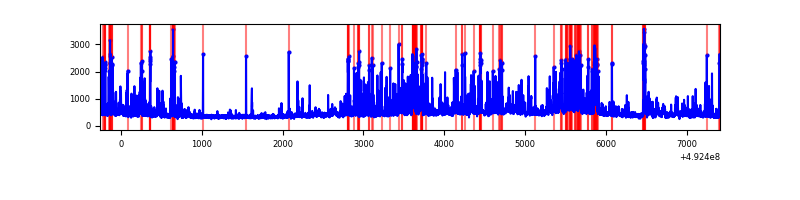 |
Top three noisy pixels from each quadrant. If the there are fewer than three noisy pixels in the level2.evt file, extra rows are filled as -1
| Pixel properties | Quadrant properties | ||||||
|---|---|---|---|---|---|---|---|
| Quadrant | DetID | PixID | Counts | Sigma | Mean | Median | Sigma |
| A | 3 | 14 | 1171417 | 6075.24 | 774 | 756 | 192.7 |
| A | 15 | 174 | 812646 | 4213.37 | 774 | 756 | 192.7 |
| A | 14 | 239 | 168187 | 868.9 | 774 | 756 | 192.7 |
| B | 4 | 206 | 895863 | 5503.96 | 769 | 744 | 162.6 |
| B | 4 | 171 | 558396 | 3428.93 | 769 | 744 | 162.6 |
| B | 2 | 249 | 546215 | 3354.03 | 769 | 744 | 162.6 |
| C | 15 | 158 | 10183741 | 89287.68 | 414 | 411 | 114.1 |
| C | 15 | 178 | 3309001 | 29009.79 | 414 | 411 | 114.1 |
| C | 15 | 224 | 1729661 | 15162.1 | 414 | 411 | 114.1 |
| D | 6 | 239 | 985701 | 4583.63 | 757 | 723 | 214.9 |
| D | 2 | 249 | 131580 | 608.95 | 757 | 723 | 214.9 |
| D | 0 | 18 | 131486 | 608.51 | 757 | 723 | 214.9 |
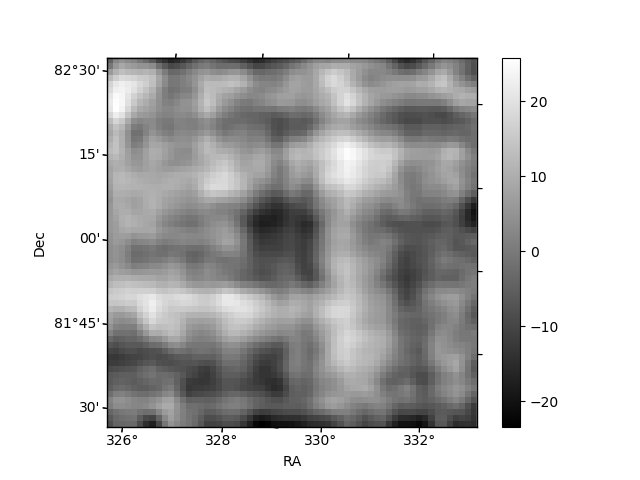
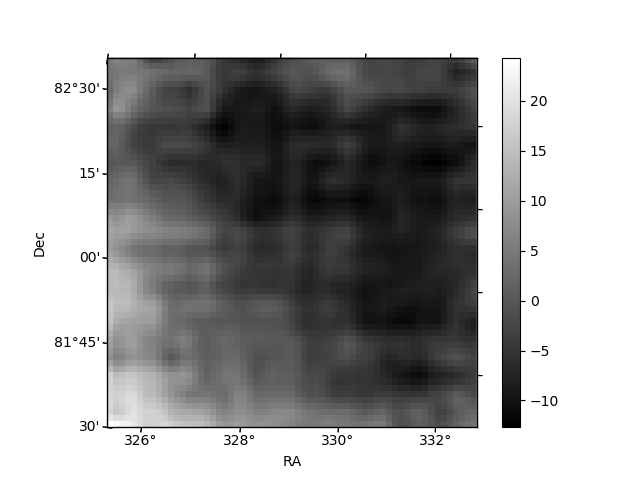
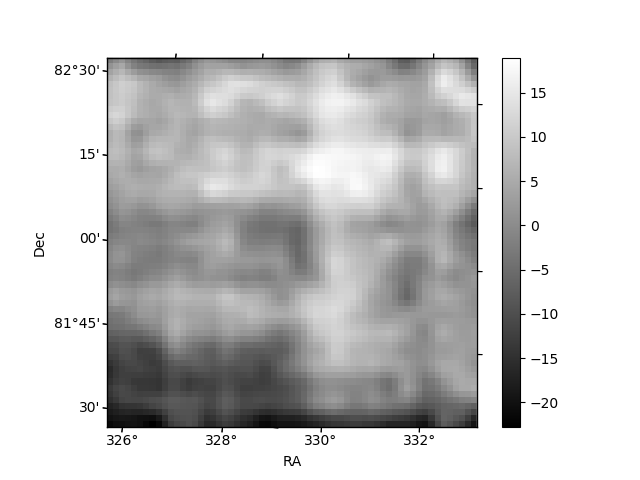
Histogram calculated using DETX and DETY for each event in the final _common_clean file
| Quadrant A | 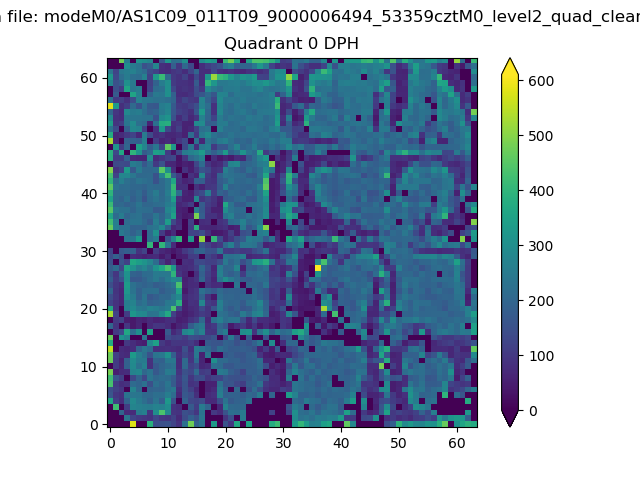 |
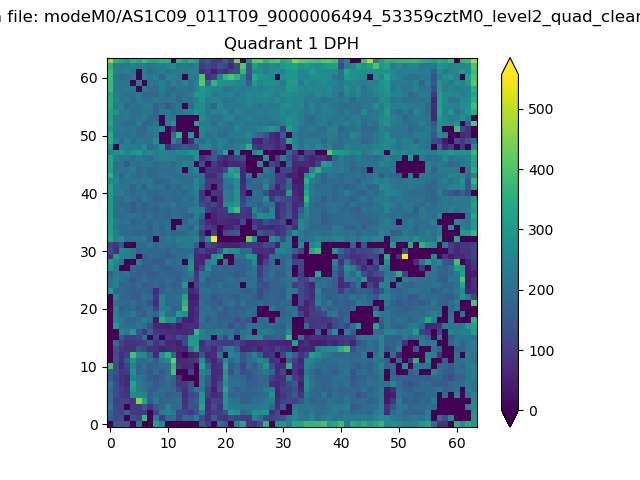 |
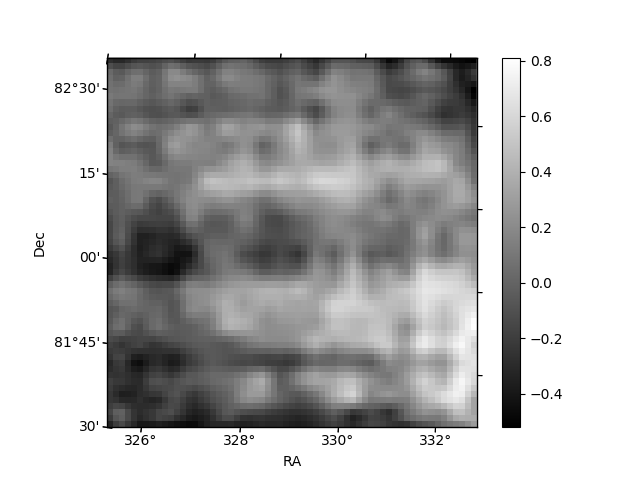
Quadrant B |
|---|---|---|---|
| Quadrant D | 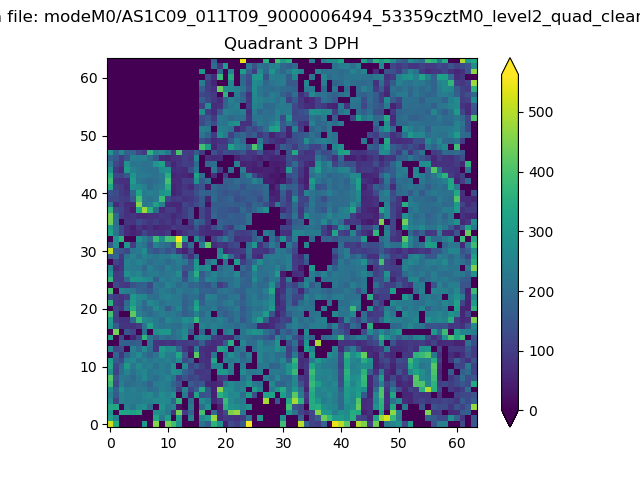 |
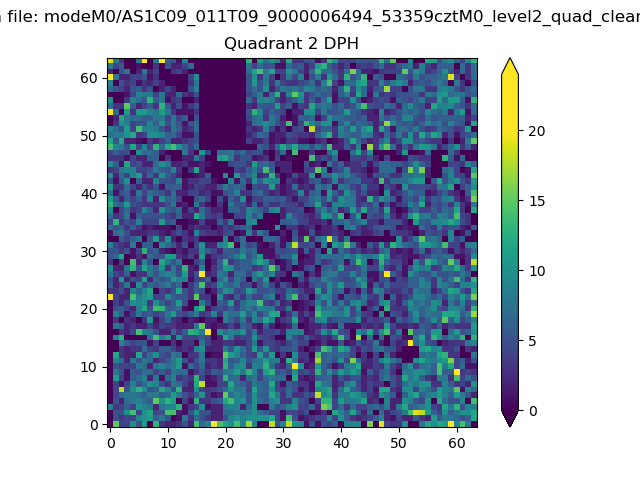 |
Quadrant C |
| Plot type | Count rate plots | Images |
|---|---|---|
| Comparison with Poisson distribution Blue bars denote a histogram of data divided into 1 sec bins. Red curve is a Poisson curve with rate = median count rate of data. |
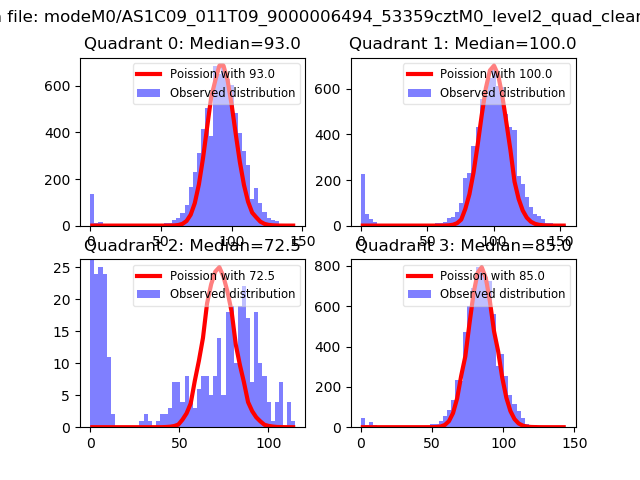 |
 |
| Quadrant-wise count rates Data is divided into 100 sec bins |
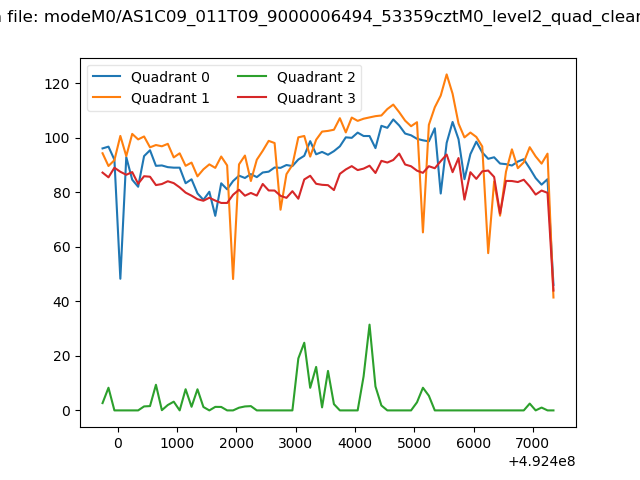 |
|
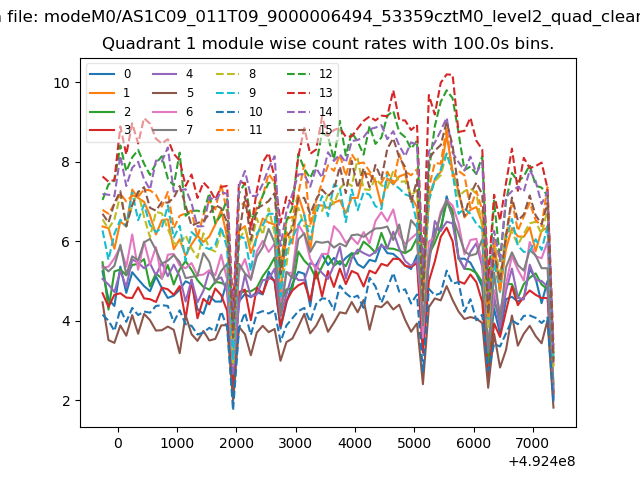
| Module-wise count rates for Quadrant A Data is divided into 100 sec bins |
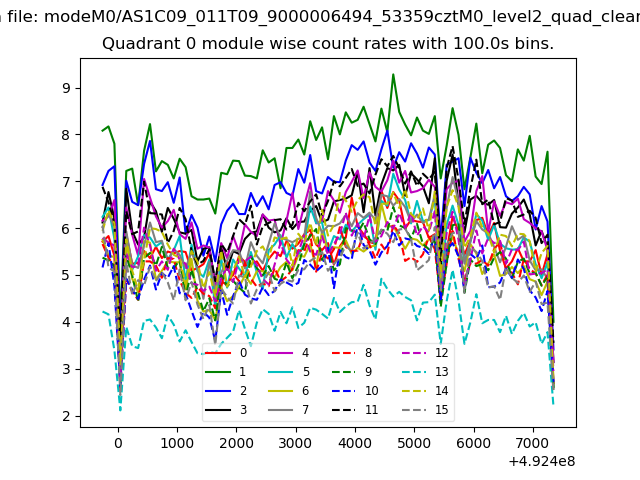 |
 |
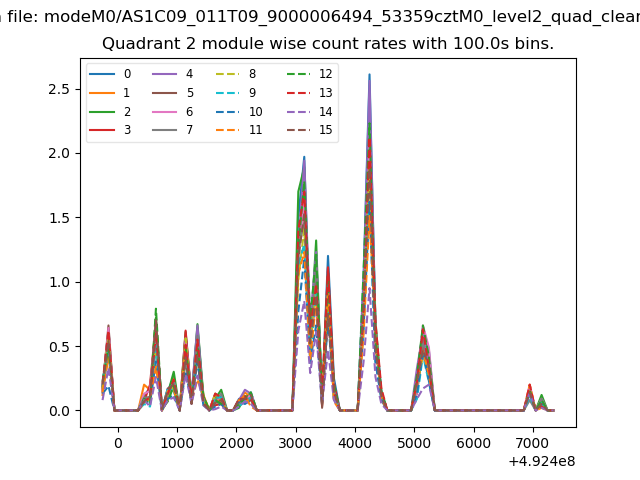
| Module-wise count rates for Quadrant B Data is divided into 100 sec bins |
 |
 |
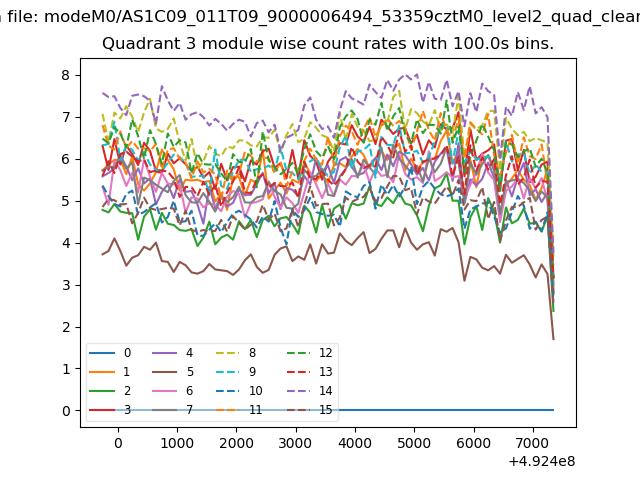
| Module-wise count rates for Quadrant C Data is divided into 100 sec bins |
 |
 |
| Module-wise count rates for Quadrant D Data is divided into 100 sec bins |
 |
 |
| Parameter | Plot |
|---|---|
| CZT HV Monitor | 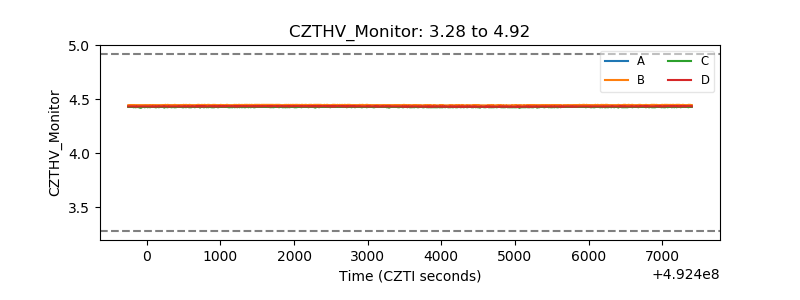 |
| D_VDD | 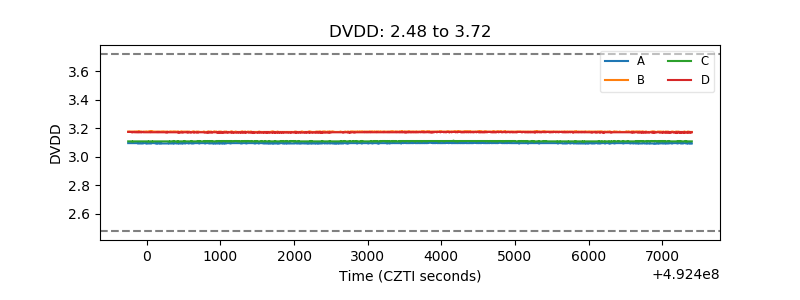 |
| Temperature 1 | 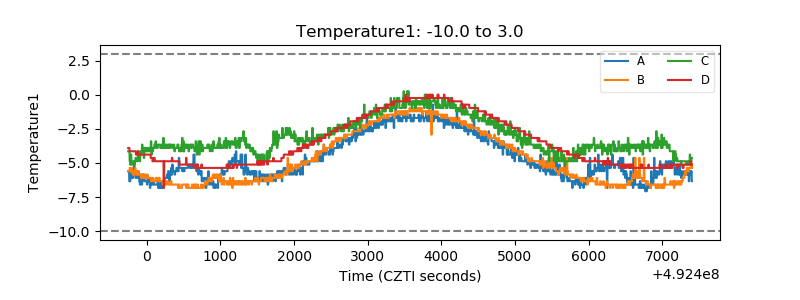 |
| Veto HV Monitor | 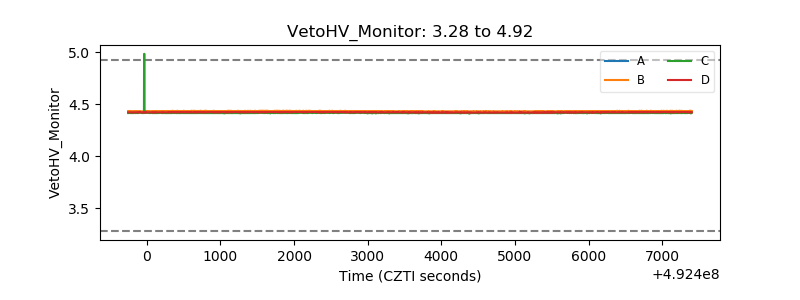 |
| Veto LLD | 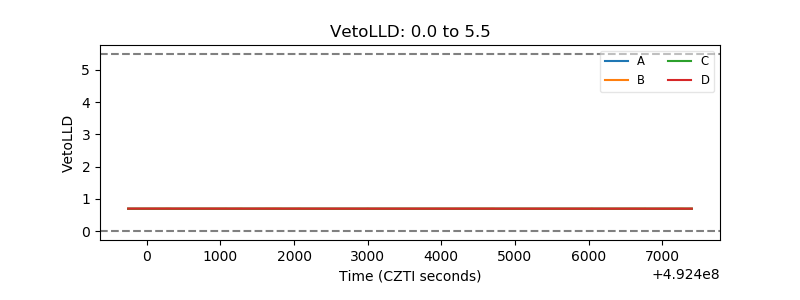 |
| Alpha Counter | 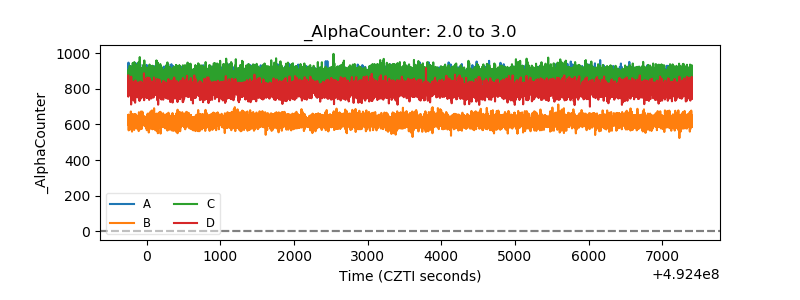 |
| _CPM_Rate | 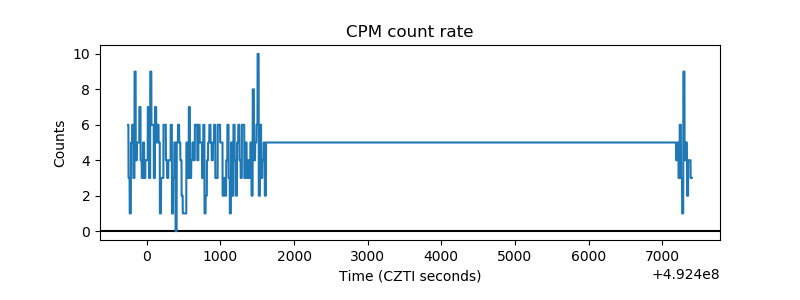 |
| CZT Counter | 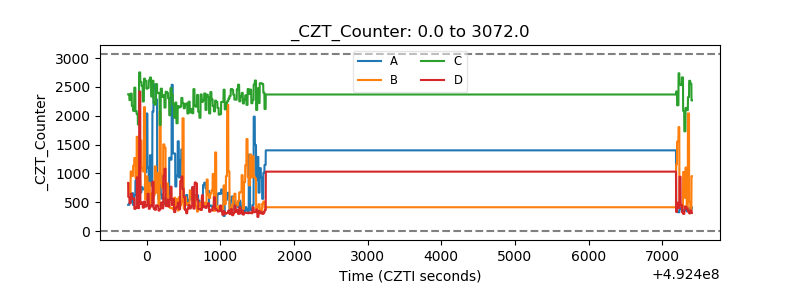 |
| +2.5 Volts monitor | 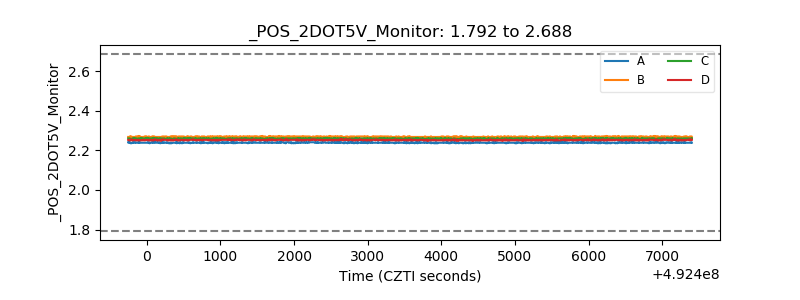 |
| +5 Volts monitor |  |
| _ROLL_ROT | 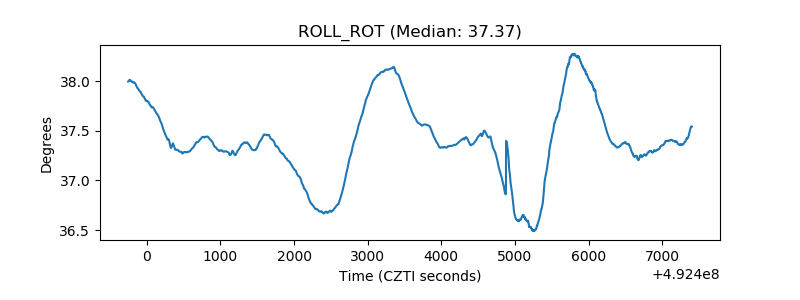 |
| _Roll_DEC |  |
| _Roll_RA | 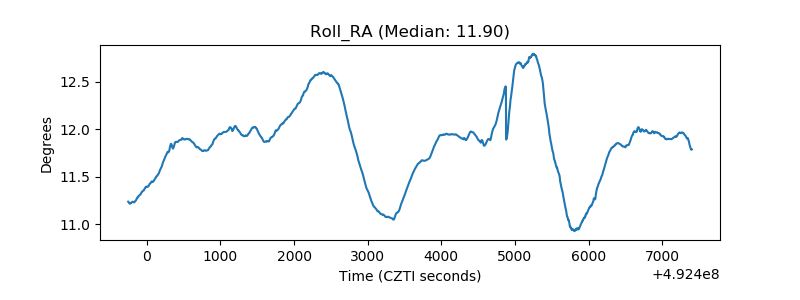 |
| Veto Counter | 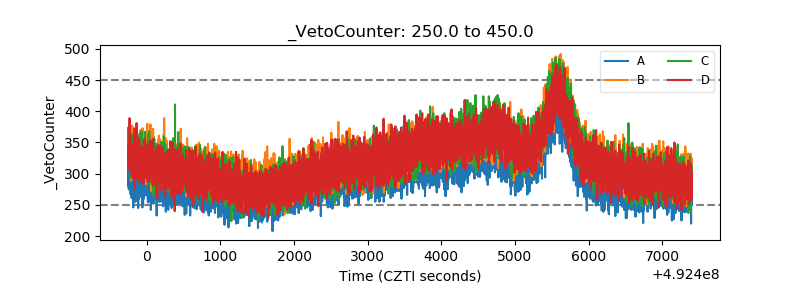 |