| Param | Original file | Final file |
|---|---|---|
| Filename | modeM0/AS1C09_011T09_9000006494_53363cztM0_level2.fits | modeM0/AS1C09_011T09_9000006494_53363cztM0_level2_quad_clean.evt |
| Size (bytes) | 1,762,997,760 | 219,893,760 |
| Size | 1.6 GB | 209.7 MB |
| Events in quadrant A | 10,689,679 | 1,555,692 |
| Events in quadrant B | 12,433,037 | 1,668,380 |
| Events in quadrant C | 26,853,855 | 874,873 |
| Events in quadrant D | 13,943,136 | 1,357,763 |
| Mode SS | |||
|---|---|---|---|
| Quadrant | BADHDUFLAG | Total packets | Discarded packets |
| A | 0 | 378 | 9 |
| B | 0 | 375 | 8 |
| C | 0 | 376 | 9 |
| D | 0 | 379 | 6 |
| Mode M0 | |||
|---|---|---|---|
| Quadrant | BADHDUFLAG | Total packets | Discarded packets |
| A | 0 | 46511 | 2264 |
| B | 0 | 51718 | 2747 |
| C | 0 | 101700 | 10274 |
| D | 0 | 57961 | 4181 |
| Mode M9 | |||
|---|---|---|---|
| Quadrant | BADHDUFLAG | Total packets | Discarded packets |
| A | 0 | 12 | 0 |
| B | 0 | 12 | 0 |
| C | 0 | 12 | 0 |
| D | 0 | 12 | 0 |
| Quadrant | Total seconds | Saturated seconds | Saturation percentage |
|---|---|---|---|
| A | 17644 | 768 | 4.352754% |
| B | 17535 | 1012 | 5.771315% |
| C | 16880 | 7473 | 44.271327% |
| D | 17382 | 1292 | 7.432977% |
Noise dominated data is calculated using 1-second bins in cleaned event files. If a bin has >2000 counts, and if more than 50% of those come from <1% of pixels, then it is considered to be noise-dominated and hence unusable.
| Quadrant | # 1 sec bins | Bins with >0 counts | Bins with >2000 counts | High rate bins dominated by noise | Noise dominated (total time) | Noise dominated (detector-on time) | Marked lightcurve |
|---|---|---|---|---|---|---|---|
| A | 19870 | 18133 | 424 | 424 | 2.13% | 2.34% | 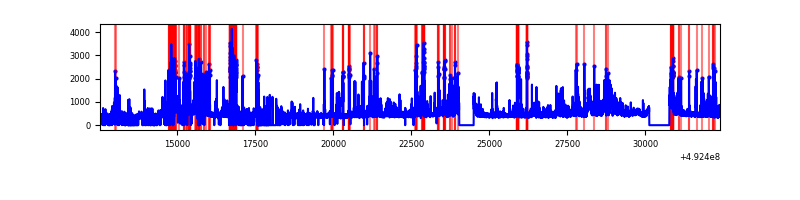 |
| B | 19870 | 18064 | 465 | 465 | 2.34% | 2.57% | 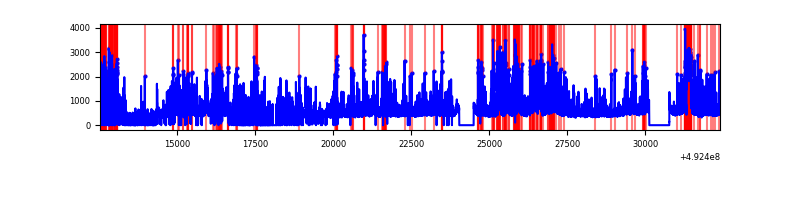 |
| C | 19870 | 17655 | 6210 | 6210 | 31.25% | 35.17% | 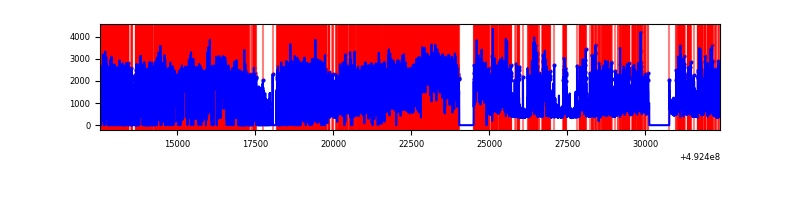 |
| D | 19870 | 17951 | 1139 | 1139 | 5.73% | 6.35% | 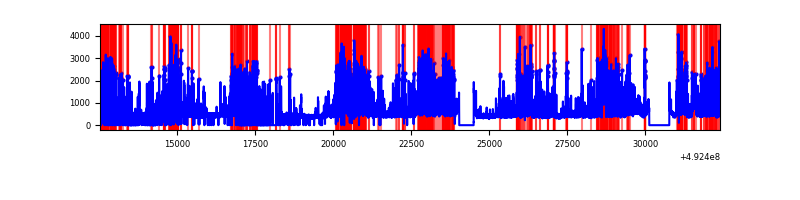 |
Top three noisy pixels from each quadrant. If the there are fewer than three noisy pixels in the level2.evt file, extra rows are filled as -1
| Pixel properties | Quadrant properties | ||||||
|---|---|---|---|---|---|---|---|
| Quadrant | DetID | PixID | Counts | Sigma | Mean | Median | Sigma |
| A | 15 | 174 | 793556 | 1715.35 | 1857 | 1811 | 461.6 |
| A | 12 | 115 | 665095 | 1437.03 | 1857 | 1811 | 461.6 |
| A | 14 | 254 | 349589 | 753.47 | 1857 | 1811 | 461.6 |
| B | 4 | 206 | 1434460 | 3698.0 | 1818 | 1753 | 387.4 |
| B | 10 | 28 | 997719 | 2570.72 | 1818 | 1753 | 387.4 |
| B | 2 | 249 | 815781 | 2101.11 | 1818 | 1753 | 387.4 |
| C | 15 | 178 | 9847922 | 25014.14 | 1438 | 1425 | 393.6 |
| C | 15 | 224 | 5692596 | 14457.91 | 1438 | 1425 | 393.6 |
| C | 15 | 158 | 4243295 | 10776.09 | 1438 | 1425 | 393.6 |
| D | 6 | 239 | 3411530 | 6827.55 | 1754 | 1673 | 499.4 |
| D | 0 | 18 | 1290319 | 2580.25 | 1754 | 1673 | 499.4 |
| D | 3 | 12 | 806360 | 1611.22 | 1754 | 1673 | 499.4 |
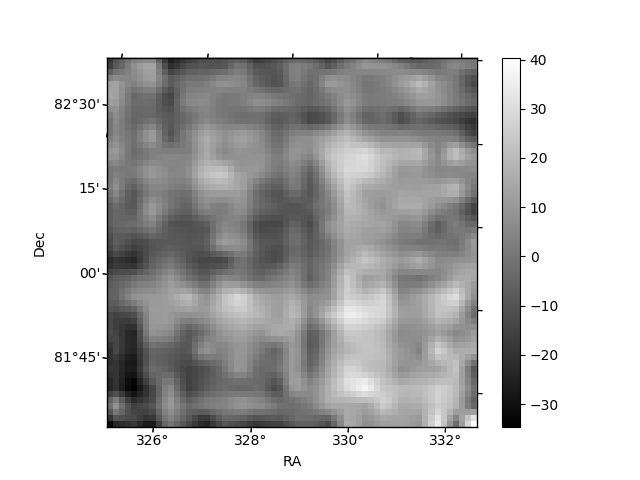
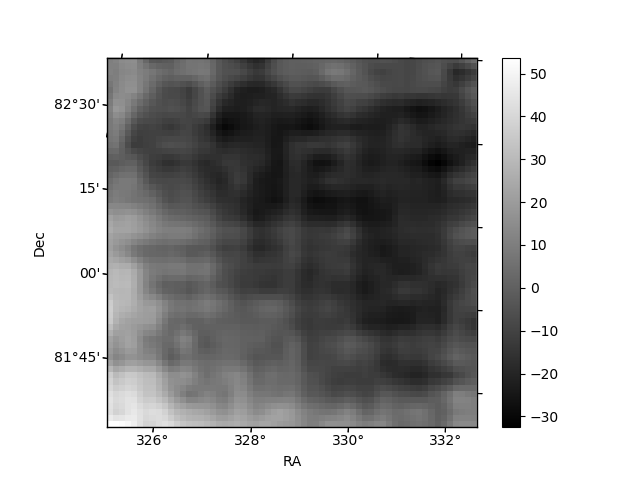
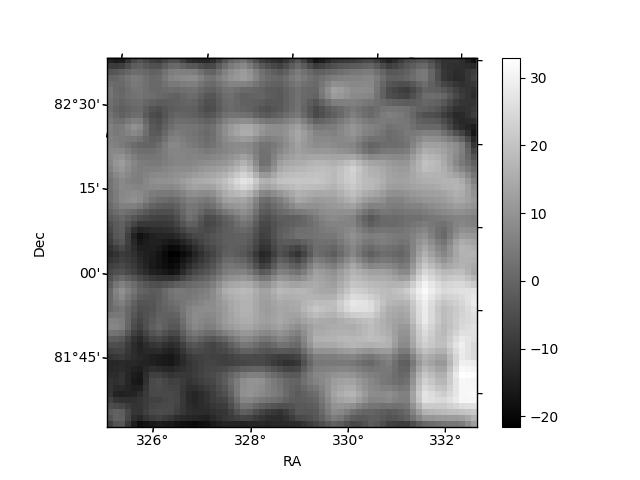
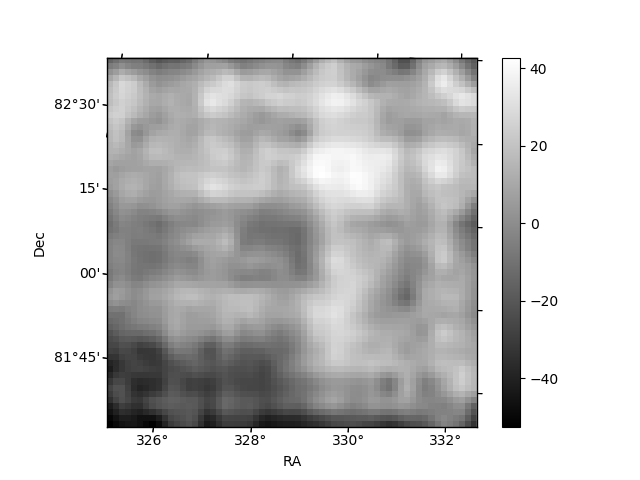
Histogram calculated using DETX and DETY for each event in the final _common_clean file
| Quadrant A | 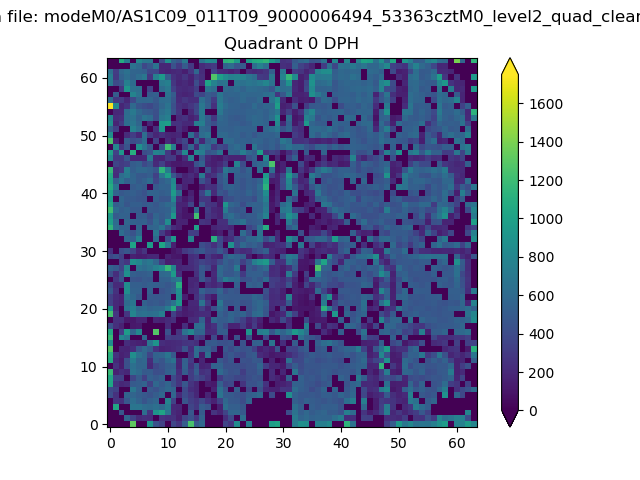 |
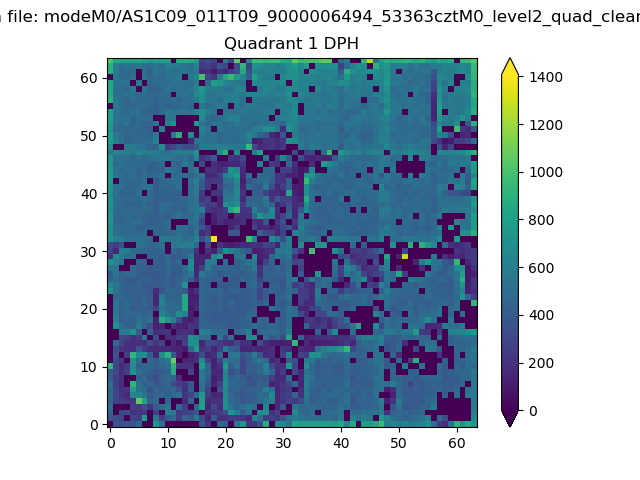 |
Quadrant B |
|---|---|---|---|
| Quadrant D |  |
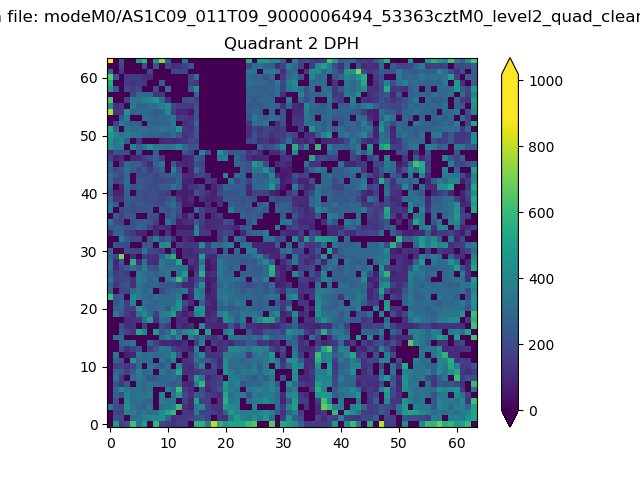 |
Quadrant C |
| Plot type | Count rate plots | Images |
|---|---|---|
| Comparison with Poisson distribution Blue bars denote a histogram of data divided into 1 sec bins. Red curve is a Poisson curve with rate = median count rate of data. |
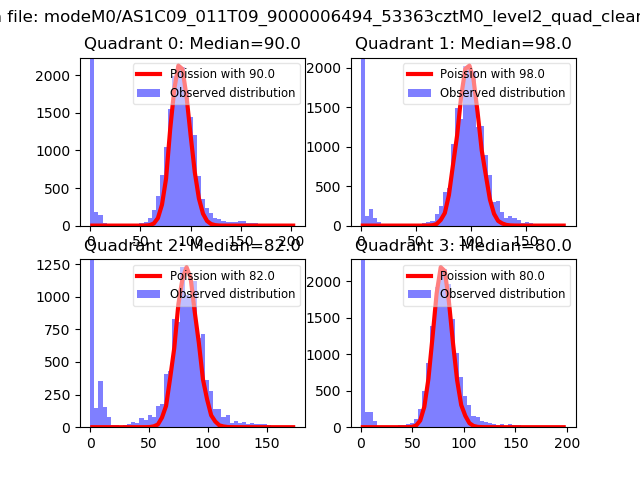 |
 |
| Quadrant-wise count rates Data is divided into 100 sec bins |
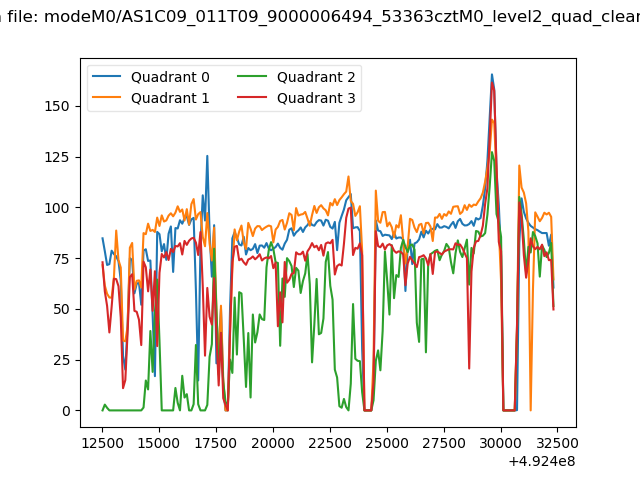 |
|
| Module-wise count rates for Quadrant A Data is divided into 100 sec bins |
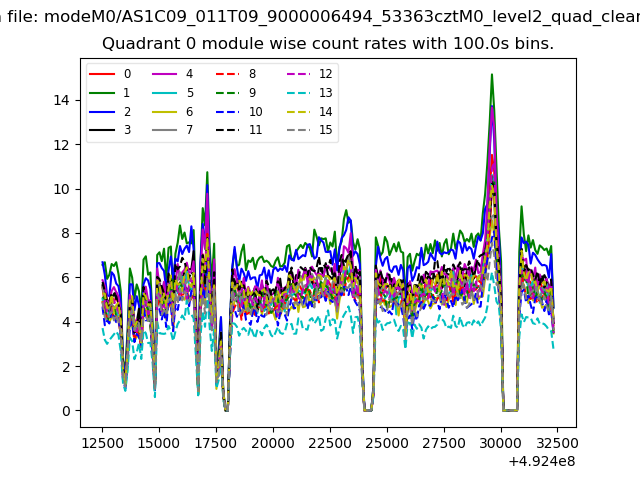 |
 |
| Module-wise count rates for Quadrant B Data is divided into 100 sec bins |
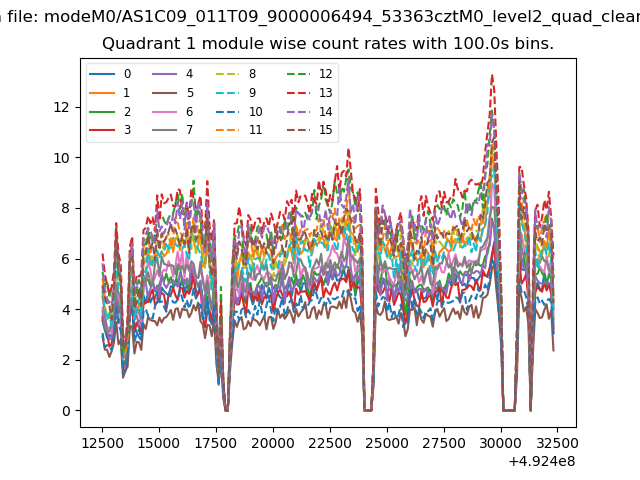 |
 |
| Module-wise count rates for Quadrant C Data is divided into 100 sec bins |
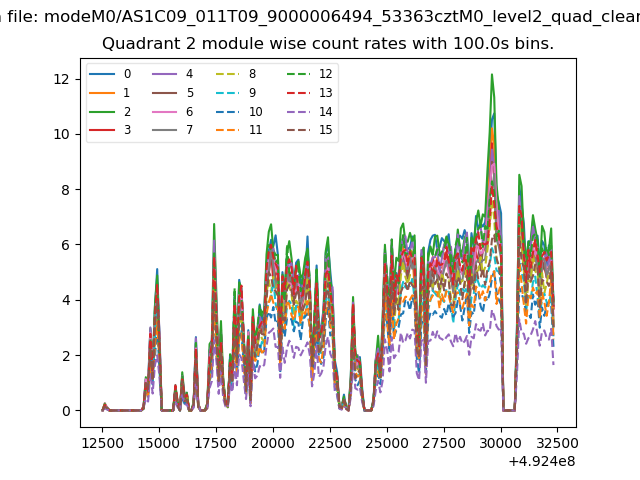 |
 |
| Module-wise count rates for Quadrant D Data is divided into 100 sec bins |
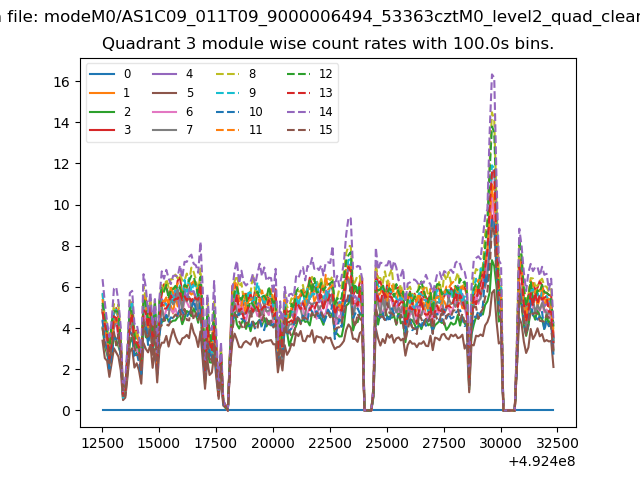 |
 |
| Parameter | Plot |
|---|---|
| CZT HV Monitor | 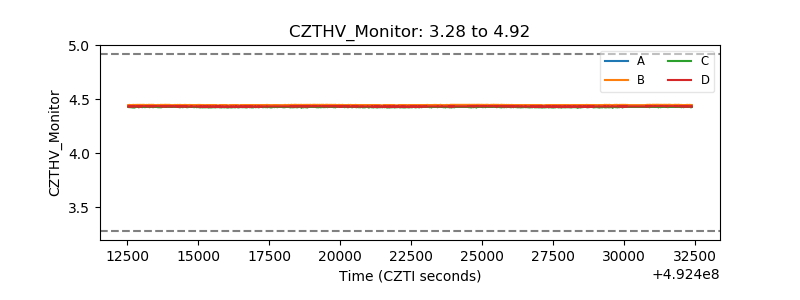 |
| D_VDD | 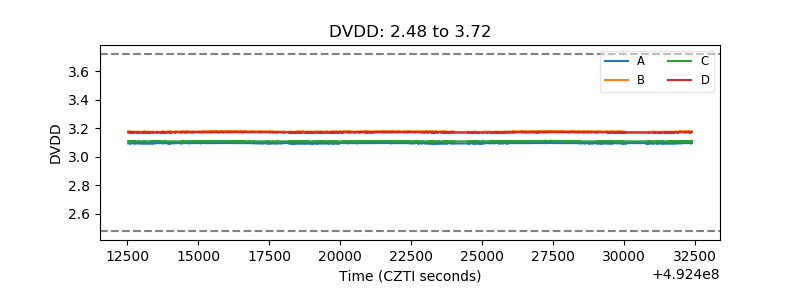 |
| Temperature 1 | 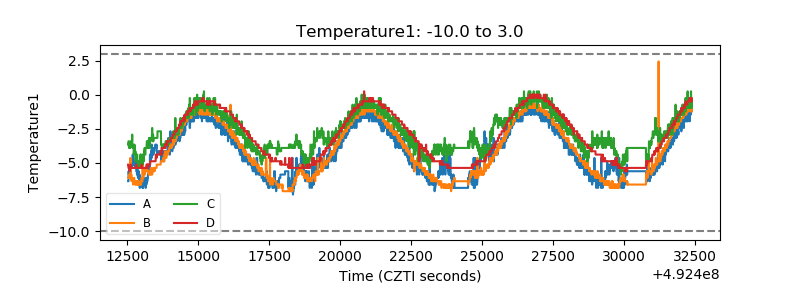 |
| Veto HV Monitor |  |
| Veto LLD | 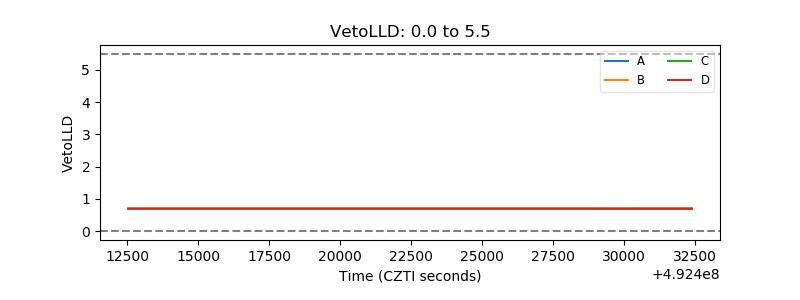 |
| Alpha Counter |  |
| _CPM_Rate | 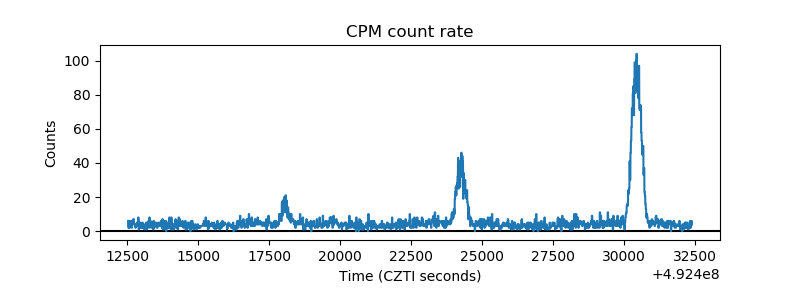 |
| CZT Counter | 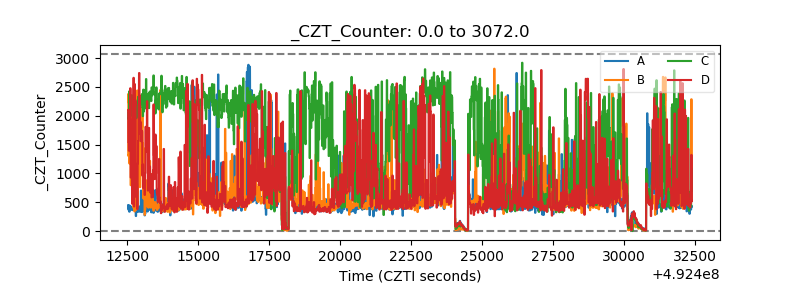 |
| +2.5 Volts monitor | 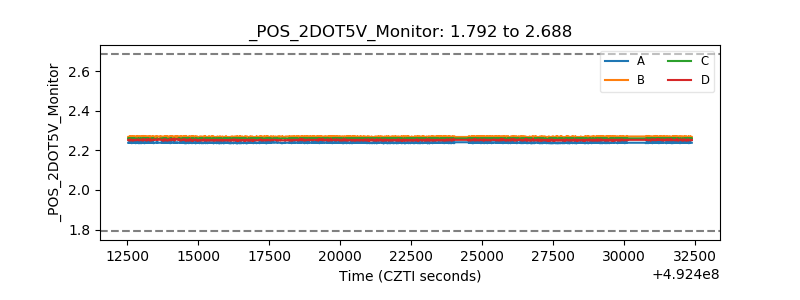 |
| +5 Volts monitor | 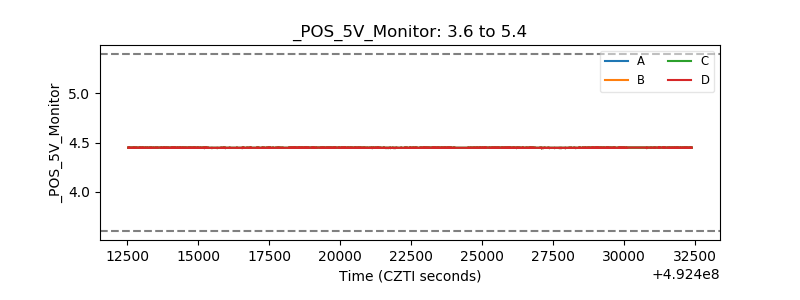 |
| _ROLL_ROT |  |
| _Roll_DEC | 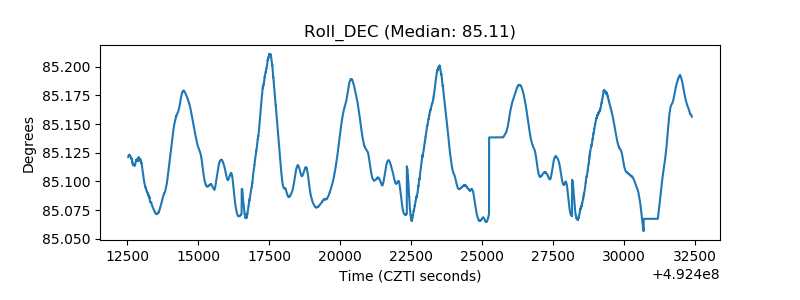 |
| _Roll_RA | 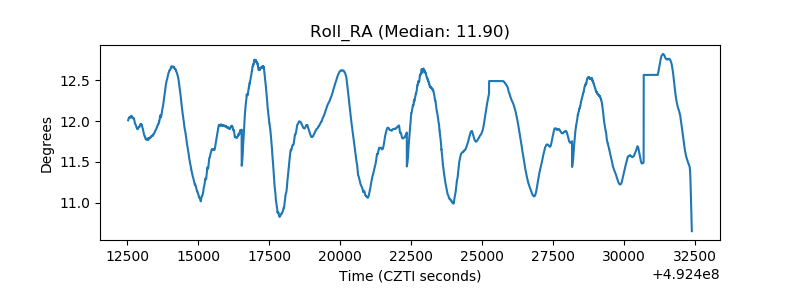 |
| Veto Counter | 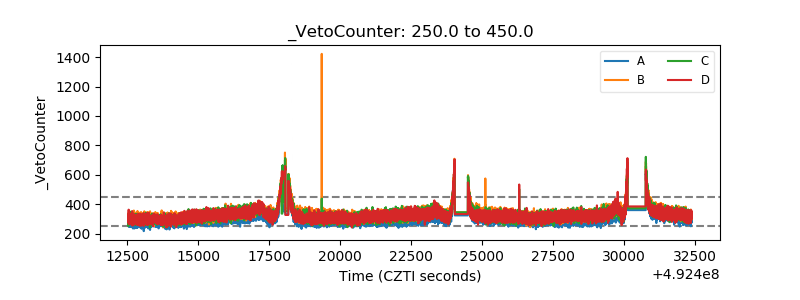 |