| Param | Original file | Final file |
|---|---|---|
| Filename | modeM0/AS1C09_011T09_9000006494_53366cztM0_level2.fits | modeM0/AS1C09_011T09_9000006494_53366cztM0_level2_quad_clean.evt |
| Size (bytes) | 503,395,200 | 91,794,240 |
| Size | 480.1 MB | 87.5 MB |
| Events in quadrant A | 3,470,561 | 616,696 |
| Events in quadrant B | 4,746,360 | 629,299 |
| Events in quadrant C | 6,094,181 | 538,536 |
| Events in quadrant D | 3,839,317 | 559,981 |
| Mode SS | |||
|---|---|---|---|
| Quadrant | BADHDUFLAG | Total packets | Discarded packets |
| A | 0 | 126 | 0 |
| B | 0 | 126 | 0 |
| C | 0 | 126 | 0 |
| D | 0 | 126 | 0 |
| Mode M0 | |||
|---|---|---|---|
| Quadrant | BADHDUFLAG | Total packets | Discarded packets |
| A | 0 | 14764 | 1 |
| B | 0 | 18317 | 1 |
| C | 0 | 22507 | 1 |
| D | 0 | 15674 | 1 |
| Mode M9 | |||
|---|---|---|---|
| Quadrant | BADHDUFLAG | Total packets | Discarded packets |
| A | 0 | 10 | 0 |
| B | 0 | 10 | 0 |
| C | 0 | 10 | 0 |
| D | 0 | 10 | 0 |
| Quadrant | Total seconds | Saturated seconds | Saturation percentage |
|---|---|---|---|
| A | 6231 | 198 | 3.177660% |
| B | 6232 | 490 | 7.862644% |
| C | 6232 | 701 | 11.248395% |
| D | 6232 | 103 | 1.652760% |
Noise dominated data is calculated using 1-second bins in cleaned event files. If a bin has >2000 counts, and if more than 50% of those come from <1% of pixels, then it is considered to be noise-dominated and hence unusable.
| Quadrant | # 1 sec bins | Bins with >0 counts | Bins with >2000 counts | High rate bins dominated by noise | Noise dominated (total time) | Noise dominated (detector-on time) | Marked lightcurve |
|---|---|---|---|---|---|---|---|
| A | 7196 | 6232 | 131 | 131 | 1.82% | 2.10% | 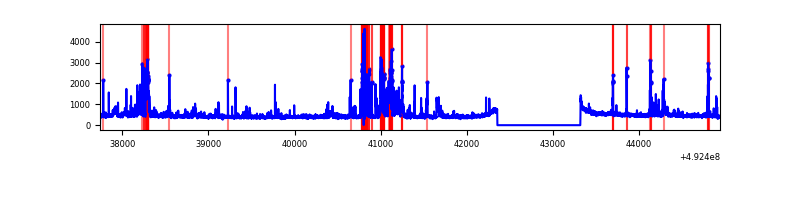 |
| B | 7197 | 6233 | 220 | 220 | 3.06% | 3.53% | 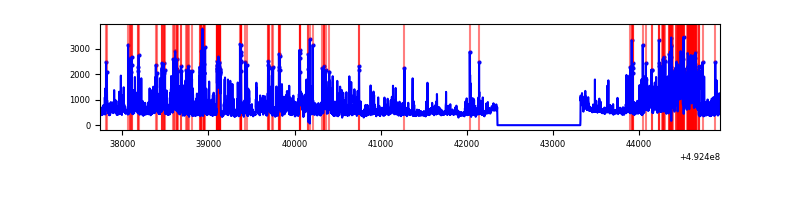 |
| C | 7197 | 6233 | 557 | 557 | 7.74% | 8.94% | 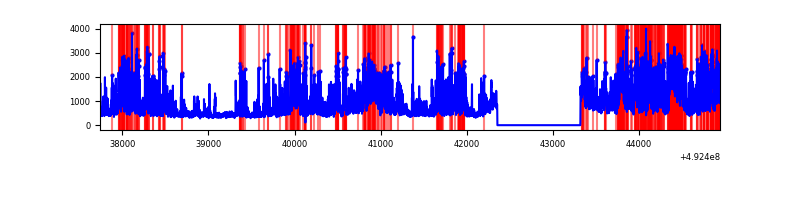 |
| D | 7197 | 6233 | 44 | 44 | 0.61% | 0.71% | 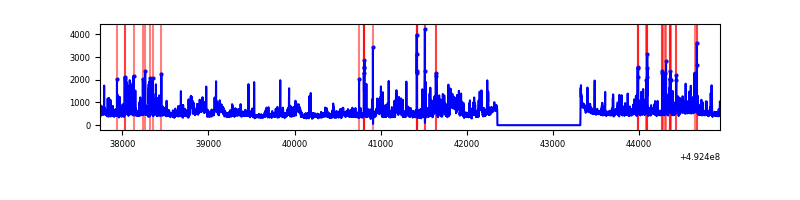 |
Top three noisy pixels from each quadrant. If the there are fewer than three noisy pixels in the level2.evt file, extra rows are filled as -1
| Pixel properties | Quadrant properties | ||||||
|---|---|---|---|---|---|---|---|
| Quadrant | DetID | PixID | Counts | Sigma | Mean | Median | Sigma |
| A | 15 | 174 | 651273 | 3905.61 | 669 | 653 | 166.6 |
| A | 14 | 254 | 33685 | 198.29 | 669 | 653 | 166.6 |
| A | 5 | 240 | 26842 | 157.21 | 669 | 653 | 166.6 |
| B | 4 | 206 | 906930 | 6576.47 | 650 | 629 | 137.8 |
| B | 4 | 171 | 483752 | 3505.73 | 650 | 629 | 137.8 |
| B | 10 | 28 | 222546 | 1610.32 | 650 | 629 | 137.8 |
| C | 15 | 224 | 1721527 | 10021.06 | 628 | 623 | 171.7 |
| C | 15 | 178 | 1143870 | 6657.29 | 628 | 623 | 171.7 |
| C | 15 | 158 | 244665 | 1421.09 | 628 | 623 | 171.7 |
| D | 0 | 18 | 488484 | 2613.58 | 655 | 627 | 186.7 |
| D | 2 | 249 | 129170 | 688.64 | 655 | 627 | 186.7 |
| D | 2 | 153 | 108894 | 580.01 | 655 | 627 | 186.7 |
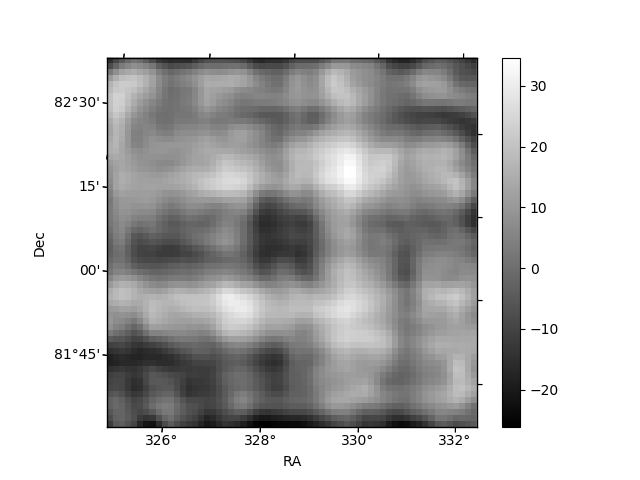
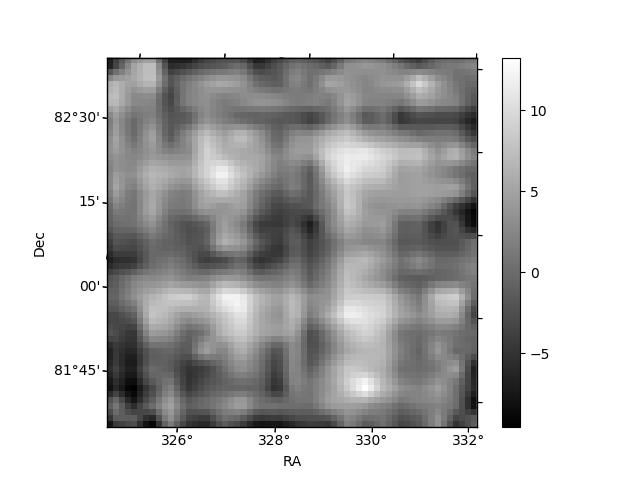
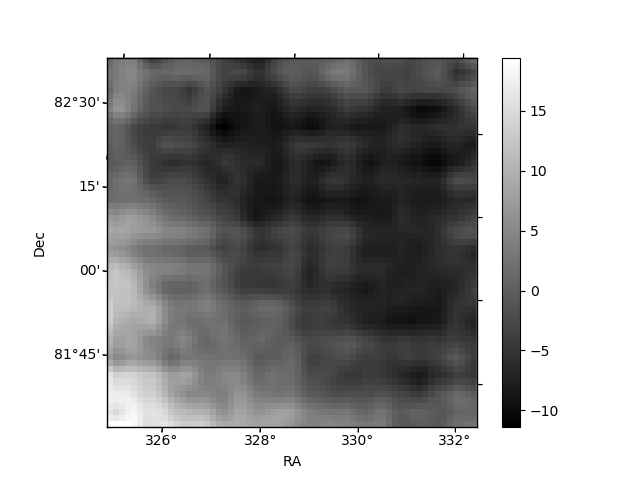
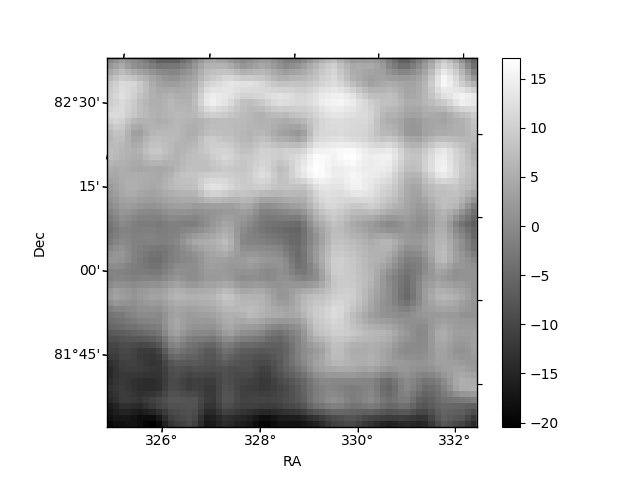
Histogram calculated using DETX and DETY for each event in the final _common_clean file
| Quadrant A | 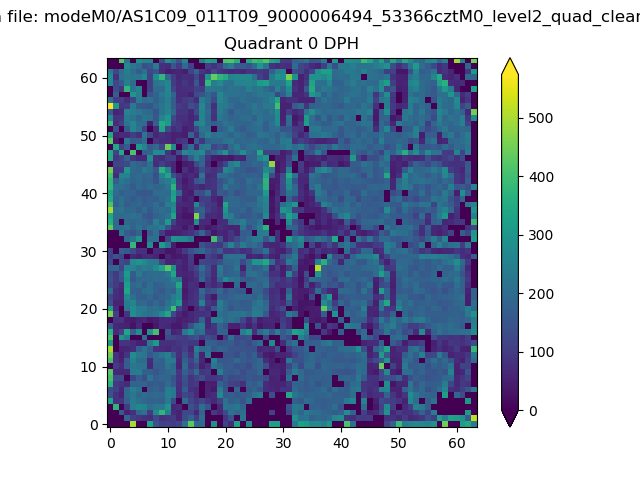 |
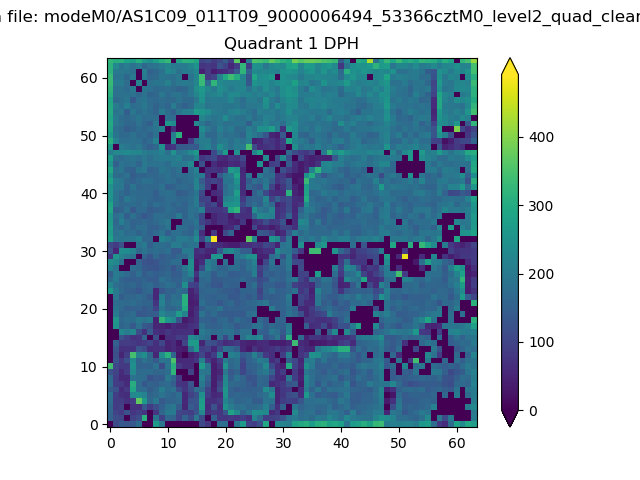 |
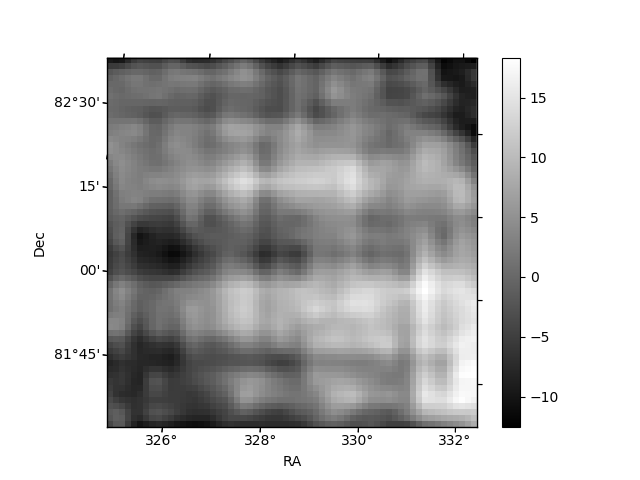
Quadrant B |
|---|---|---|---|
| Quadrant D |  |
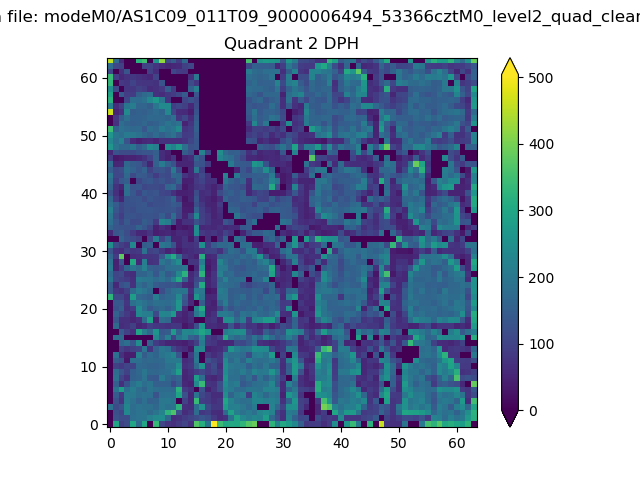 |
Quadrant C |
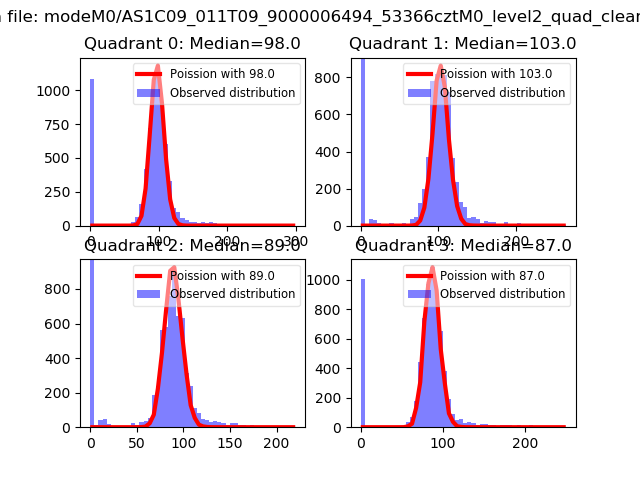
| Plot type | Count rate plots | Images |
|---|---|---|
| Comparison with Poisson distribution Blue bars denote a histogram of data divided into 1 sec bins. Red curve is a Poisson curve with rate = median count rate of data. |
 |
 |
| Quadrant-wise count rates Data is divided into 100 sec bins |
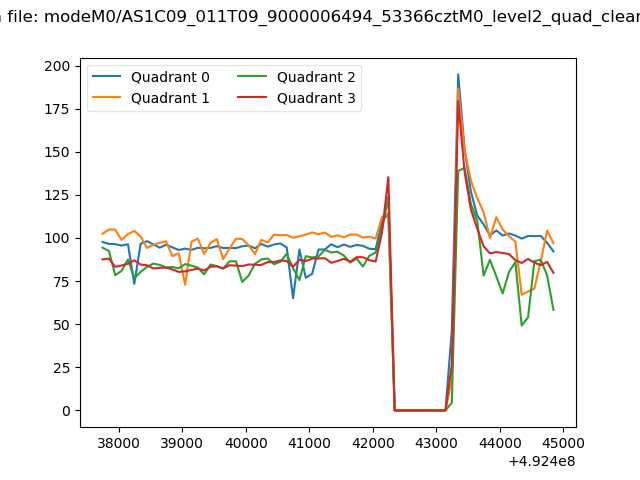 |
|
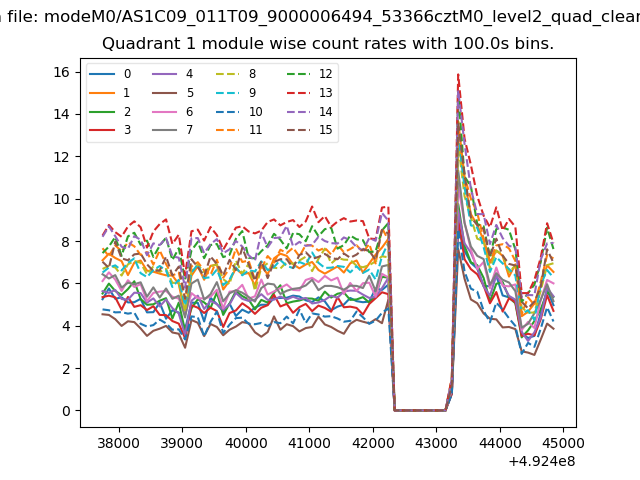
| Module-wise count rates for Quadrant A Data is divided into 100 sec bins |
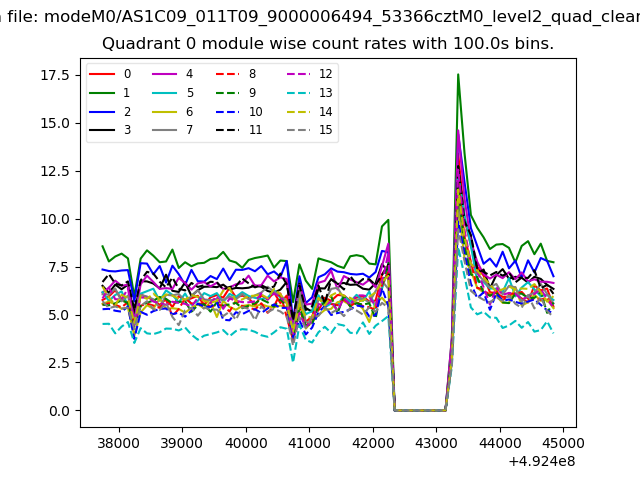 |
 |
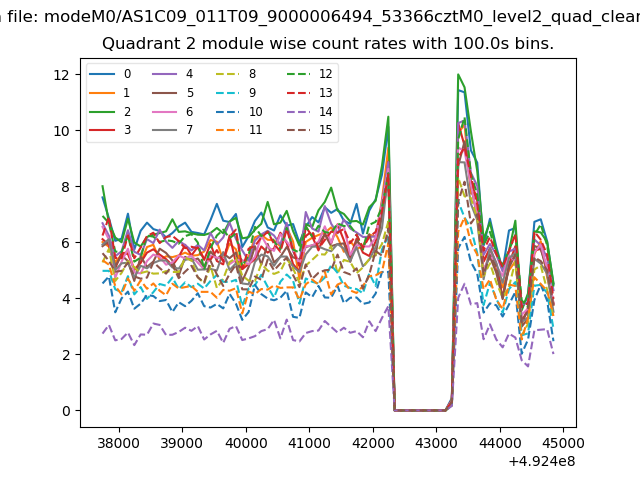
| Module-wise count rates for Quadrant B Data is divided into 100 sec bins |
 |
 |
| Module-wise count rates for Quadrant C Data is divided into 100 sec bins |
 |
 |
| Module-wise count rates for Quadrant D Data is divided into 100 sec bins |
 |
 |
| Parameter | Plot |
|---|---|
| CZT HV Monitor |  |
| D_VDD | 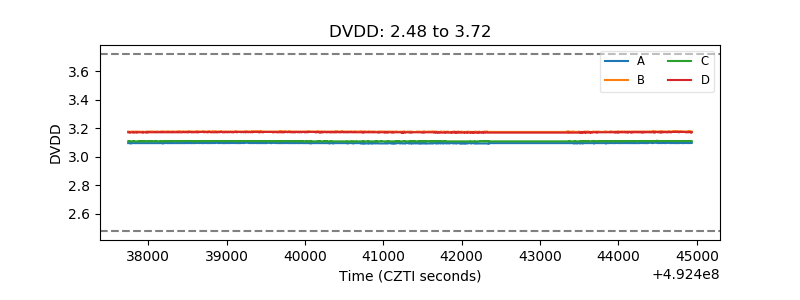 |
| Temperature 1 | 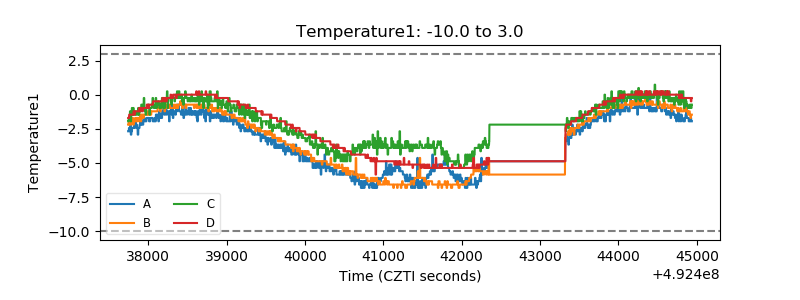 |
| Veto HV Monitor | 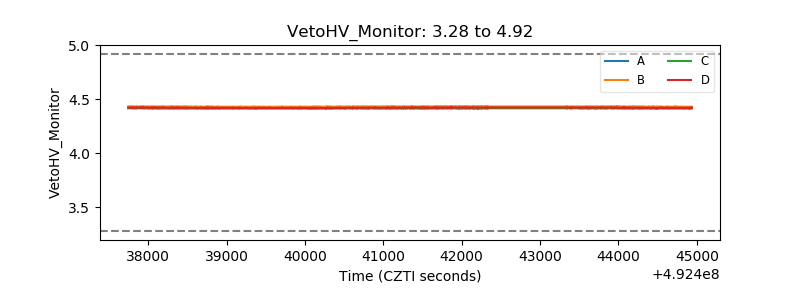 |
| Veto LLD | 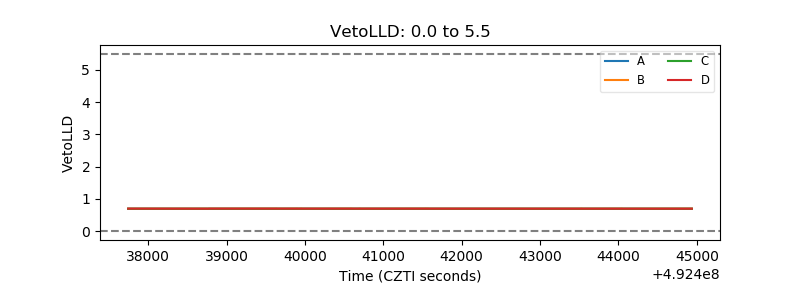 |
| Alpha Counter | 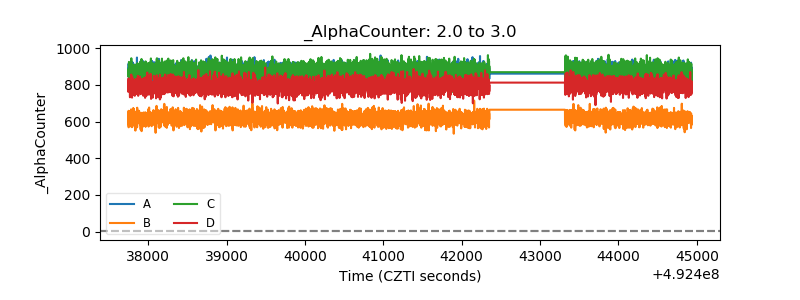 |
| _CPM_Rate | 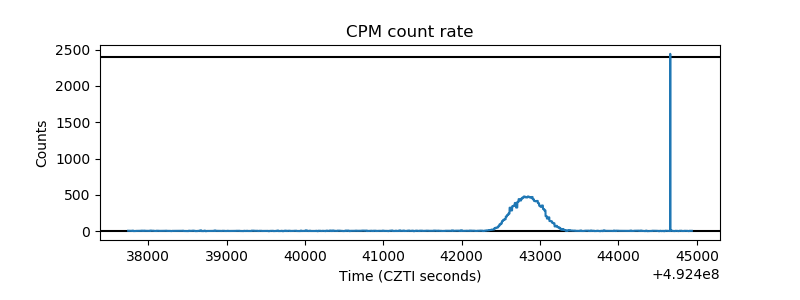 |
| CZT Counter | 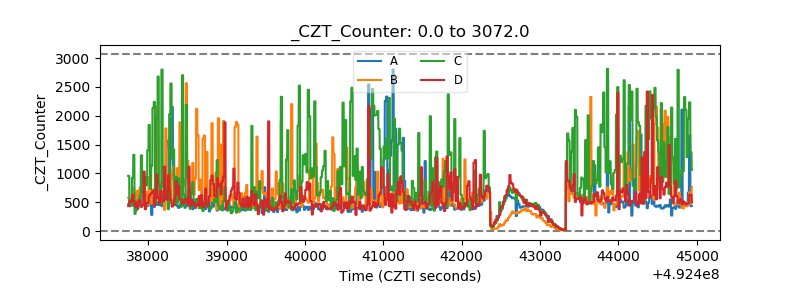 |
| +2.5 Volts monitor |  |
| +5 Volts monitor |  |
| _ROLL_ROT | 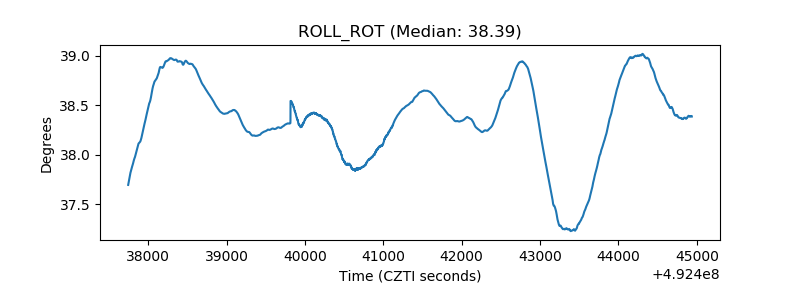 |
| _Roll_DEC | 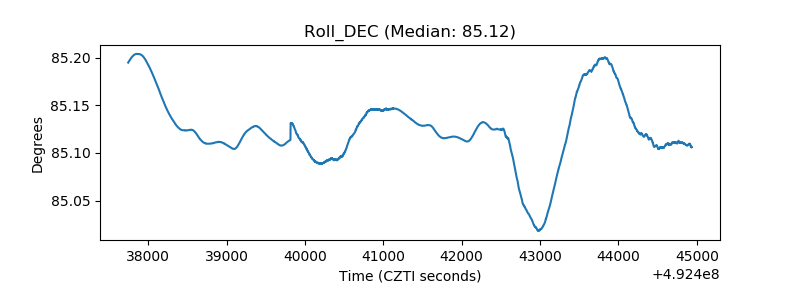 |
| _Roll_RA | 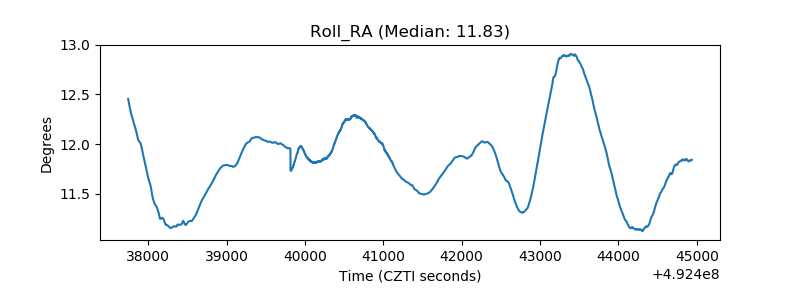 |
| Veto Counter | 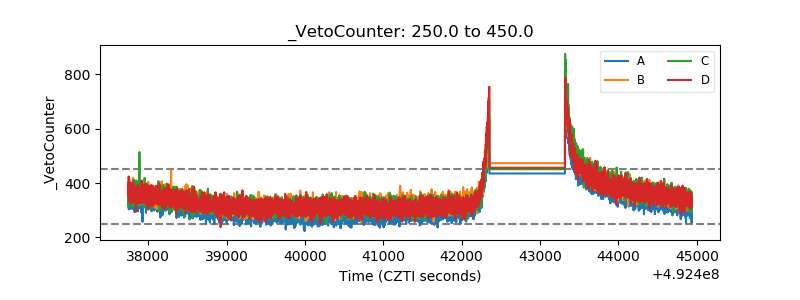 |