| Param | Original file | Final file |
|---|---|---|
| Filename | modeM0/AS1C09_011T09_9000006494_53370cztM0_level2.fits | modeM0/AS1C09_011T09_9000006494_53370cztM0_level2_quad_clean.evt |
| Size (bytes) | 723,257,280 | 91,500,480 |
| Size | 689.8 MB | 87.3 MB |
| Events in quadrant A | 3,710,289 | 624,747 |
| Events in quadrant B | 5,544,610 | 666,881 |
| Events in quadrant C | 9,488,866 | 491,581 |
| Events in quadrant D | 7,519,204 | 527,100 |
| Mode SS | |||
|---|---|---|---|
| Quadrant | BADHDUFLAG | Total packets | Discarded packets |
| A | 0 | 134 | 0 |
| B | 0 | 134 | 0 |
| C | 0 | 134 | 0 |
| D | 0 | 134 | 0 |
| Mode M0 | |||
|---|---|---|---|
| Quadrant | BADHDUFLAG | Total packets | Discarded packets |
| A | 0 | 15968 | 2 |
| B | 0 | 21066 | 2 |
| C | 0 | 32816 | 2 |
| D | 0 | 26817 | 3 |
| Mode M9 | |||
|---|---|---|---|
| Quadrant | BADHDUFLAG | Total packets | Discarded packets |
| A | 0 | 14 | 0 |
| B | 0 | 15 | 0 |
| C | 0 | 15 | 0 |
| D | 0 | 15 | 0 |
| Quadrant | Total seconds | Saturated seconds | Saturation percentage |
|---|---|---|---|
| A | 6595 | 293 | 4.442760% |
| B | 6595 | 438 | 6.641395% |
| C | 6595 | 1733 | 26.277483% |
| D | 6594 | 924 | 14.012739% |
Noise dominated data is calculated using 1-second bins in cleaned event files. If a bin has >2000 counts, and if more than 50% of those come from <1% of pixels, then it is considered to be noise-dominated and hence unusable.
| Quadrant | # 1 sec bins | Bins with >0 counts | Bins with >2000 counts | High rate bins dominated by noise | Noise dominated (total time) | Noise dominated (detector-on time) | Marked lightcurve |
|---|---|---|---|---|---|---|---|
| A | 7685 | 6596 | 173 | 173 | 2.25% | 2.62% | 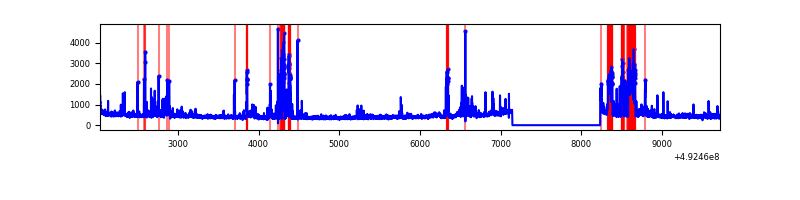 |
| B | 7685 | 6596 | 213 | 213 | 2.77% | 3.23% | 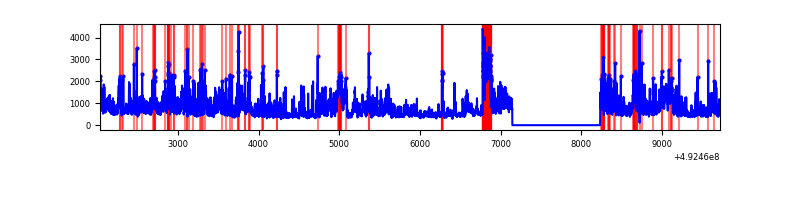 |
| C | 7685 | 6596 | 1661 | 1661 | 21.61% | 25.18% | 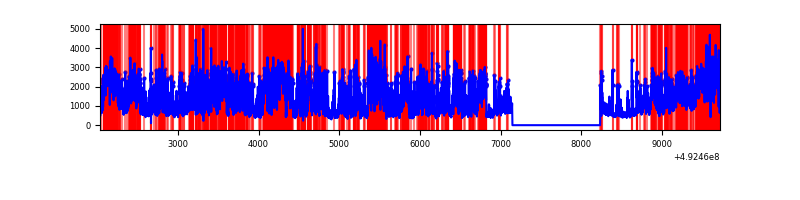 |
| D | 7684 | 6595 | 882 | 882 | 11.48% | 13.37% | 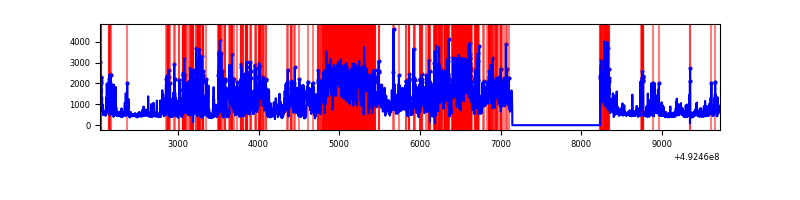 |
Top three noisy pixels from each quadrant. If the there are fewer than three noisy pixels in the level2.evt file, extra rows are filled as -1
| Pixel properties | Quadrant properties | ||||||
|---|---|---|---|---|---|---|---|
| Quadrant | DetID | PixID | Counts | Sigma | Mean | Median | Sigma |
| A | 15 | 174 | 707105 | 4183.37 | 683 | 665 | 168.9 |
| A | 3 | 61 | 63047 | 369.41 | 683 | 665 | 168.9 |
| A | 8 | 6 | 49948 | 291.84 | 683 | 665 | 168.9 |
| B | 10 | 254 | 1031580 | 7130.04 | 679 | 654 | 144.6 |
| B | 4 | 171 | 467003 | 3225.34 | 679 | 654 | 144.6 |
| B | 0 | 171 | 355801 | 2456.25 | 679 | 654 | 144.6 |
| C | 15 | 178 | 4181801 | 24474.9 | 622 | 616 | 170.8 |
| C | 15 | 224 | 1156065 | 6763.51 | 622 | 616 | 170.8 |
| C | 15 | 147 | 673559 | 3939.12 | 622 | 616 | 170.8 |
| D | 0 | 18 | 2665386 | 14508.46 | 651 | 623 | 183.7 |
| D | 11 | 245 | 1376533 | 7491.22 | 651 | 623 | 183.7 |
| D | 2 | 249 | 149859 | 812.52 | 651 | 623 | 183.7 |
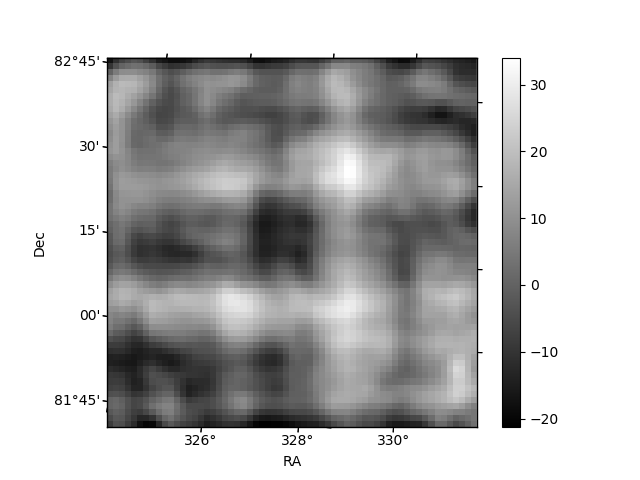
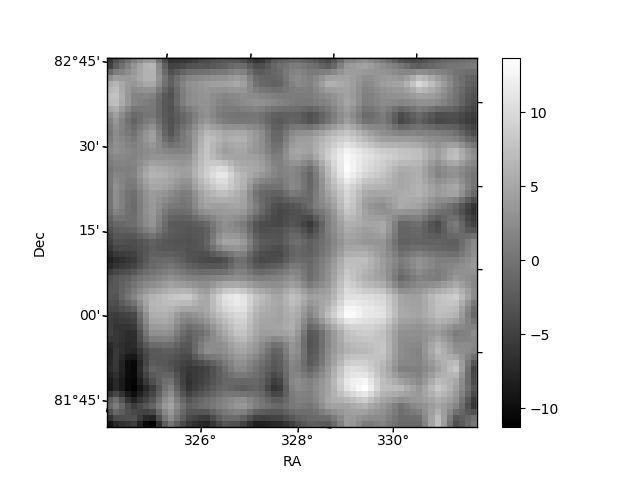
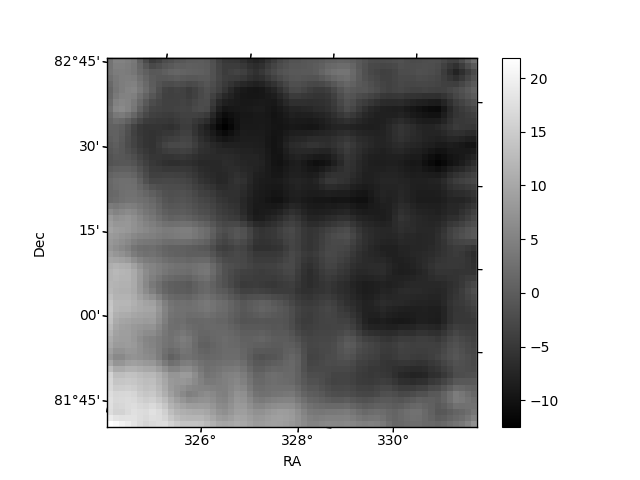
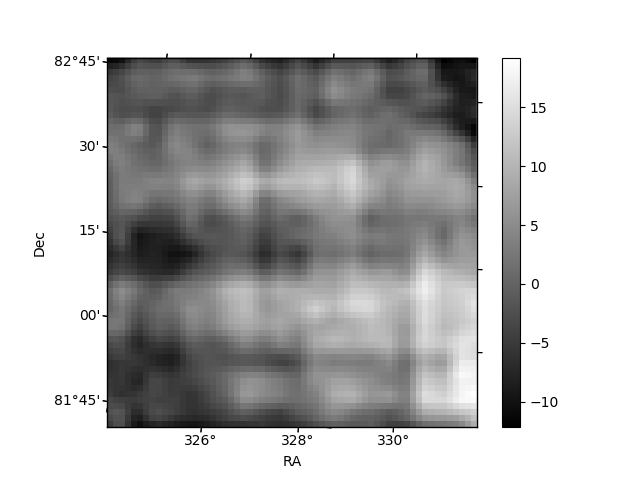
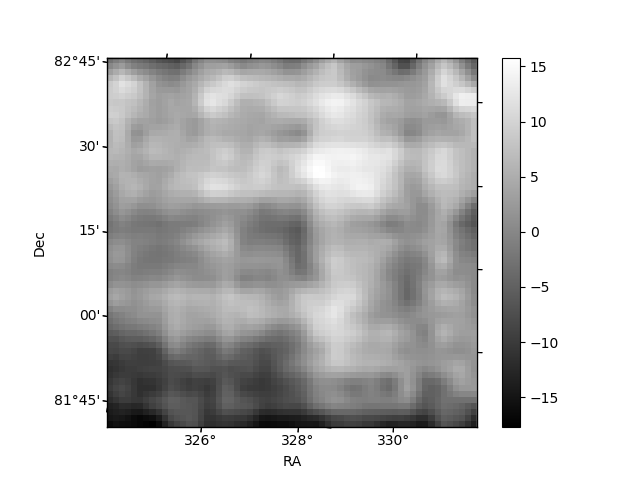
Histogram calculated using DETX and DETY for each event in the final _common_clean file
| Quadrant A | 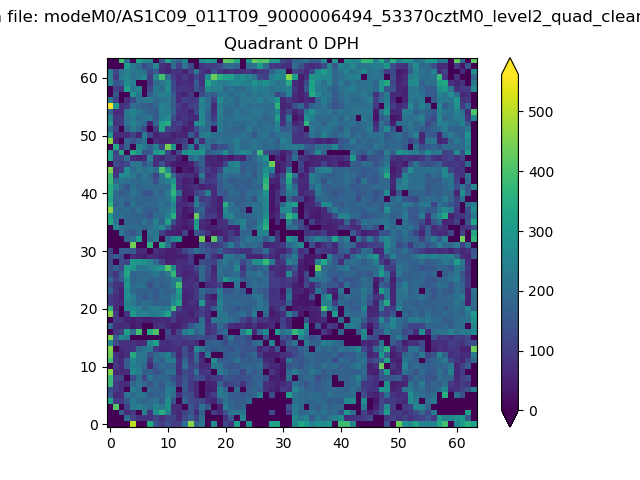 |
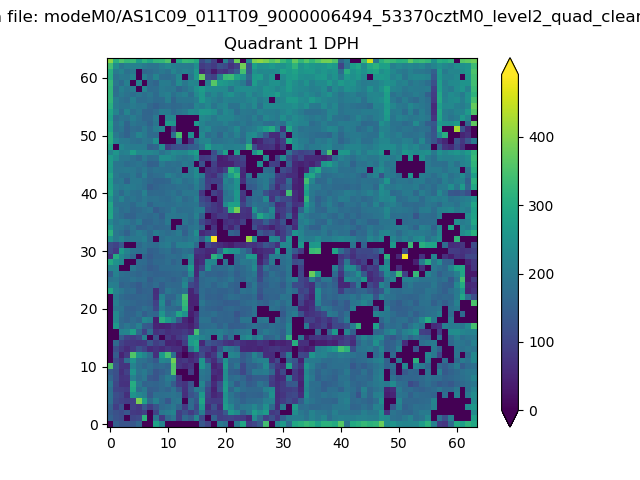 |
Quadrant B |
|---|---|---|---|
| Quadrant D | 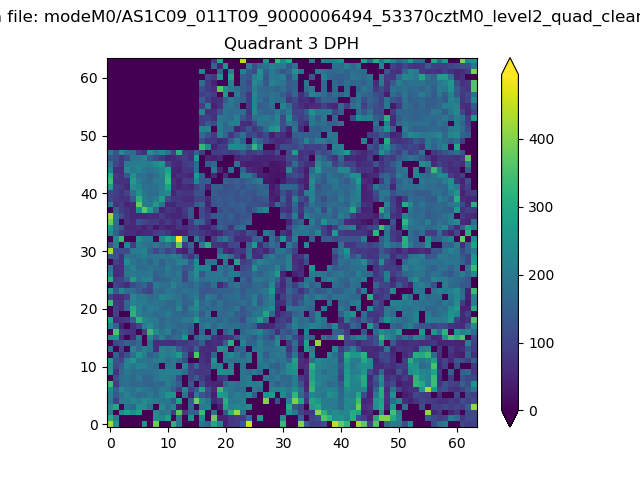 |
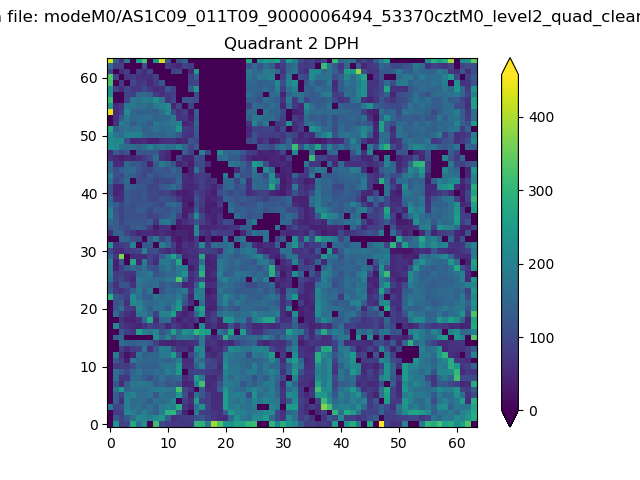 |
Quadrant C |
| Plot type | Count rate plots | Images |
|---|---|---|
| Comparison with Poisson distribution Blue bars denote a histogram of data divided into 1 sec bins. Red curve is a Poisson curve with rate = median count rate of data. |
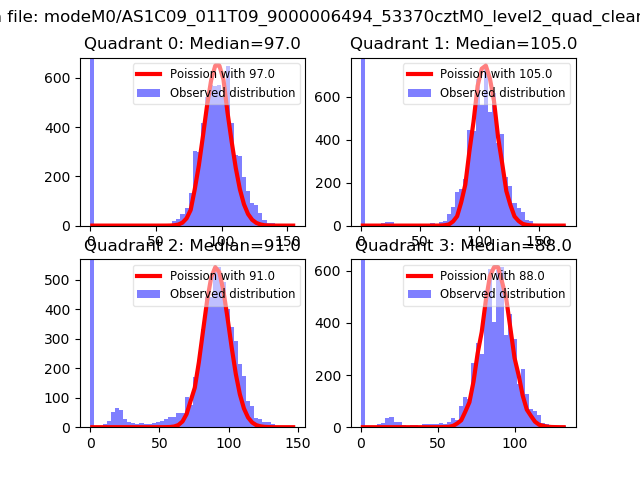 |
 |
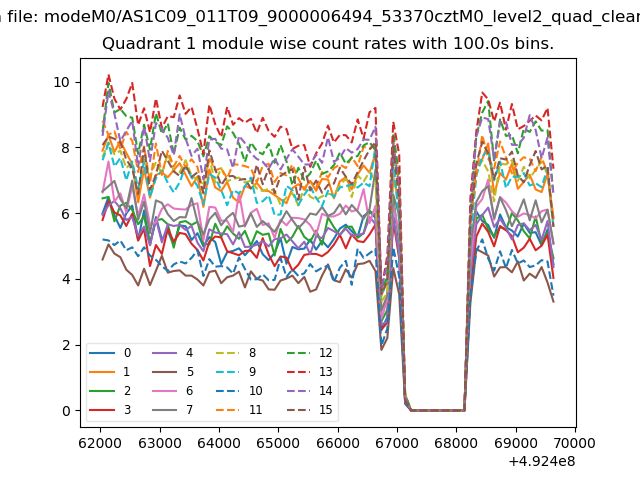
| Quadrant-wise count rates Data is divided into 100 sec bins |
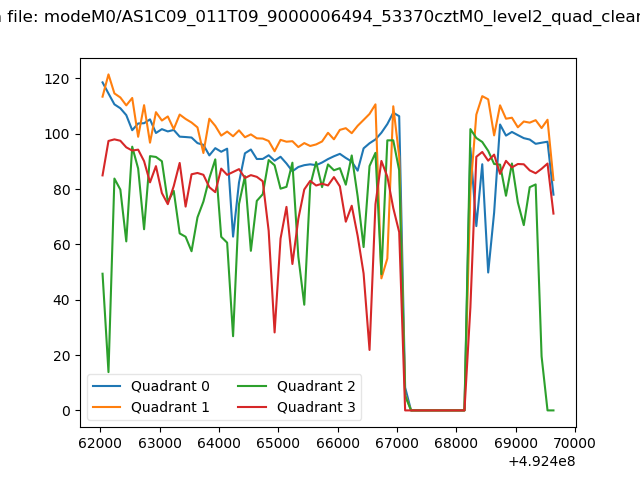 |
|
| Module-wise count rates for Quadrant A Data is divided into 100 sec bins |
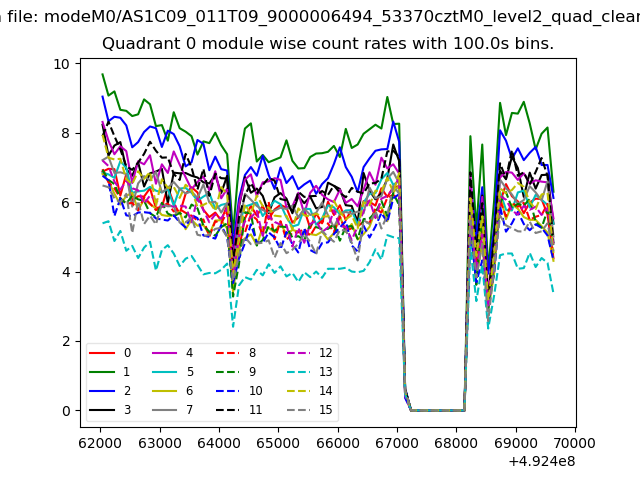 |
 |
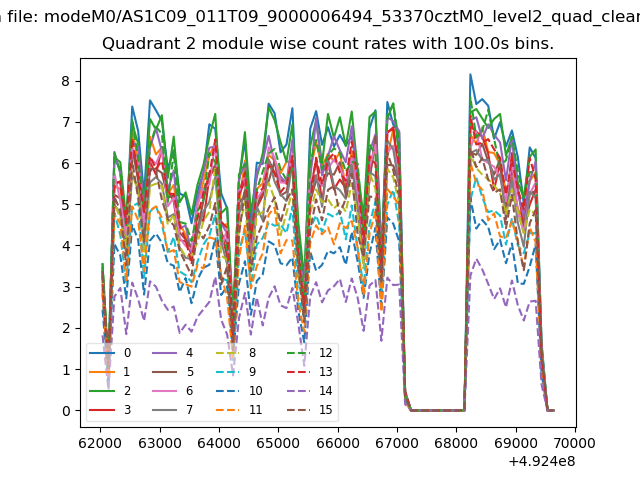
| Module-wise count rates for Quadrant B Data is divided into 100 sec bins |
 |
 |
| Module-wise count rates for Quadrant C Data is divided into 100 sec bins |
 |
 |
| Module-wise count rates for Quadrant D Data is divided into 100 sec bins |
 |
 |
| Parameter | Plot |
|---|---|
| CZT HV Monitor | 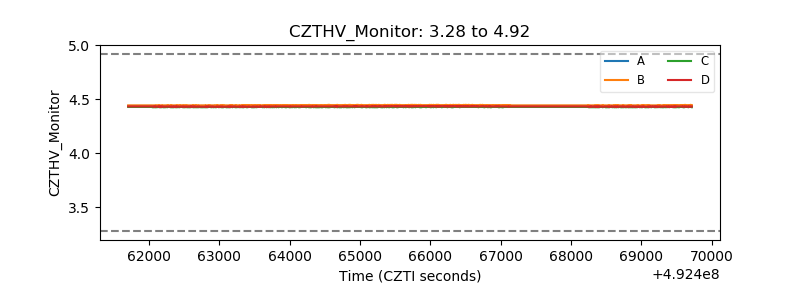 |
| D_VDD | 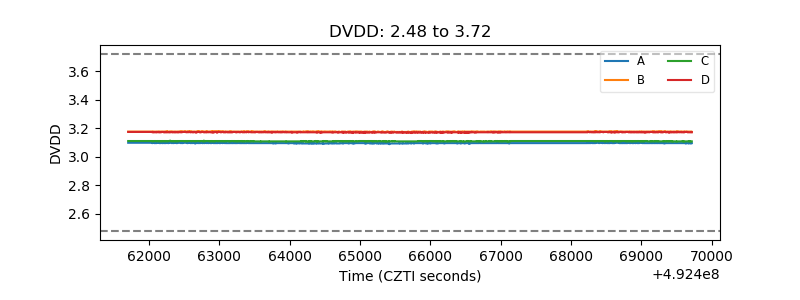 |
| Temperature 1 | 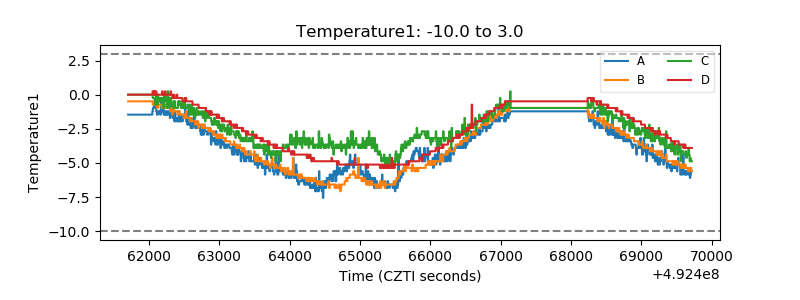 |
| Veto HV Monitor | 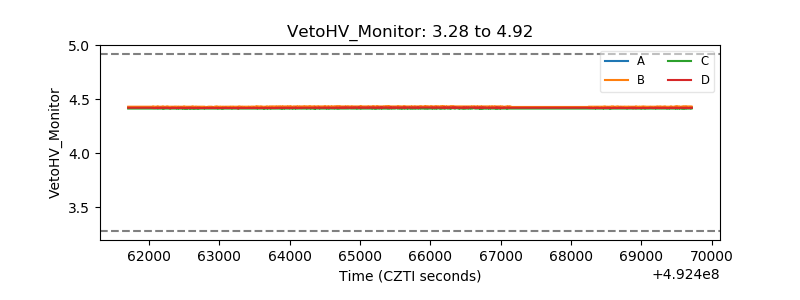 |
| Veto LLD | 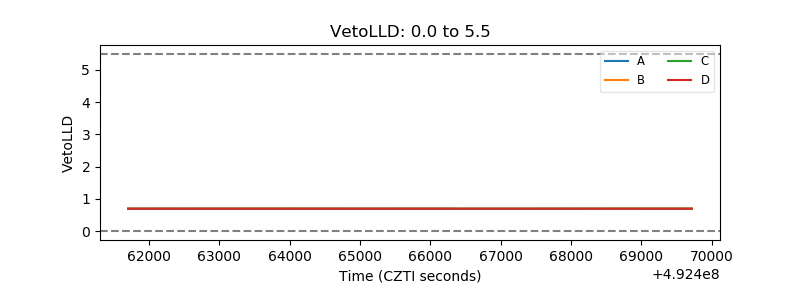 |
| Alpha Counter | 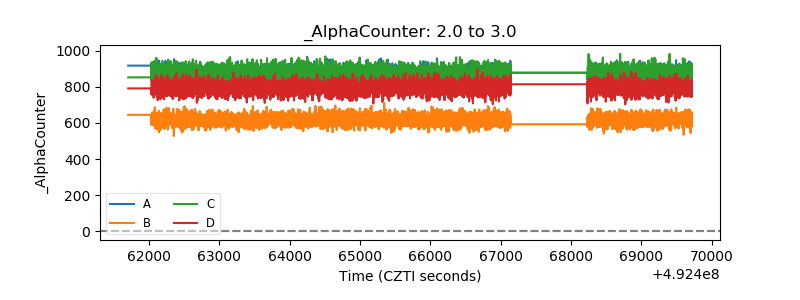 |
| _CPM_Rate | 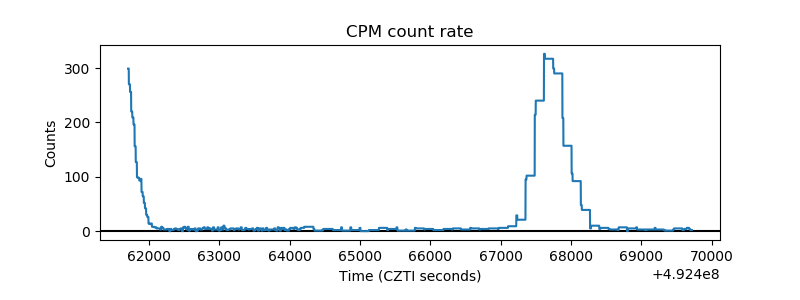 |
| CZT Counter | 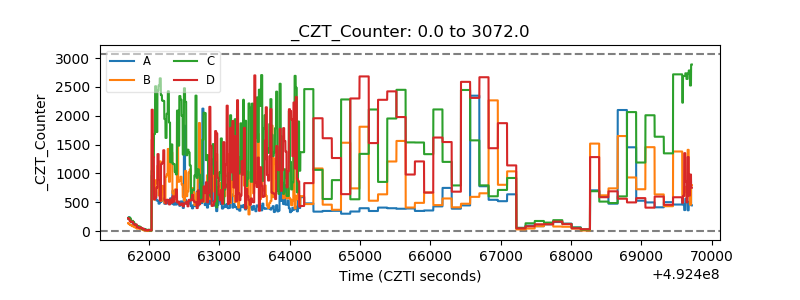 |
| +2.5 Volts monitor | 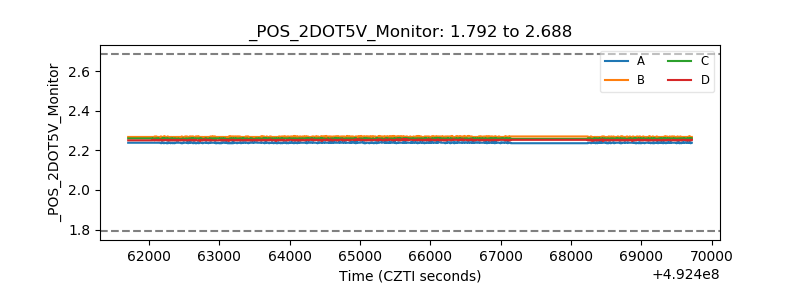 |
| +5 Volts monitor |  |
| _ROLL_ROT | 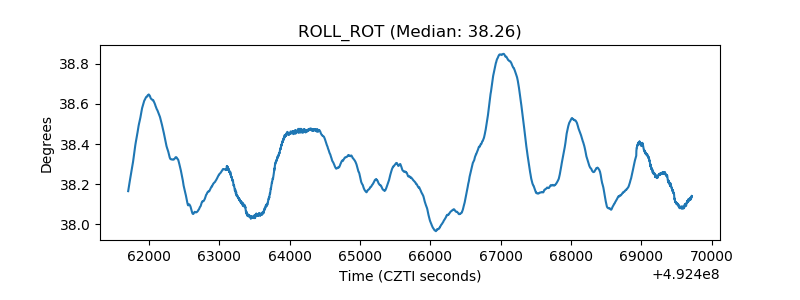 |
| _Roll_DEC | 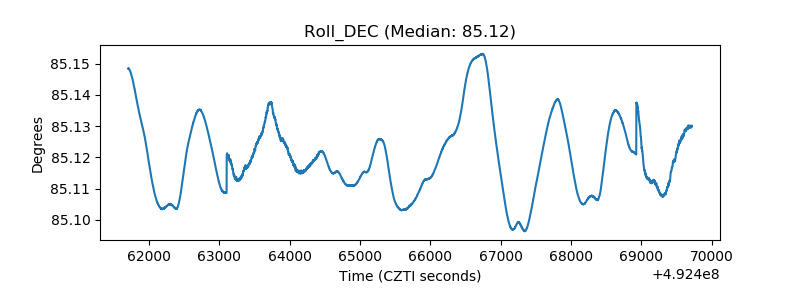 |
| _Roll_RA | 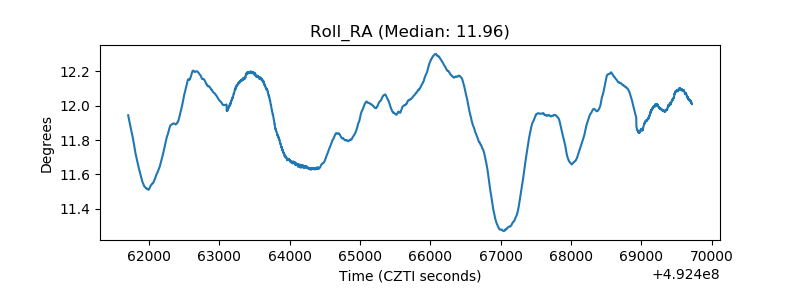 |
| Veto Counter | 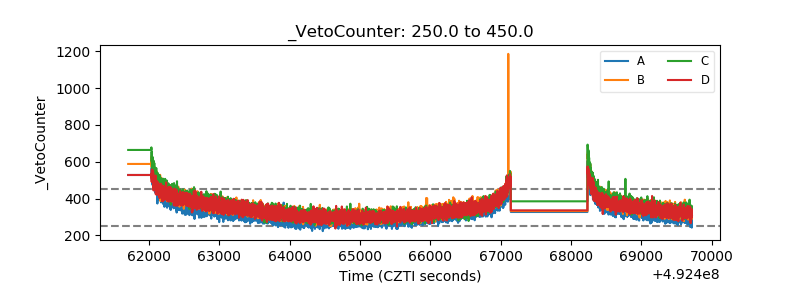 |