| Param | Original file | Final file |
|---|---|---|
| Filename | modeM0/AS1C09_011T09_9000006494_53372cztM0_level2.fits | modeM0/AS1C09_011T09_9000006494_53372cztM0_level2_quad_clean.evt |
| Size (bytes) | 801,463,680 | 95,230,080 |
| Size | 764.3 MB | 90.8 MB |
| Events in quadrant A | 3,678,786 | 709,265 |
| Events in quadrant B | 5,606,134 | 719,962 |
| Events in quadrant C | 15,247,552 | 294,484 |
| Events in quadrant D | 4,558,099 | 641,901 |
| Mode SS | |||
|---|---|---|---|
| Quadrant | BADHDUFLAG | Total packets | Discarded packets |
| A | 0 | 150 | 0 |
| B | 0 | 150 | 0 |
| C | 0 | 150 | 0 |
| D | 0 | 150 | 0 |
| Mode M0 | |||
|---|---|---|---|
| Quadrant | BADHDUFLAG | Total packets | Discarded packets |
| A | 0 | 16589 | 6 |
| B | 0 | 22049 | 5 |
| C | 0 | 50459 | 2 |
| D | 0 | 18897 | 5 |
| Mode M9 | |||
|---|---|---|---|
| Quadrant | BADHDUFLAG | Total packets | Discarded packets |
| A | 0 | 6 | 0 |
| B | 0 | 6 | 0 |
| C | 0 | 7 | 0 |
| D | 0 | 7 | 0 |
| Quadrant | Total seconds | Saturated seconds | Saturation percentage |
|---|---|---|---|
| A | 7439 | 104 | 1.398037% |
| B | 7440 | 615 | 8.266129% |
| C | 7441 | 4698 | 63.136675% |
| D | 7439 | 137 | 1.841645% |
Noise dominated data is calculated using 1-second bins in cleaned event files. If a bin has >2000 counts, and if more than 50% of those come from <1% of pixels, then it is considered to be noise-dominated and hence unusable.
| Quadrant | # 1 sec bins | Bins with >0 counts | Bins with >2000 counts | High rate bins dominated by noise | Noise dominated (total time) | Noise dominated (detector-on time) | Marked lightcurve |
|---|---|---|---|---|---|---|---|
| A | 7811 | 7441 | 64 | 64 | 0.82% | 0.86% | 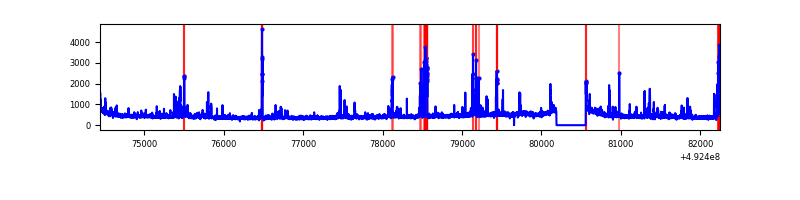 |
| B | 7811 | 7442 | 321 | 321 | 4.11% | 4.31% | 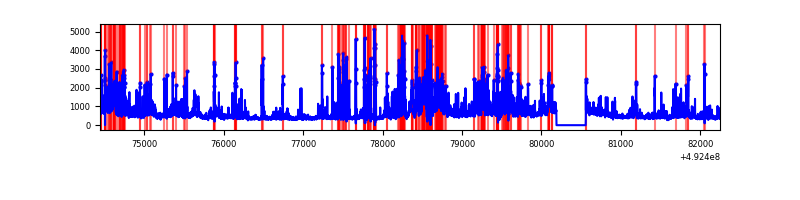 |
| C | 7811 | 7442 | 4205 | 4205 | 53.83% | 56.50% | 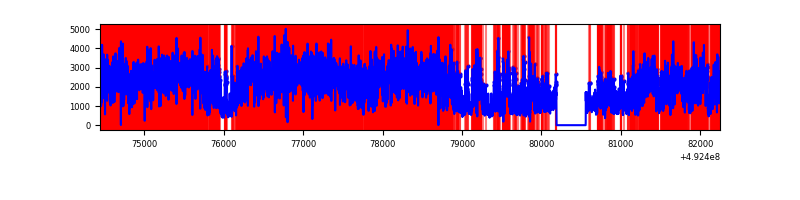 |
| D | 7811 | 7441 | 98 | 98 | 1.25% | 1.32% | 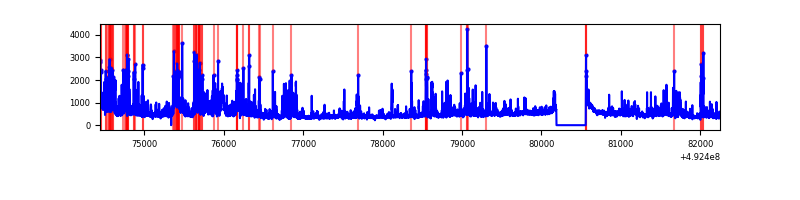 |
Top three noisy pixels from each quadrant. If the there are fewer than three noisy pixels in the level2.evt file, extra rows are filled as -1
| Pixel properties | Quadrant properties | ||||||
|---|---|---|---|---|---|---|---|
| Quadrant | DetID | PixID | Counts | Sigma | Mean | Median | Sigma |
| A | 15 | 174 | 296044 | 1541.27 | 777 | 758 | 191.6 |
| A | 3 | 62 | 55753 | 287.05 | 777 | 758 | 191.6 |
| A | 14 | 254 | 49786 | 255.91 | 777 | 758 | 191.6 |
| B | 2 | 249 | 669404 | 4174.88 | 758 | 733 | 160.2 |
| B | 4 | 171 | 412517 | 2570.99 | 758 | 733 | 160.2 |
| B | 4 | 206 | 394211 | 2456.7 | 758 | 733 | 160.2 |
| C | 15 | 178 | 8991430 | 60126.59 | 542 | 536 | 149.5 |
| C | 15 | 224 | 1629374 | 10892.85 | 542 | 536 | 149.5 |
| C | 1 | 241 | 1318103 | 8811.23 | 542 | 536 | 149.5 |
| D | 11 | 245 | 277052 | 1271.01 | 759 | 725 | 217.4 |
| D | 12 | 35 | 251389 | 1152.97 | 759 | 725 | 217.4 |
| D | 2 | 249 | 236974 | 1086.66 | 759 | 725 | 217.4 |
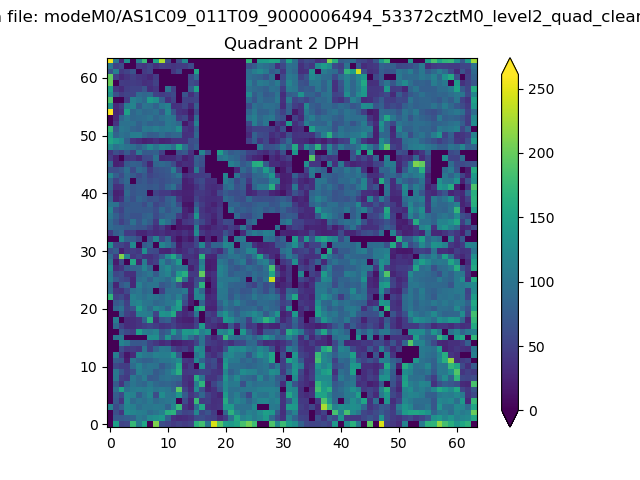
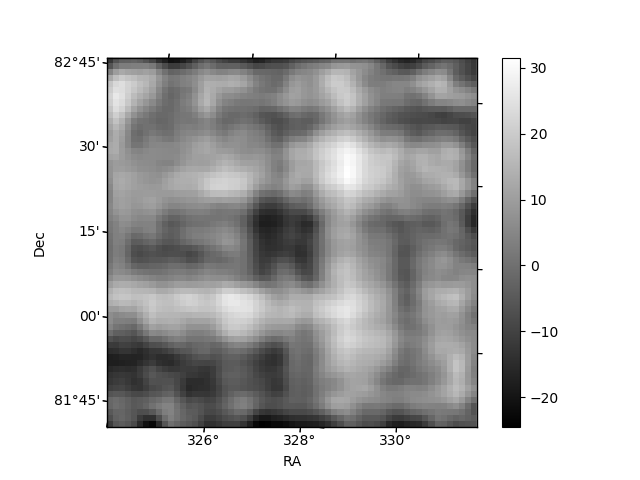
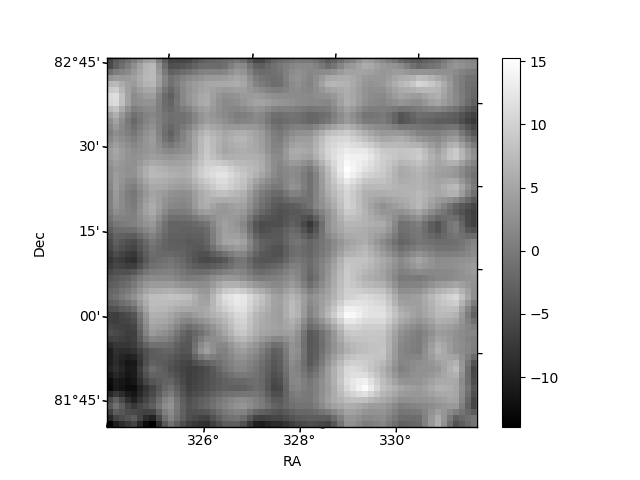
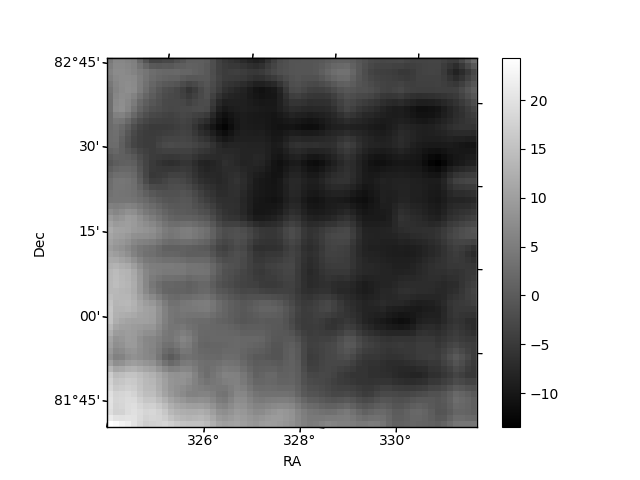
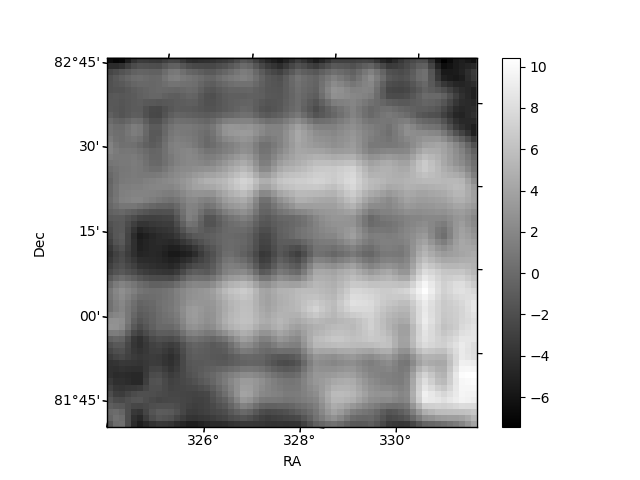
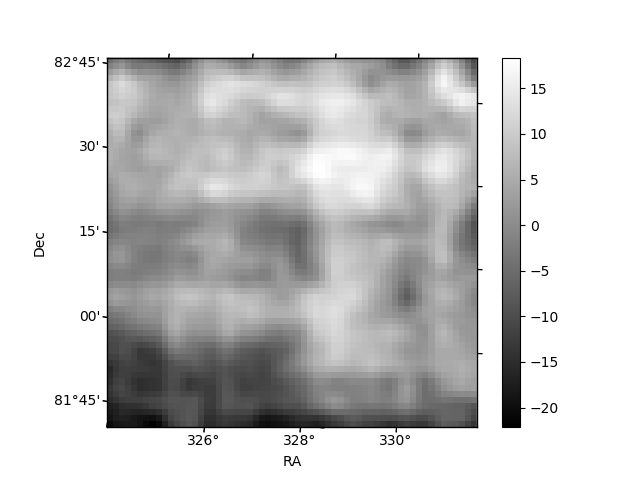
Histogram calculated using DETX and DETY for each event in the final _common_clean file
| Quadrant A | 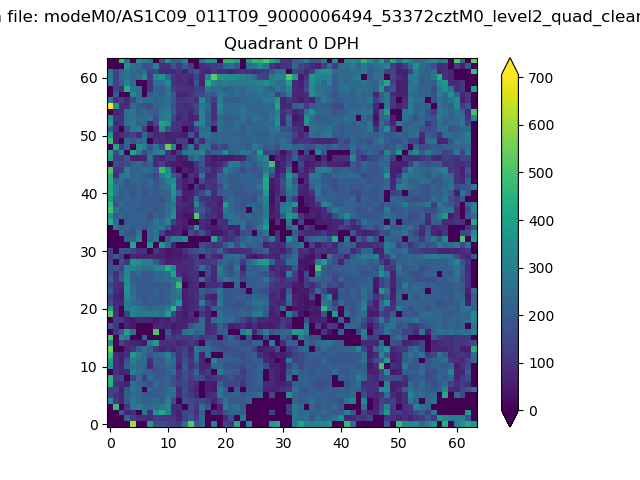 |
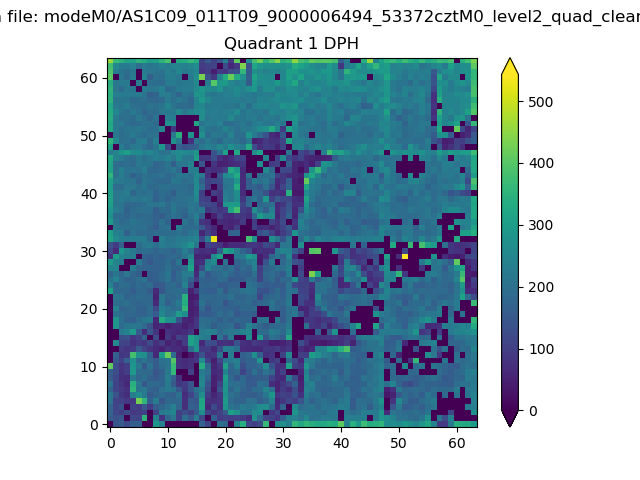 |
Quadrant B |
|---|---|---|---|
| Quadrant D | 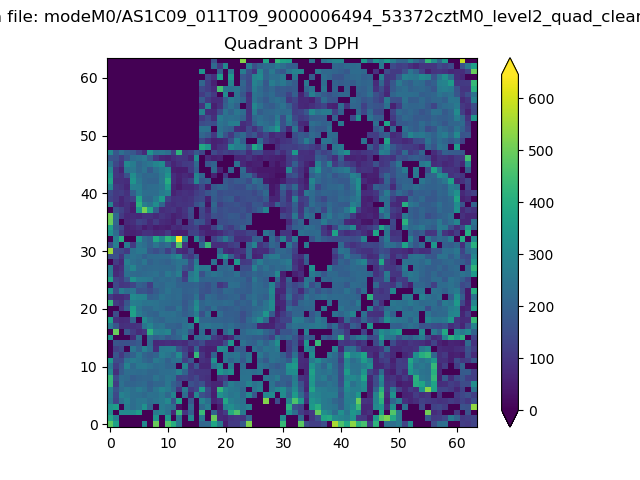 |
 |
Quadrant C |
| Plot type | Count rate plots | Images |
|---|---|---|
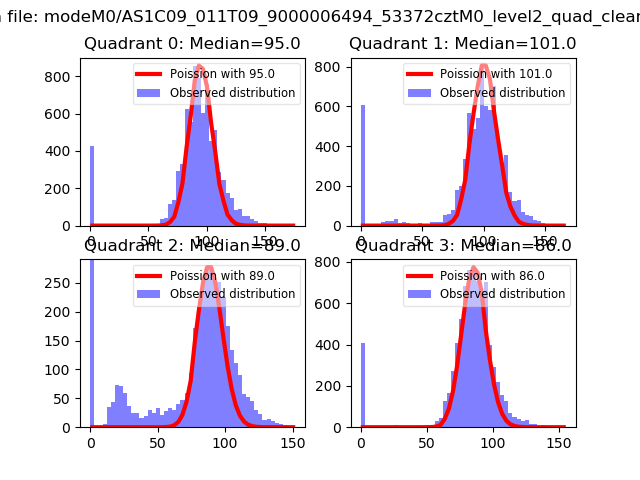
| Comparison with Poisson distribution Blue bars denote a histogram of data divided into 1 sec bins. Red curve is a Poisson curve with rate = median count rate of data. |
 |
 |
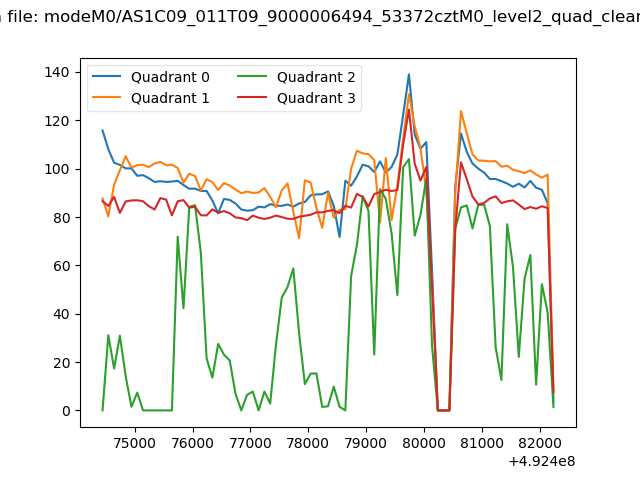
| Quadrant-wise count rates Data is divided into 100 sec bins |
 |
|
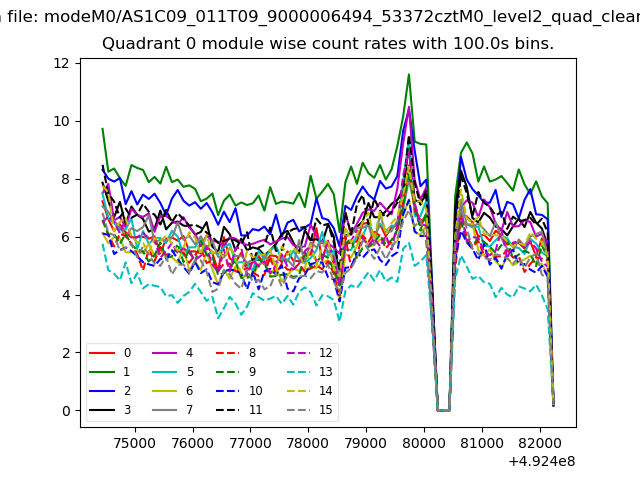
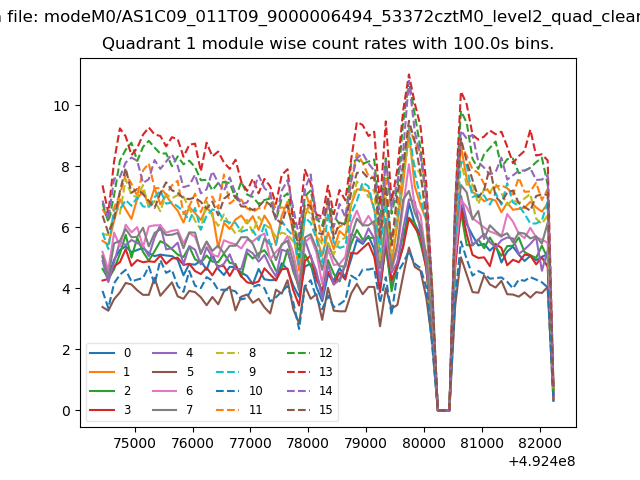
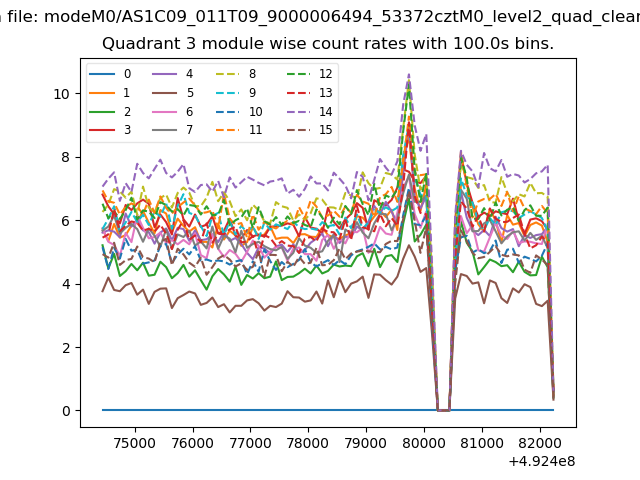
| Module-wise count rates for Quadrant A Data is divided into 100 sec bins |
 |
 |
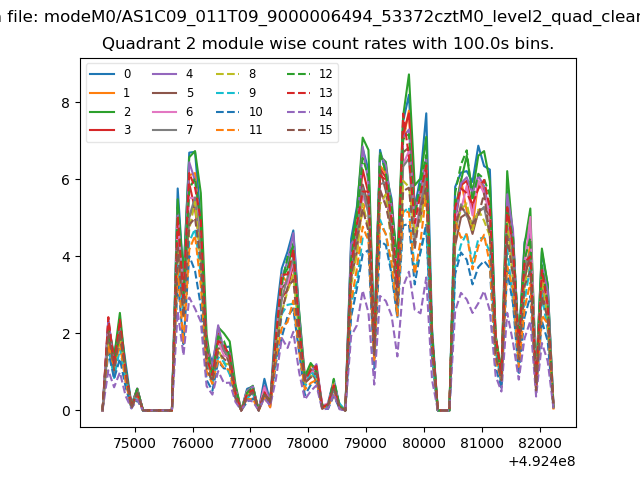
| Module-wise count rates for Quadrant B Data is divided into 100 sec bins |
 |
 |
| Module-wise count rates for Quadrant C Data is divided into 100 sec bins |
 |
 |
| Module-wise count rates for Quadrant D Data is divided into 100 sec bins |
 |
 |
| Parameter | Plot |
|---|---|
| CZT HV Monitor | 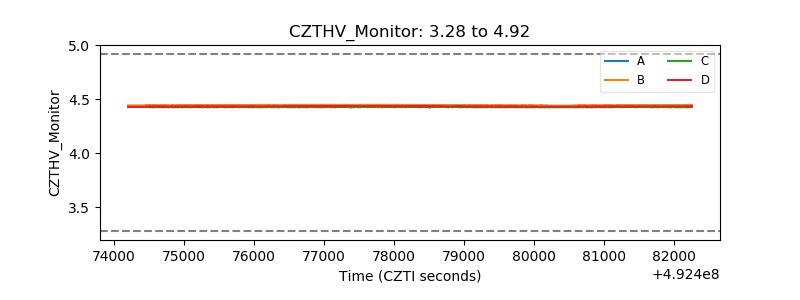 |
| D_VDD | 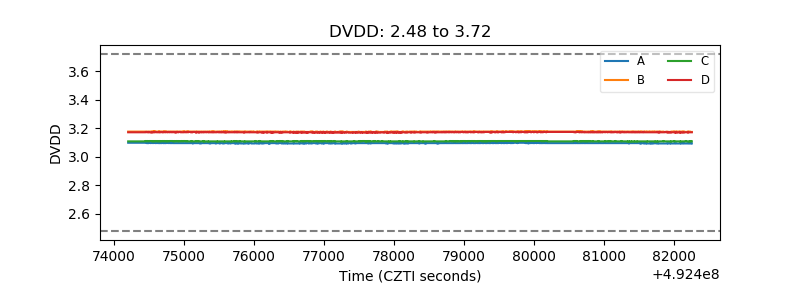 |
| Temperature 1 | 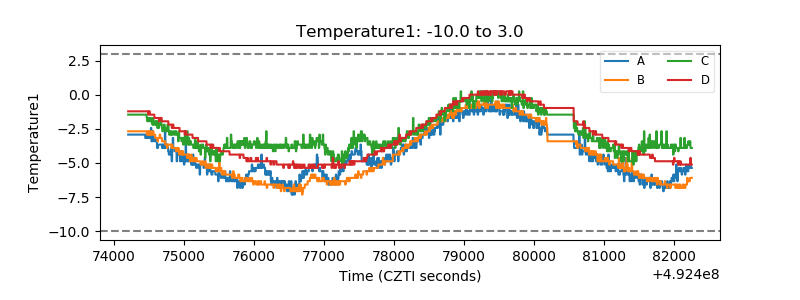 |
| Veto HV Monitor | 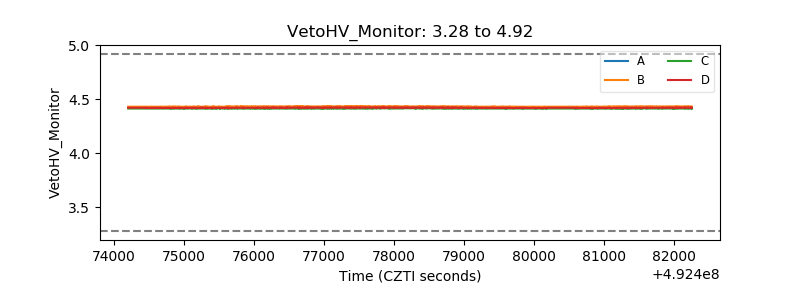 |
| Veto LLD | 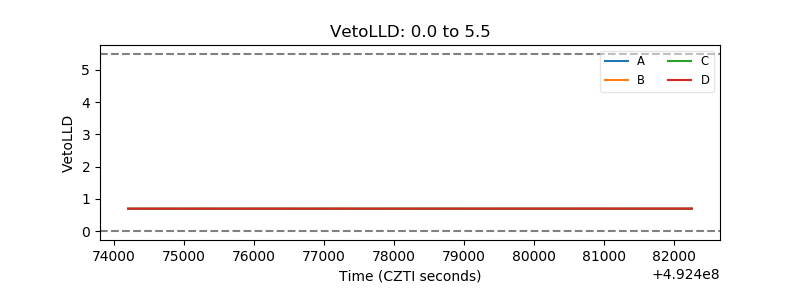 |
| Alpha Counter | 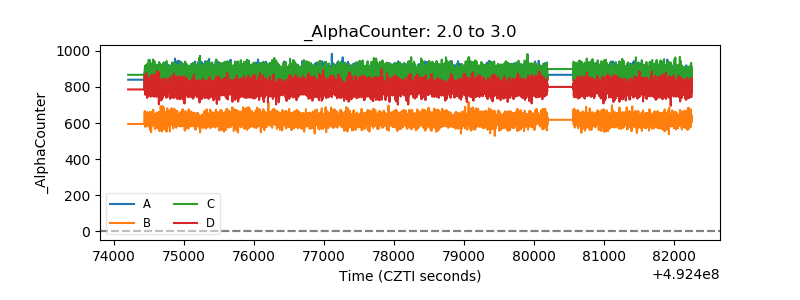 |
| _CPM_Rate | 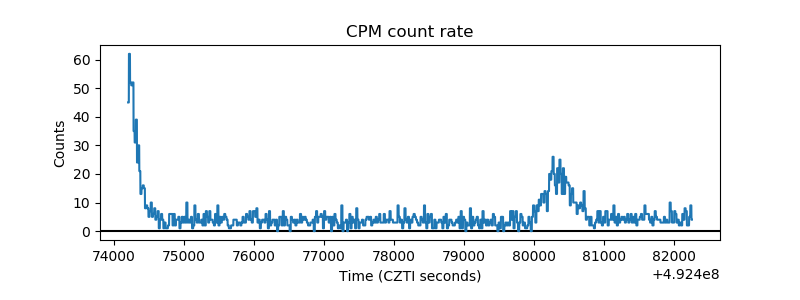 |
| CZT Counter | 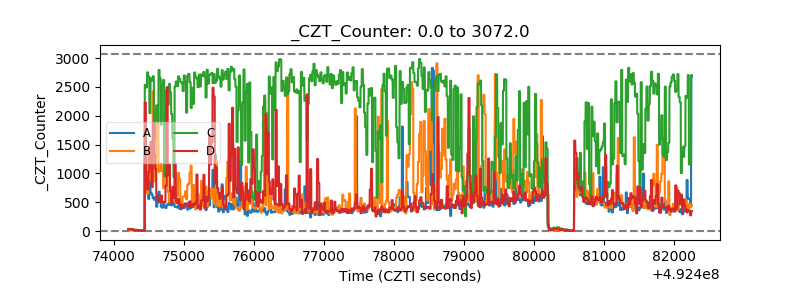 |
| +2.5 Volts monitor | 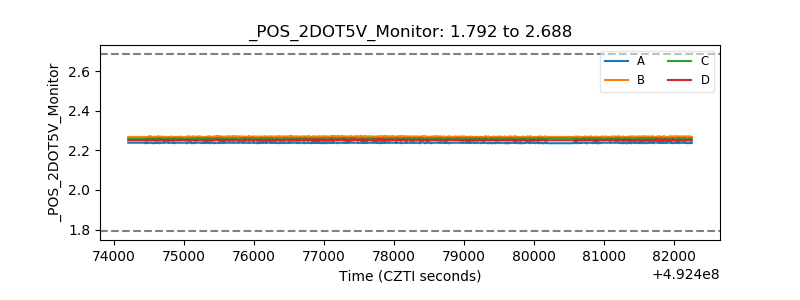 |
| +5 Volts monitor |  |
| _ROLL_ROT | 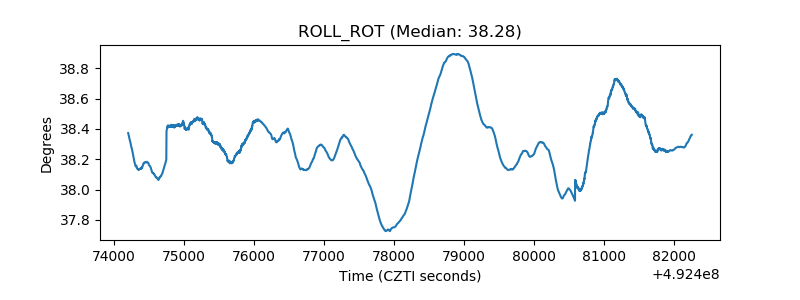 |
| _Roll_DEC |  |
| _Roll_RA | 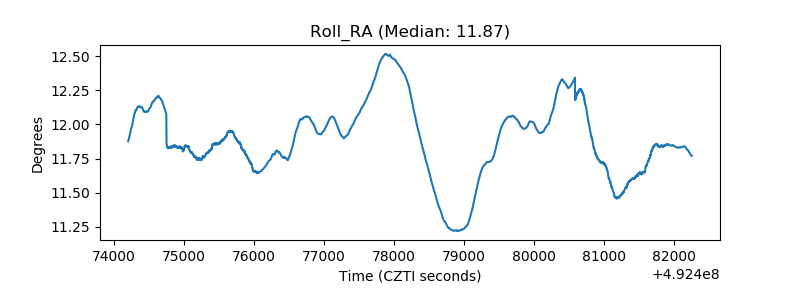 |
| Veto Counter | 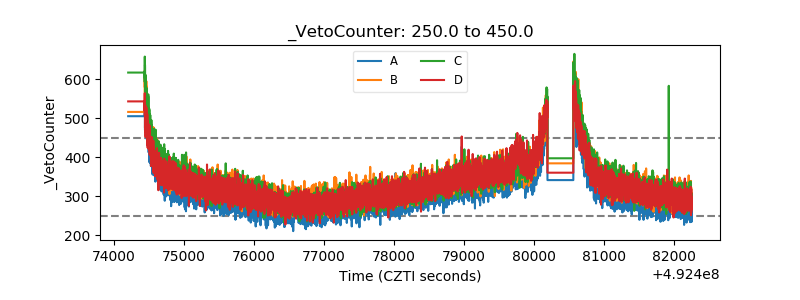 |