| Param | Original file | Final file |
|---|---|---|
| Filename | modeM0/AS1C09_011T09_9000006494_53373cztM0_level2.fits | modeM0/AS1C09_011T09_9000006494_53373cztM0_level2_quad_clean.evt |
| Size (bytes) | 800,740,800 | 107,400,960 |
| Size | 763.6 MB | 102.4 MB |
| Events in quadrant A | 5,038,875 | 734,715 |
| Events in quadrant B | 5,797,750 | 785,509 |
| Events in quadrant C | 12,067,181 | 520,347 |
| Events in quadrant D | 6,119,316 | 656,101 |
| Mode SS | |||
|---|---|---|---|
| Quadrant | BADHDUFLAG | Total packets | Discarded packets |
| A | 0 | 160 | 0 |
| B | 0 | 160 | 0 |
| C | 0 | 160 | 0 |
| D | 0 | 160 | 0 |
| Mode M0 | |||
|---|---|---|---|
| Quadrant | BADHDUFLAG | Total packets | Discarded packets |
| A | 0 | 20838 | 0 |
| B | 0 | 22902 | 0 |
| C | 0 | 41387 | 0 |
| D | 0 | 23942 | 7 |
| Quadrant | Total seconds | Saturated seconds | Saturation percentage |
|---|---|---|---|
| A | 7982 | 344 | 4.309697% |
| B | 7983 | 488 | 6.112990% |
| C | 7983 | 2639 | 33.057748% |
| D | 7982 | 526 | 6.589827% |
Noise dominated data is calculated using 1-second bins in cleaned event files. If a bin has >2000 counts, and if more than 50% of those come from <1% of pixels, then it is considered to be noise-dominated and hence unusable.
| Quadrant | # 1 sec bins | Bins with >0 counts | Bins with >2000 counts | High rate bins dominated by noise | Noise dominated (total time) | Noise dominated (detector-on time) | Marked lightcurve |
|---|---|---|---|---|---|---|---|
| A | 7982 | 7982 | 281 | 281 | 3.52% | 3.52% | 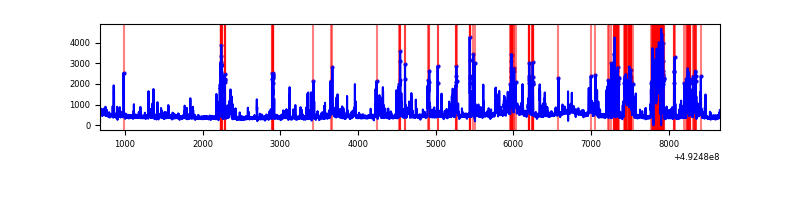 |
| B | 7983 | 7983 | 269 | 269 | 3.37% | 3.37% | 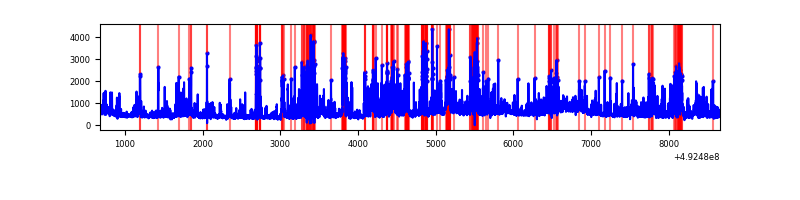 |
| C | 7983 | 7983 | 2405 | 2405 | 30.13% | 30.13% | 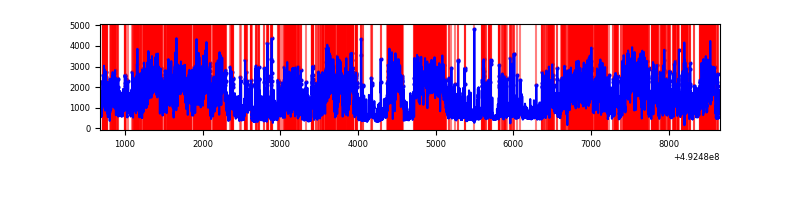 |
| D | 7982 | 7982 | 440 | 440 | 5.51% | 5.51% | 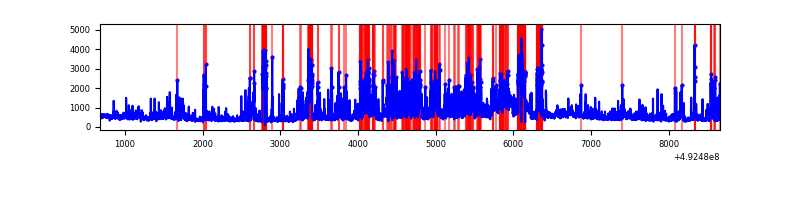 |
Top three noisy pixels from each quadrant. If the there are fewer than three noisy pixels in the level2.evt file, extra rows are filled as -1
| Pixel properties | Quadrant properties | ||||||
|---|---|---|---|---|---|---|---|
| Quadrant | DetID | PixID | Counts | Sigma | Mean | Median | Sigma |
| A | 15 | 174 | 995752 | 4825.58 | 820 | 798 | 206.2 |
| A | 8 | 245 | 282479 | 1366.17 | 820 | 798 | 206.2 |
| A | 0 | 8 | 129560 | 624.5 | 820 | 798 | 206.2 |
| B | 4 | 206 | 854531 | 4934.01 | 816 | 787 | 173.0 |
| B | 2 | 249 | 581837 | 3358.04 | 816 | 787 | 173.0 |
| B | 10 | 28 | 394937 | 2277.9 | 816 | 787 | 173.0 |
| C | 15 | 178 | 6172307 | 31360.72 | 718 | 712 | 196.8 |
| C | 15 | 224 | 1205745 | 6123.33 | 718 | 712 | 196.8 |
| C | 1 | 241 | 760589 | 3861.29 | 718 | 712 | 196.8 |
| D | 2 | 153 | 1475126 | 6573.62 | 790 | 755 | 224.3 |
| D | 2 | 62 | 484294 | 2155.9 | 790 | 755 | 224.3 |
| D | 7 | 70 | 170785 | 758.09 | 790 | 755 | 224.3 |
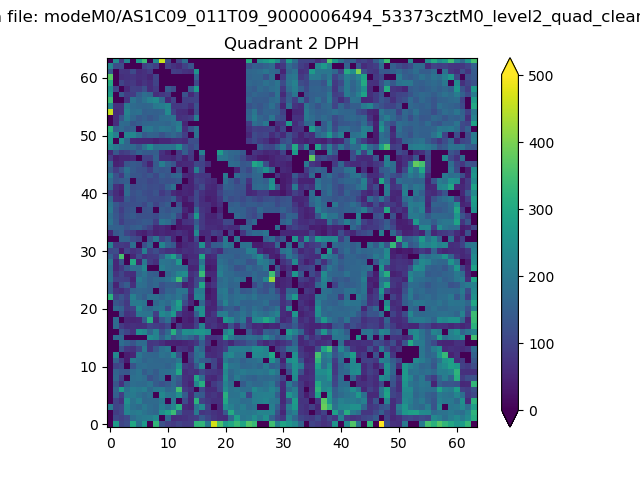
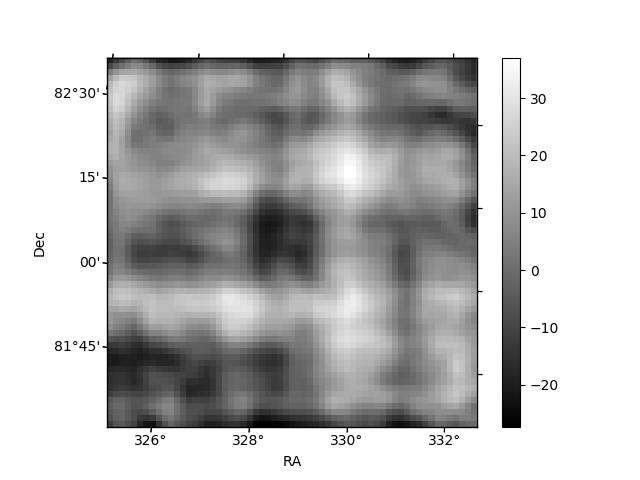
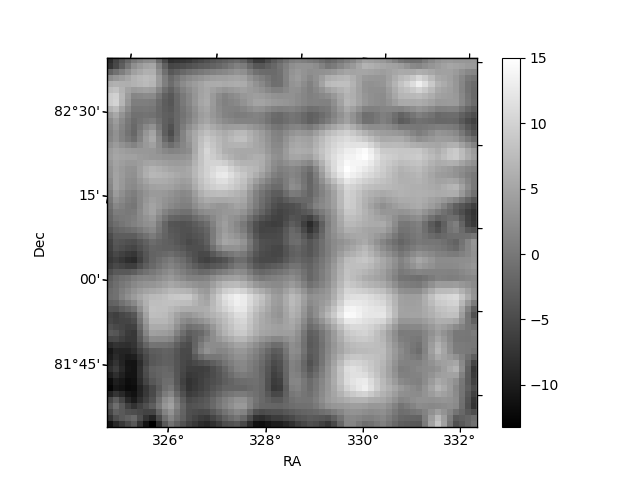
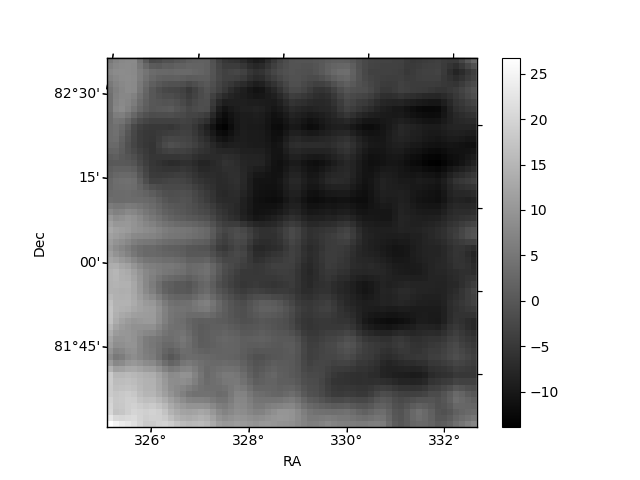
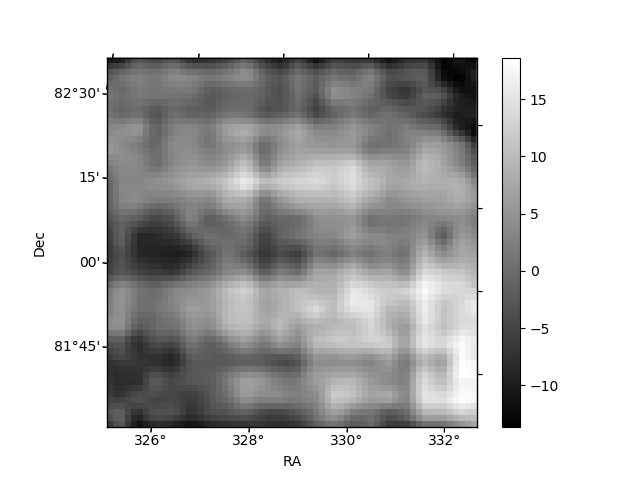
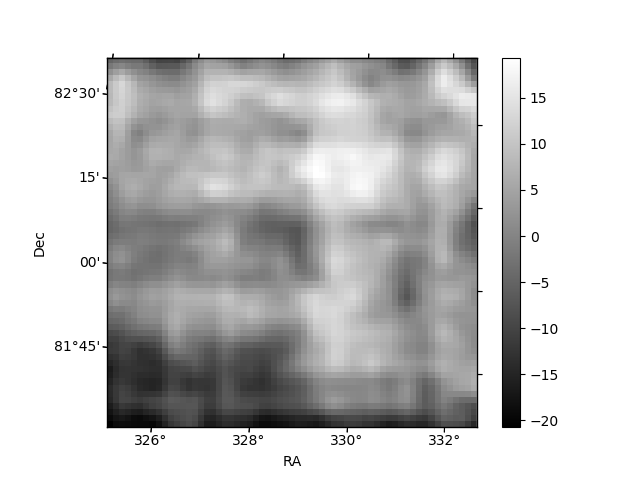
Histogram calculated using DETX and DETY for each event in the final _common_clean file
| Quadrant A | 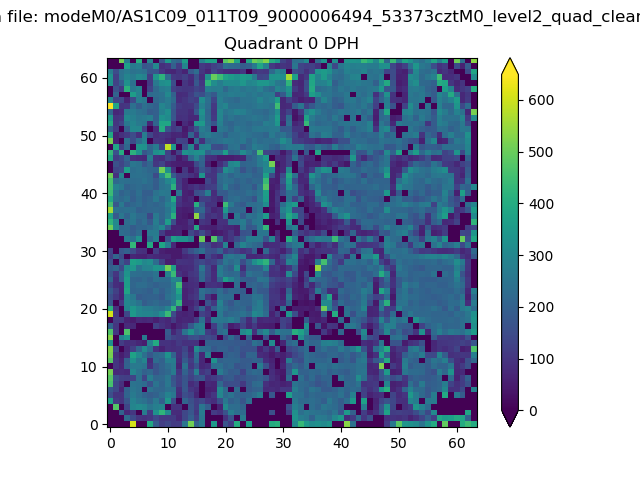 |
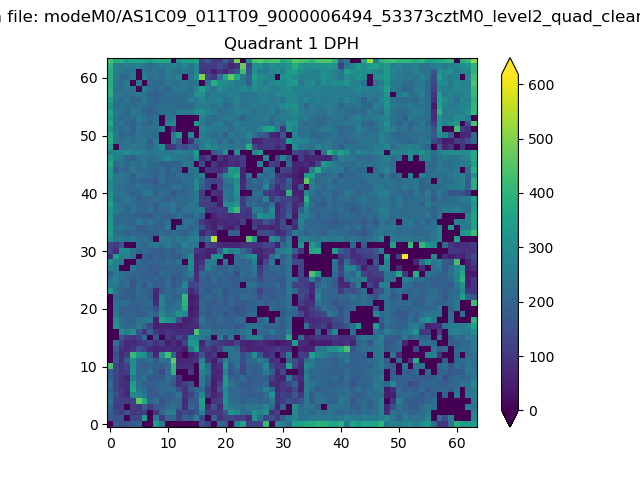 |
Quadrant B |
|---|---|---|---|
| Quadrant D | 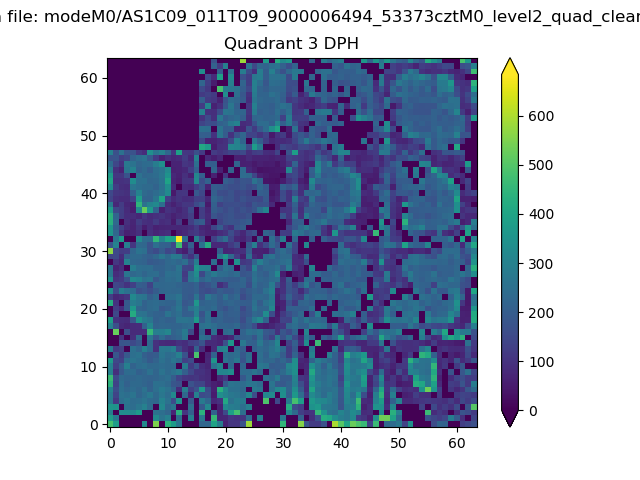 |
 |
Quadrant C |
| Plot type | Count rate plots | Images |
|---|---|---|
| Comparison with Poisson distribution Blue bars denote a histogram of data divided into 1 sec bins. Red curve is a Poisson curve with rate = median count rate of data. |
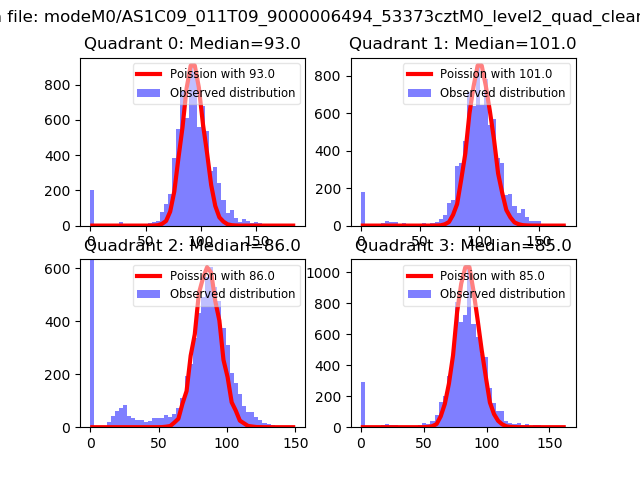 |
 |
| Quadrant-wise count rates Data is divided into 100 sec bins |
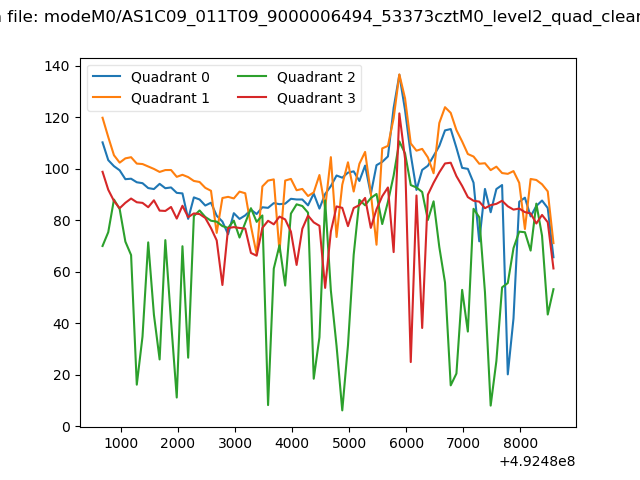 |
|
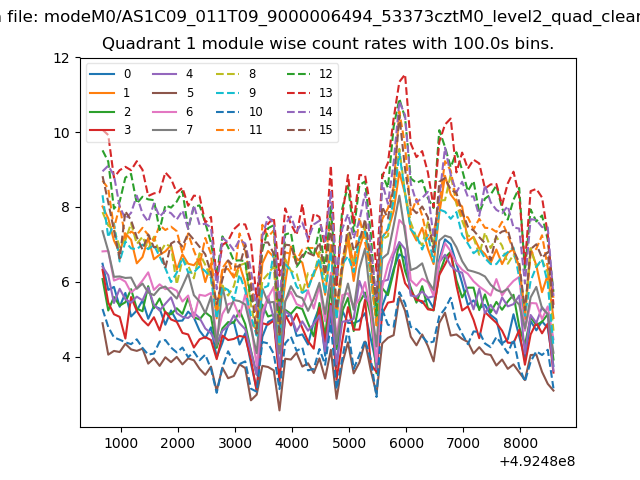
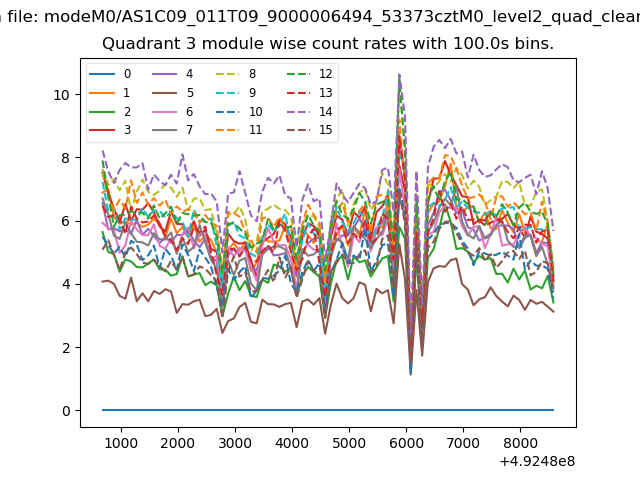
| Module-wise count rates for Quadrant A Data is divided into 100 sec bins |
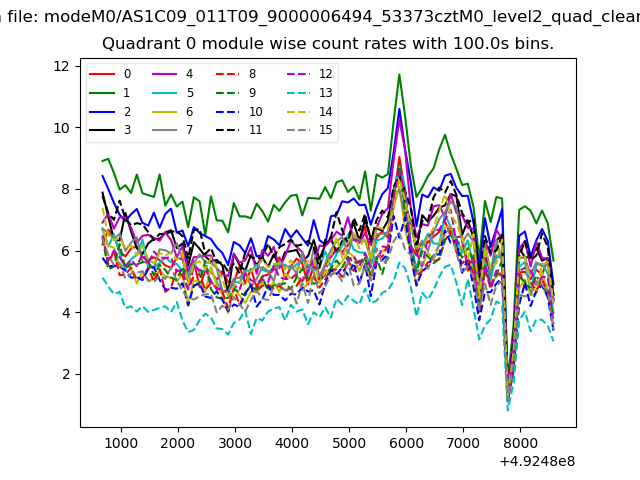 |
 |
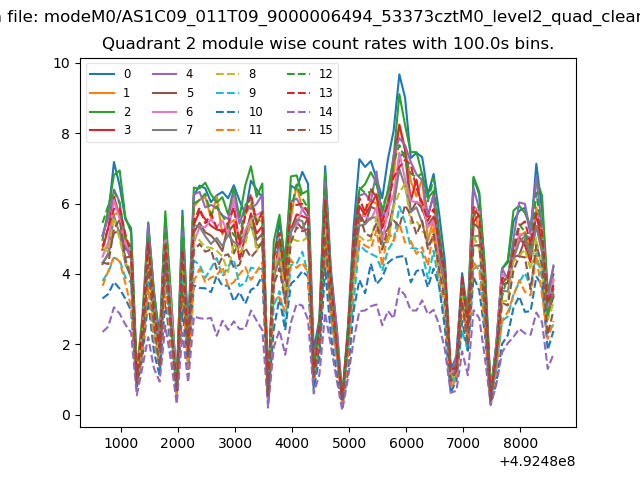
| Module-wise count rates for Quadrant B Data is divided into 100 sec bins |
 |
 |
| Module-wise count rates for Quadrant C Data is divided into 100 sec bins |
 |
 |
| Module-wise count rates for Quadrant D Data is divided into 100 sec bins |
 |
 |
| Parameter | Plot |
|---|---|
| CZT HV Monitor | 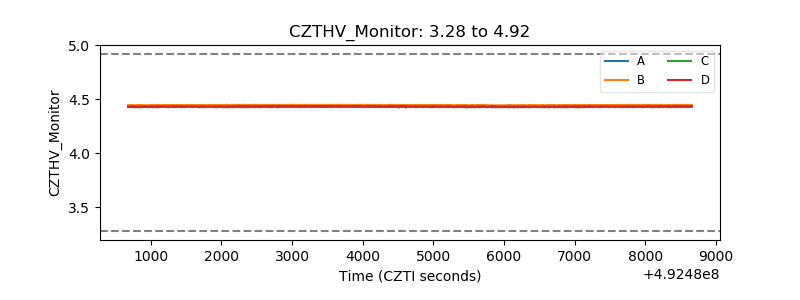 |
| D_VDD | 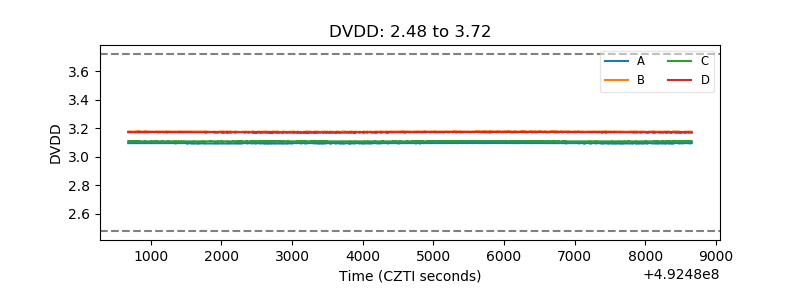 |
| Temperature 1 | 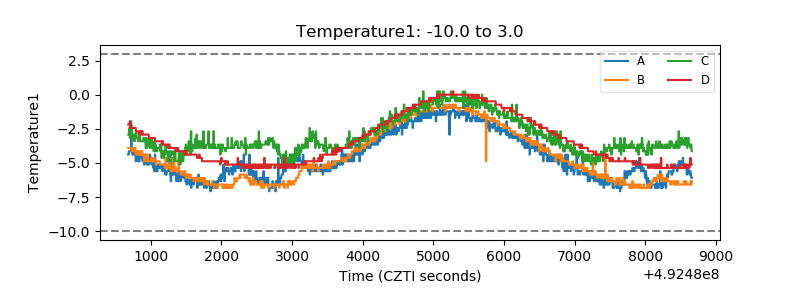 |
| Veto HV Monitor | 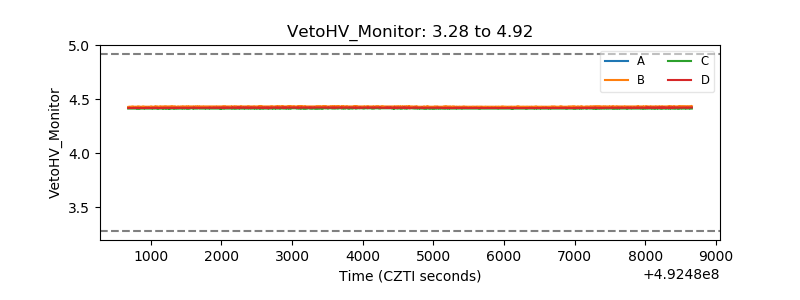 |
| Veto LLD | 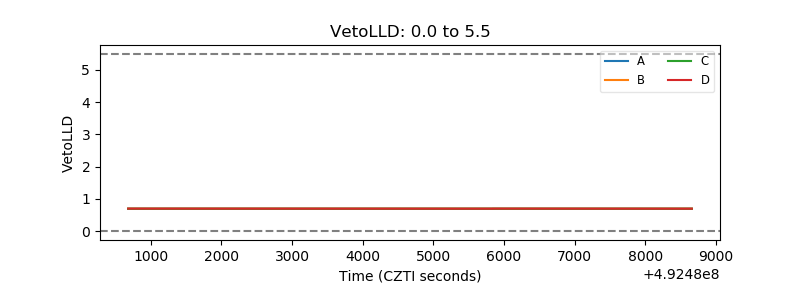 |
| Alpha Counter | 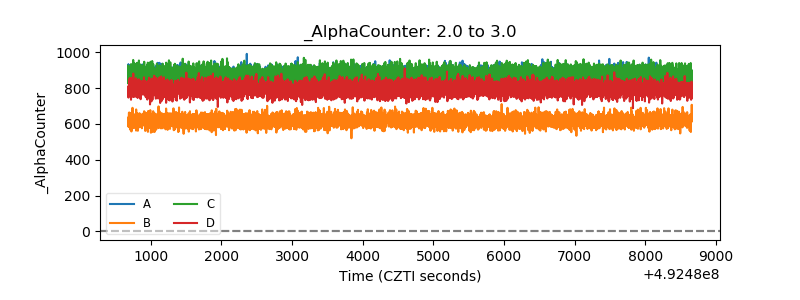 |
| _CPM_Rate | 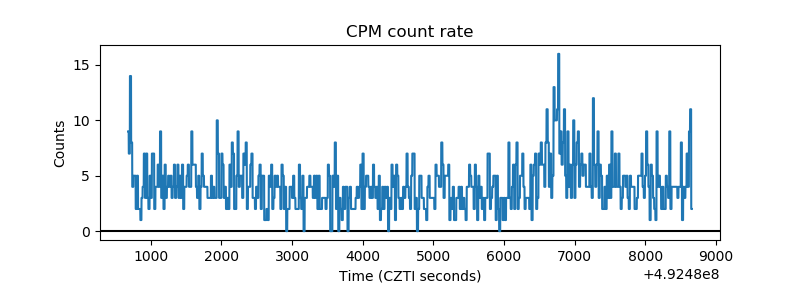 |
| CZT Counter | 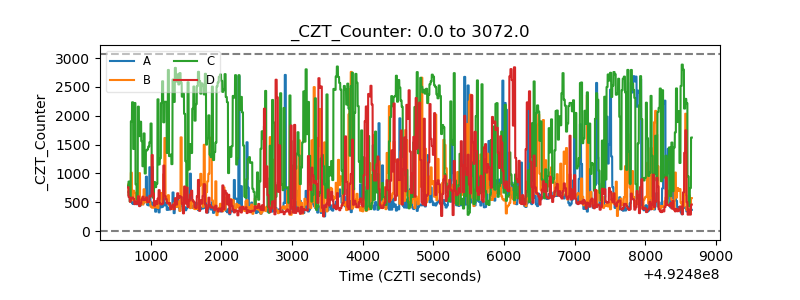 |
| +2.5 Volts monitor |  |
| +5 Volts monitor |  |
| _ROLL_ROT | 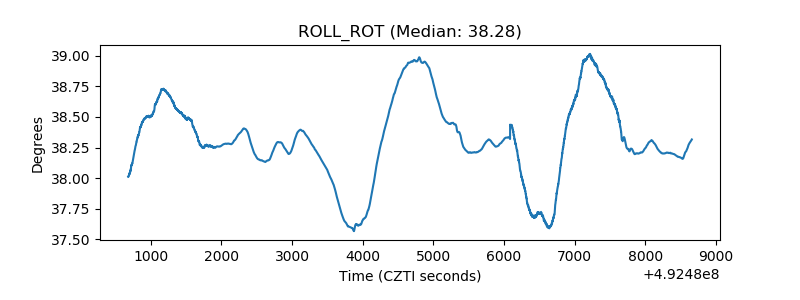 |
| _Roll_DEC | 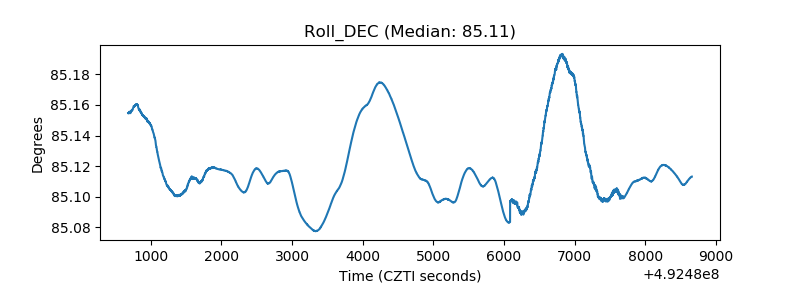 |
| _Roll_RA | 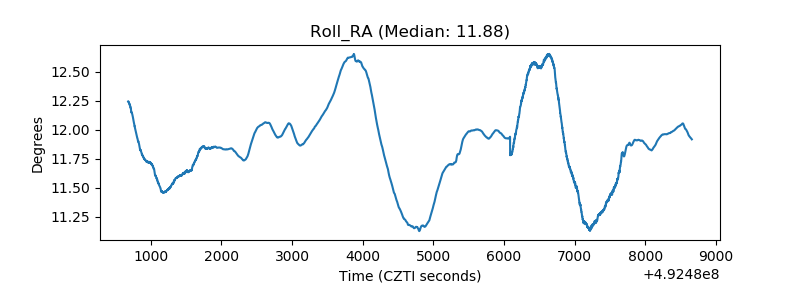 |
| Veto Counter | 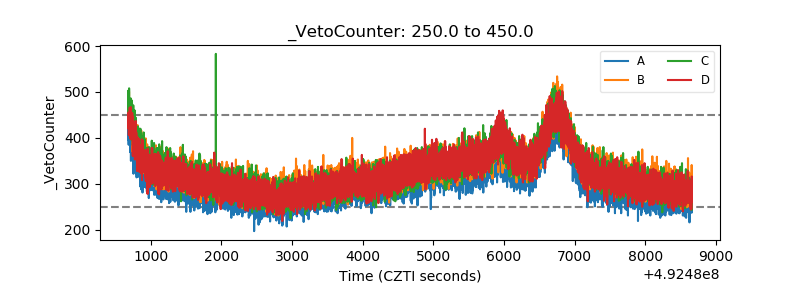 |