| Param | Original file | Final file |
|---|---|---|
| Filename | modeM0/AS1C09_011T09_9000006494_53374cztM0_level2.fits | modeM0/AS1C09_011T09_9000006494_53374cztM0_level2_quad_clean.evt |
| Size (bytes) | 789,520,320 | 100,428,480 |
| Size | 752.9 MB | 95.8 MB |
| Events in quadrant A | 5,223,741 | 681,378 |
| Events in quadrant B | 5,969,963 | 740,262 |
| Events in quadrant C | 13,129,294 | 433,414 |
| Events in quadrant D | 4,305,816 | 649,581 |
| Mode SS | |||
|---|---|---|---|
| Quadrant | BADHDUFLAG | Total packets | Discarded packets |
| A | 0 | 154 | 0 |
| B | 0 | 154 | 0 |
| C | 0 | 154 | 0 |
| D | 0 | 154 | 0 |
| Mode M0 | |||
|---|---|---|---|
| Quadrant | BADHDUFLAG | Total packets | Discarded packets |
| A | 0 | 21156 | 0 |
| B | 0 | 23026 | 0 |
| C | 0 | 44350 | 0 |
| D | 0 | 18344 | 1 |
| Quadrant | Total seconds | Saturated seconds | Saturation percentage |
|---|---|---|---|
| A | 7702 | 480 | 6.232147% |
| B | 7703 | 569 | 7.386732% |
| C | 7703 | 3229 | 41.918733% |
| D | 7702 | 151 | 1.960530% |
Noise dominated data is calculated using 1-second bins in cleaned event files. If a bin has >2000 counts, and if more than 50% of those come from <1% of pixels, then it is considered to be noise-dominated and hence unusable.
| Quadrant | # 1 sec bins | Bins with >0 counts | Bins with >2000 counts | High rate bins dominated by noise | Noise dominated (total time) | Noise dominated (detector-on time) | Marked lightcurve |
|---|---|---|---|---|---|---|---|
| A | 7702 | 7702 | 382 | 382 | 4.96% | 4.96% | 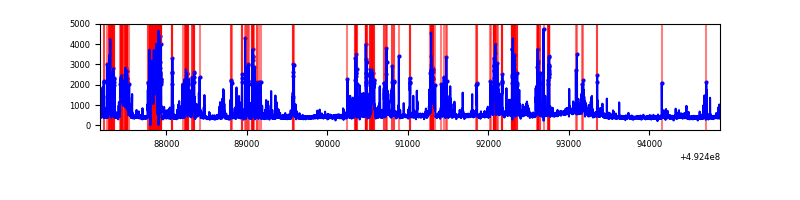 |
| B | 7703 | 7703 | 251 | 251 | 3.26% | 3.26% | 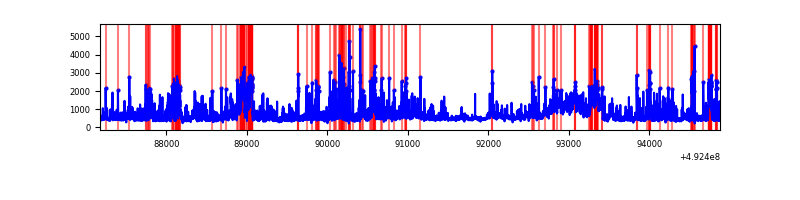 |
| C | 7702 | 7702 | 3046 | 3046 | 39.55% | 39.55% | 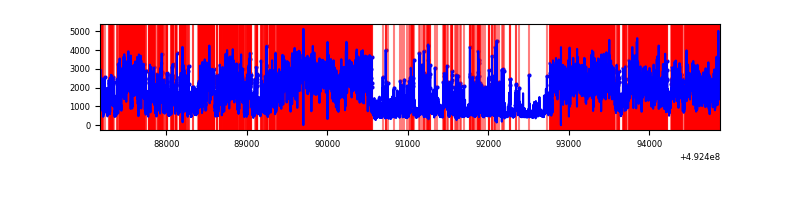 |
| D | 7702 | 7702 | 117 | 117 | 1.52% | 1.52% | 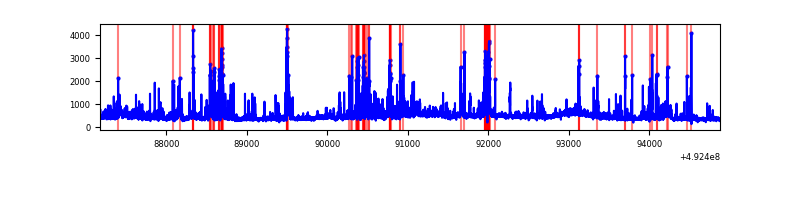 |
Top three noisy pixels from each quadrant. If the there are fewer than three noisy pixels in the level2.evt file, extra rows are filled as -1
| Pixel properties | Quadrant properties | ||||||
|---|---|---|---|---|---|---|---|
| Quadrant | DetID | PixID | Counts | Sigma | Mean | Median | Sigma |
| A | 15 | 174 | 1236353 | 6428.21 | 774 | 757 | 192.2 |
| A | 8 | 245 | 446389 | 2318.41 | 774 | 757 | 192.2 |
| A | 0 | 8 | 103387 | 533.93 | 774 | 757 | 192.2 |
| B | 4 | 206 | 830311 | 4962.09 | 782 | 752 | 167.2 |
| B | 10 | 254 | 594551 | 3551.87 | 782 | 752 | 167.2 |
| B | 10 | 28 | 409138 | 2442.8 | 782 | 752 | 167.2 |
| C | 15 | 178 | 8063458 | 46124.89 | 634 | 629 | 174.8 |
| C | 15 | 224 | 1305368 | 7464.0 | 634 | 629 | 174.8 |
| C | 1 | 241 | 749307 | 4282.95 | 634 | 629 | 174.8 |
| D | 11 | 245 | 472798 | 2185.46 | 765 | 732 | 216.0 |
| D | 2 | 249 | 179131 | 825.91 | 765 | 732 | 216.0 |
| D | 7 | 70 | 122054 | 561.67 | 765 | 732 | 216.0 |
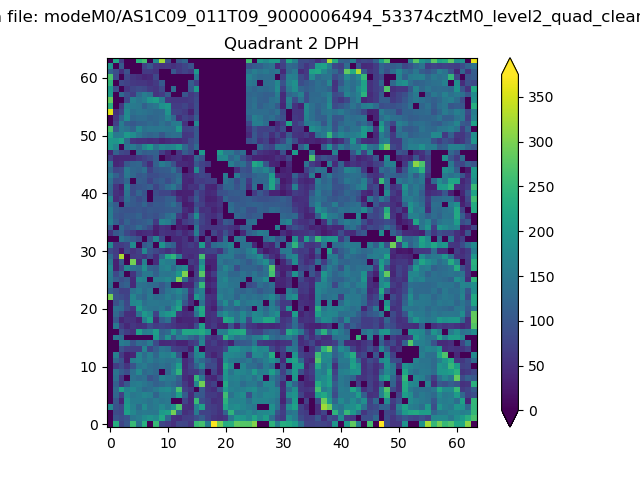
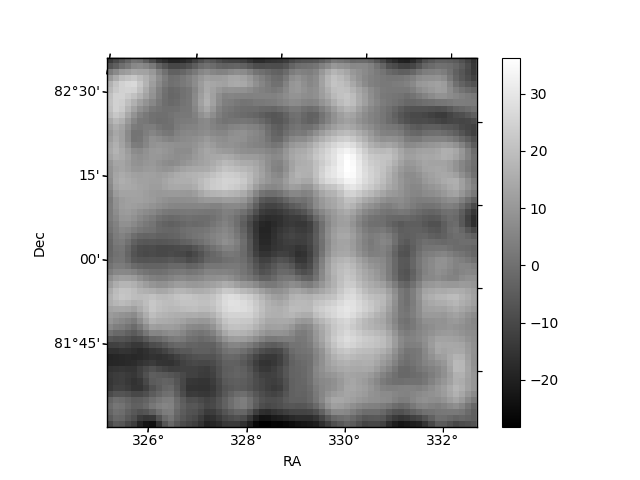
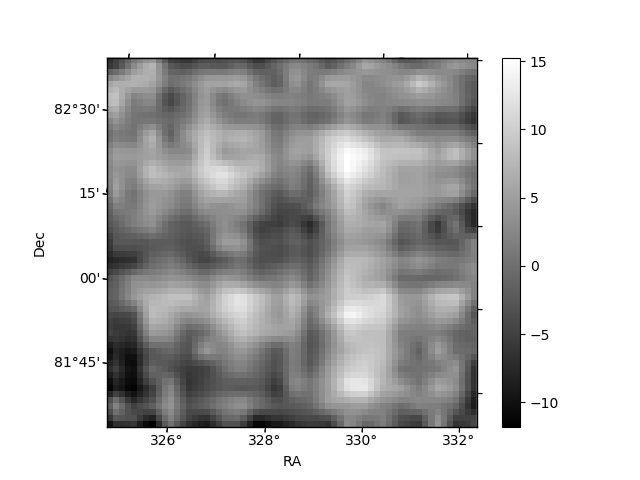
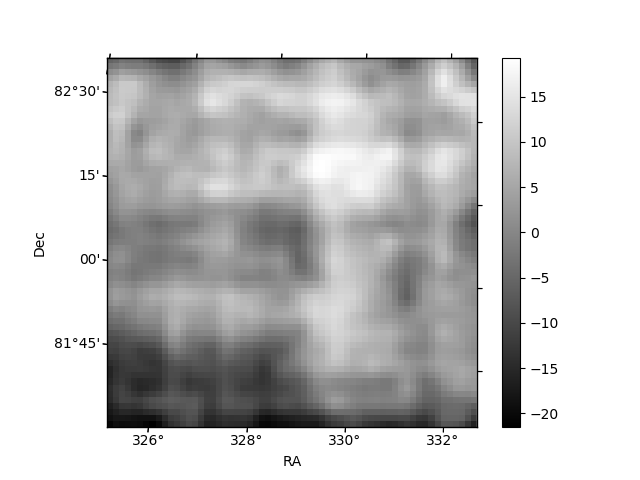
Histogram calculated using DETX and DETY for each event in the final _common_clean file
| Quadrant A | 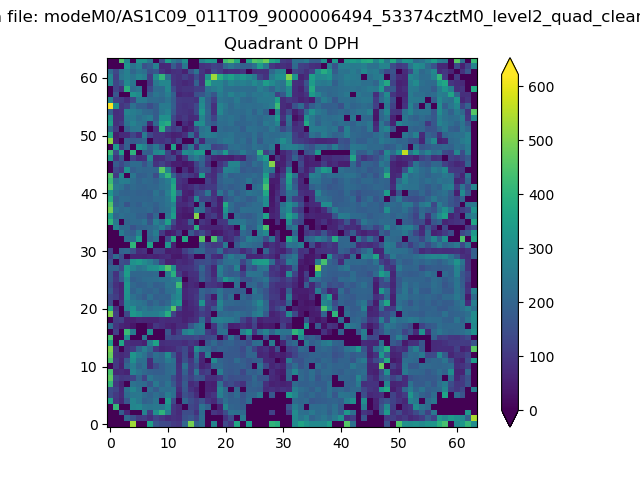 |
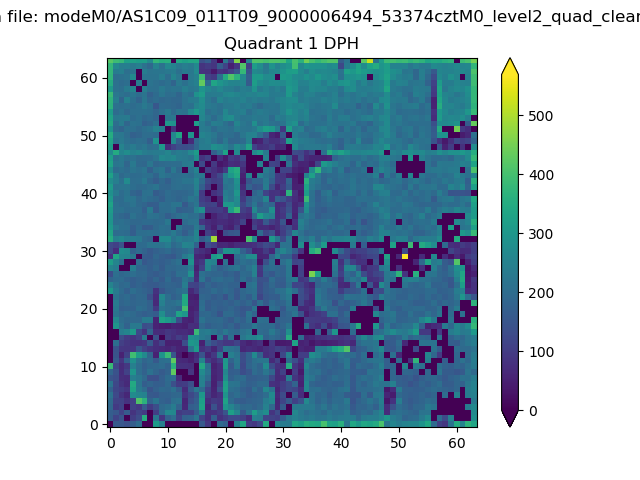 |
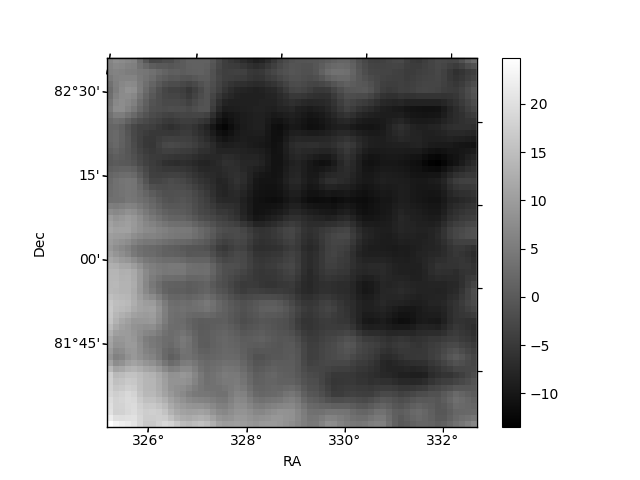
Quadrant B |
|---|---|---|---|
| Quadrant D | 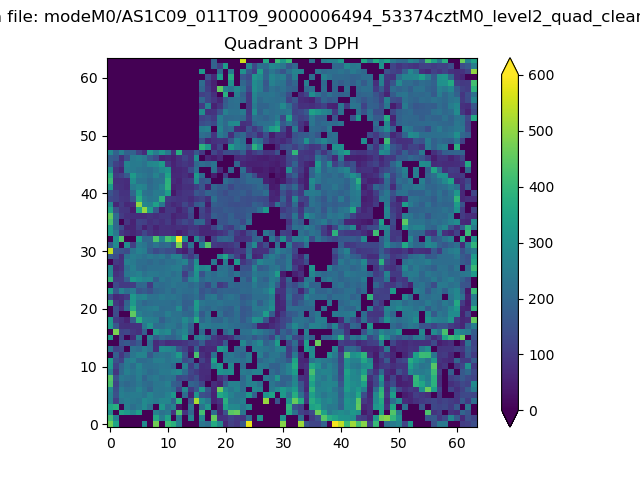 |
 |
Quadrant C |
| Plot type | Count rate plots | Images |
|---|---|---|
| Comparison with Poisson distribution Blue bars denote a histogram of data divided into 1 sec bins. Red curve is a Poisson curve with rate = median count rate of data. |
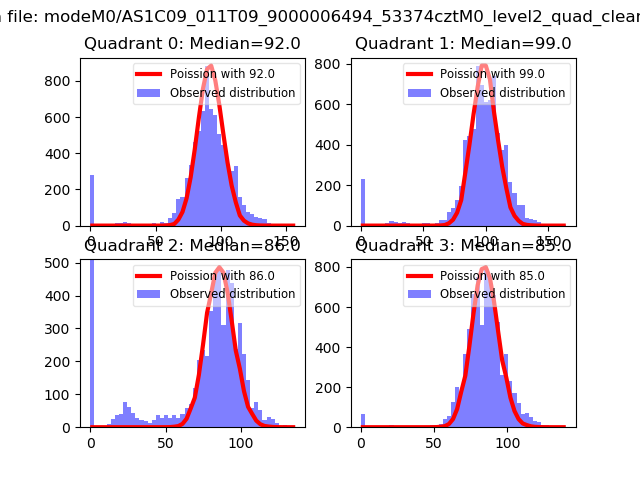 |
 |
| Quadrant-wise count rates Data is divided into 100 sec bins |
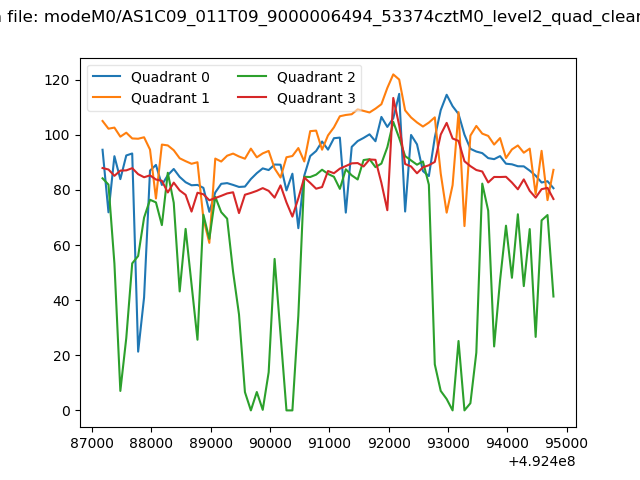 |
|
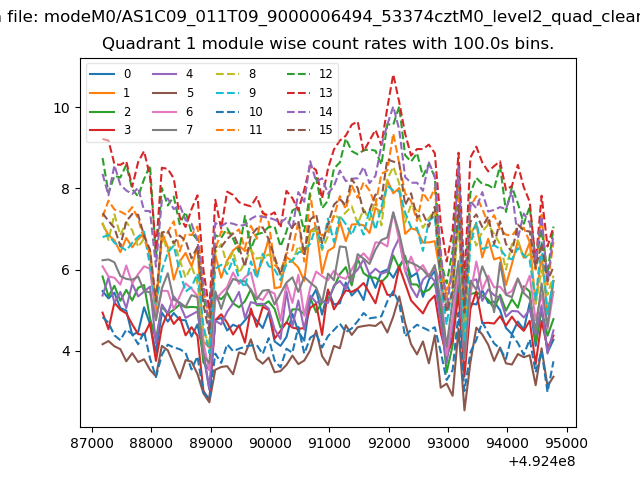
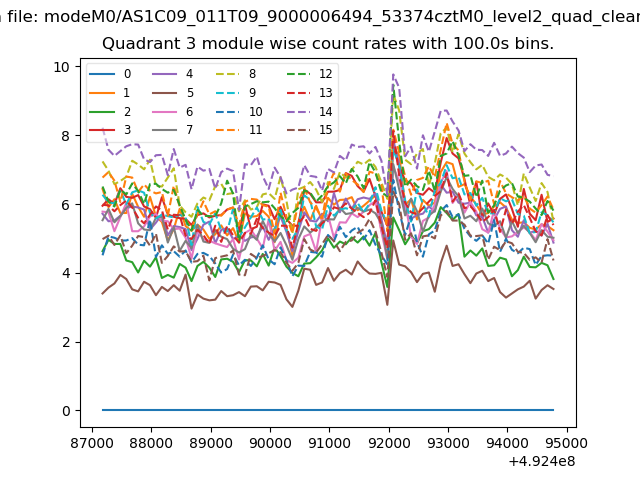
| Module-wise count rates for Quadrant A Data is divided into 100 sec bins |
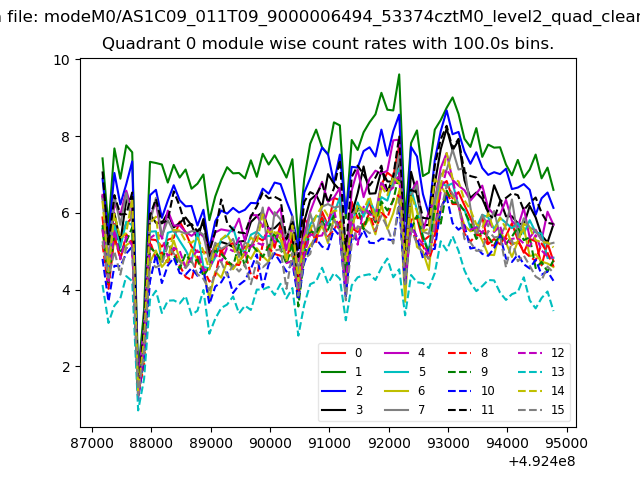 |
 |
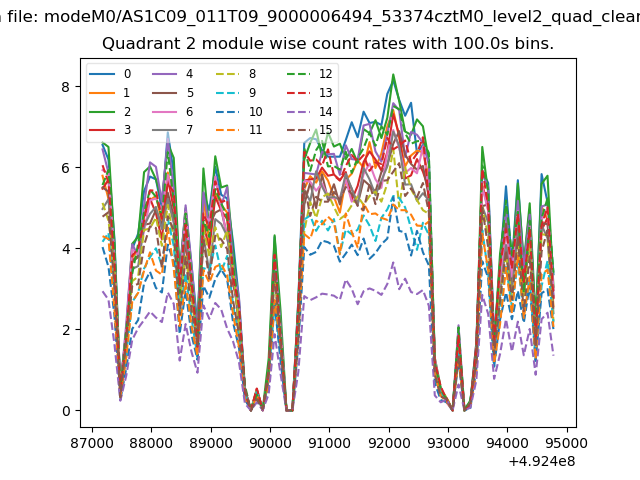
| Module-wise count rates for Quadrant B Data is divided into 100 sec bins |
 |
 |
| Module-wise count rates for Quadrant C Data is divided into 100 sec bins |
 |
 |
| Module-wise count rates for Quadrant D Data is divided into 100 sec bins |
 |
 |
| Parameter | Plot |
|---|---|
| CZT HV Monitor | 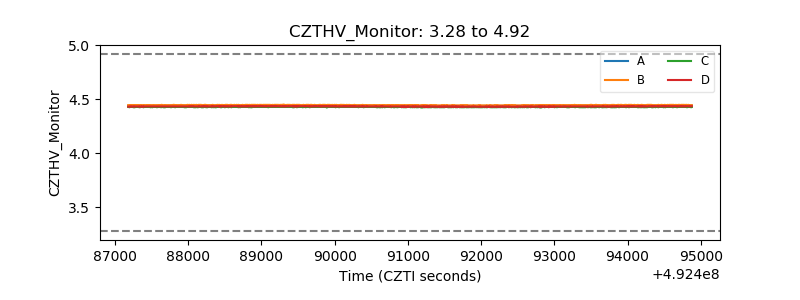 |
| D_VDD | 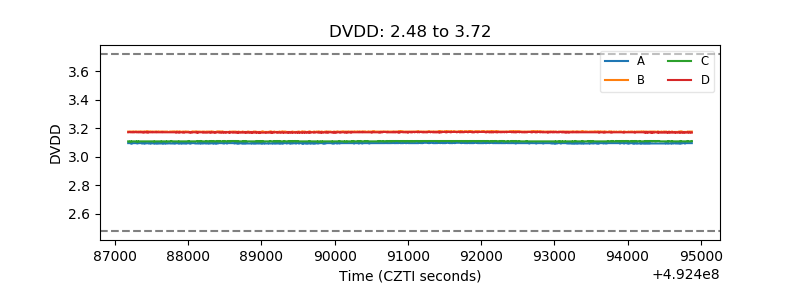 |
| Temperature 1 | 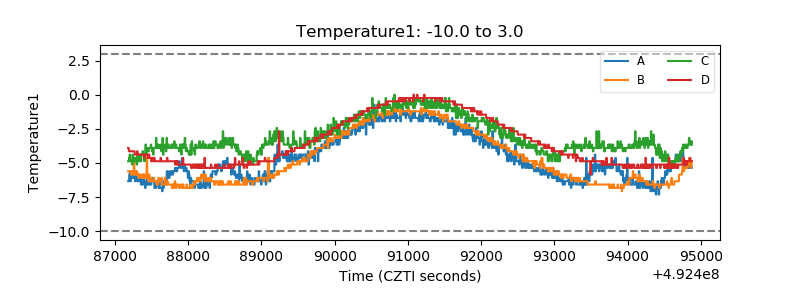 |
| Veto HV Monitor | 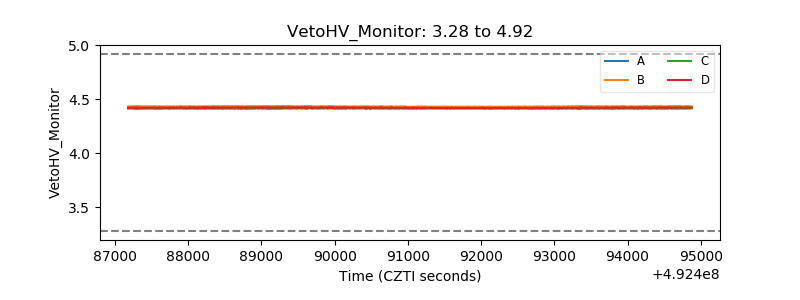 |
| Veto LLD | 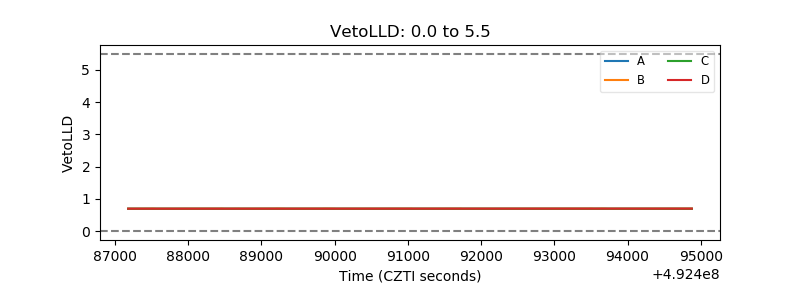 |
| Alpha Counter | 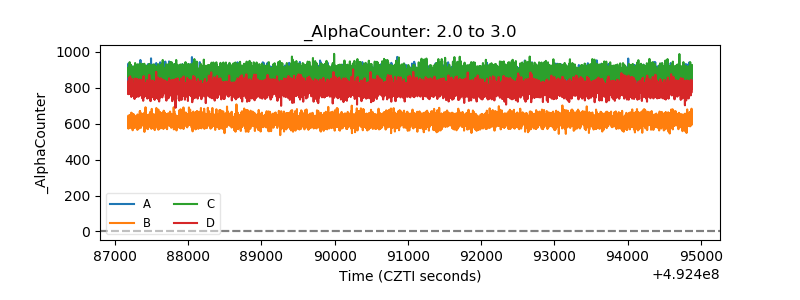 |
| _CPM_Rate | 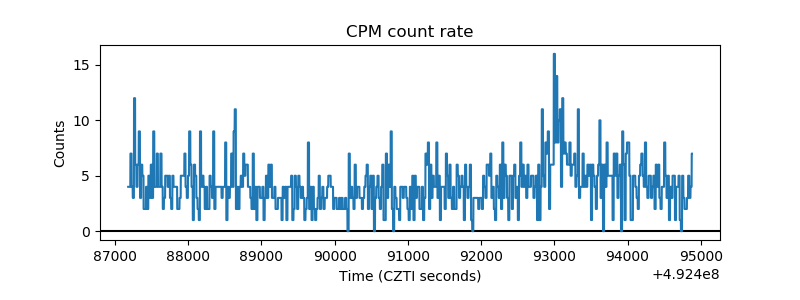 |
| CZT Counter | 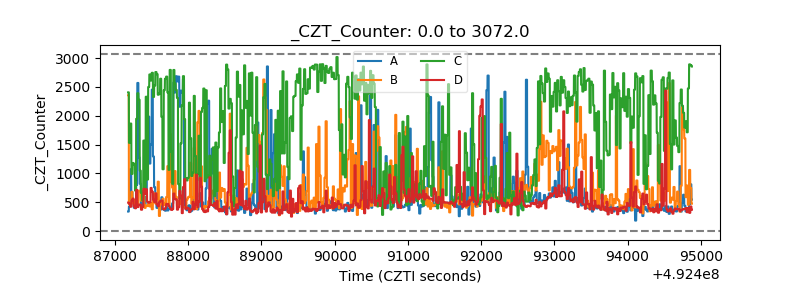 |
| +2.5 Volts monitor |  |
| +5 Volts monitor |  |
| _ROLL_ROT | 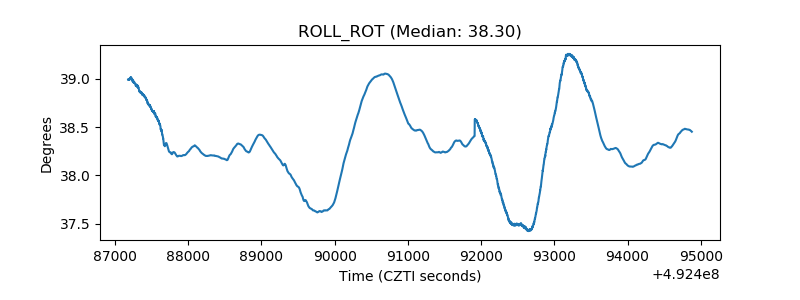 |
| _Roll_DEC | 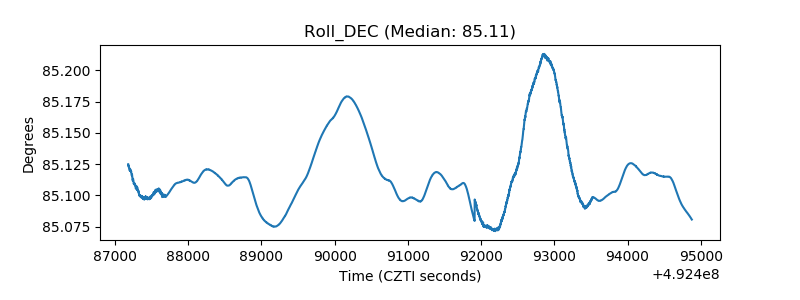 |
| _Roll_RA | 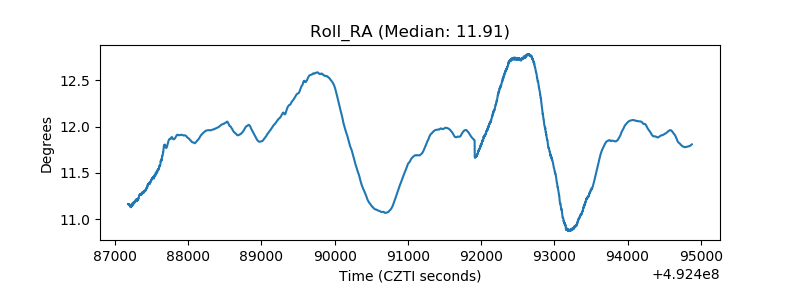 |
| Veto Counter | 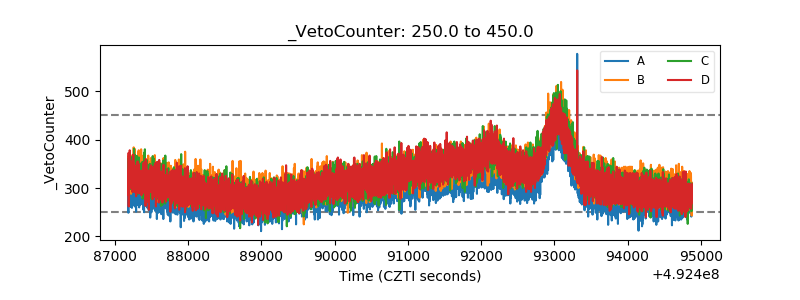 |