| Param | Original file | Final file |
|---|---|---|
| Filename | modeM0/AS1C09_011T09_9000006494_53377cztM0_level2.fits | modeM0/AS1C09_011T09_9000006494_53377cztM0_level2_quad_clean.evt |
| Size (bytes) | 2,117,039,040 | 234,282,240 |
| Size | 2.0 GB | 223.4 MB |
| Events in quadrant A | 14,039,794 | 1,640,807 |
| Events in quadrant B | 16,091,255 | 1,735,116 |
| Events in quadrant C | 35,921,750 | 830,246 |
| Events in quadrant D | 10,839,531 | 1,570,317 |
| Mode SS | |||
|---|---|---|---|
| Quadrant | BADHDUFLAG | Total packets | Discarded packets |
| A | 0 | 388 | 0 |
| B | 0 | 388 | 0 |
| C | 0 | 388 | 0 |
| D | 0 | 388 | 0 |
| Mode M0 | |||
|---|---|---|---|
| Quadrant | BADHDUFLAG | Total packets | Discarded packets |
| A | 0 | 55352 | 3 |
| B | 0 | 60981 | 3 |
| C | 0 | 119605 | 3 |
| D | 0 | 46279 | 3 |
| Mode M9 | |||
|---|---|---|---|
| Quadrant | BADHDUFLAG | Total packets | Discarded packets |
| A | 0 | 10 | 0 |
| B | 0 | 10 | 0 |
| C | 0 | 10 | 0 |
| D | 0 | 10 | 0 |
| Quadrant | Total seconds | Saturated seconds | Saturation percentage |
|---|---|---|---|
| A | 19096 | 1708 | 8.944282% |
| B | 19096 | 2081 | 10.897570% |
| C | 19096 | 10291 | 53.890867% |
| D | 19096 | 532 | 2.785924% |
Noise dominated data is calculated using 1-second bins in cleaned event files. If a bin has >2000 counts, and if more than 50% of those come from <1% of pixels, then it is considered to be noise-dominated and hence unusable.
| Quadrant | # 1 sec bins | Bins with >0 counts | Bins with >2000 counts | High rate bins dominated by noise | Noise dominated (total time) | Noise dominated (detector-on time) | Marked lightcurve |
|---|---|---|---|---|---|---|---|
| A | 20106 | 19099 | 1205 | 1205 | 5.99% | 6.31% | 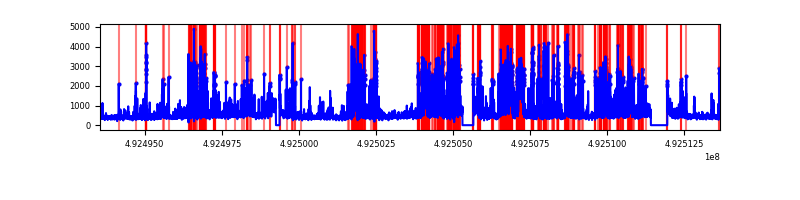 |
| B | 20106 | 19099 | 1080 | 1080 | 5.37% | 5.65% | 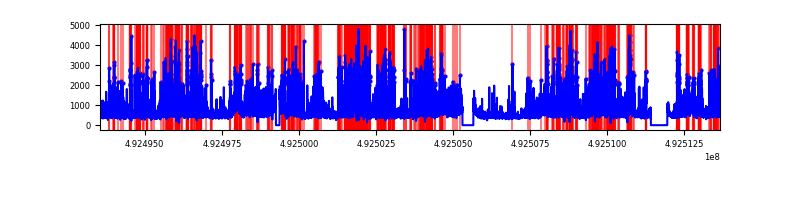 |
| C | 20106 | 19099 | 9510 | 9510 | 47.30% | 49.79% | 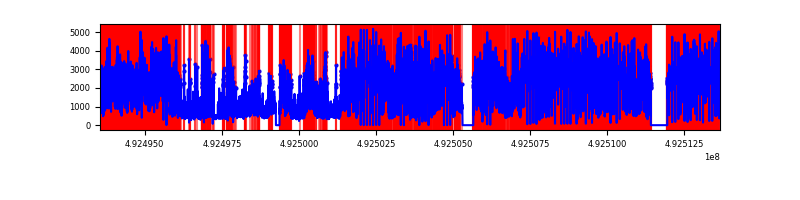 |
| D | 20106 | 19099 | 321 | 321 | 1.60% | 1.68% | 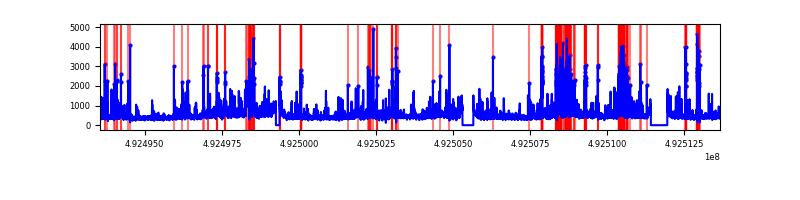 |
Top three noisy pixels from each quadrant. If the there are fewer than three noisy pixels in the level2.evt file, extra rows are filled as -1
| Pixel properties | Quadrant properties | ||||||
|---|---|---|---|---|---|---|---|
| Quadrant | DetID | PixID | Counts | Sigma | Mean | Median | Sigma |
| A | 3 | 62 | 2713365 | 5585.36 | 1957 | 1907 | 485.5 |
| A | 15 | 174 | 1550008 | 3188.95 | 1957 | 1907 | 485.5 |
| A | 4 | 249 | 538175 | 1104.66 | 1957 | 1907 | 485.5 |
| B | 4 | 206 | 3315958 | 7996.61 | 1939 | 1866 | 414.4 |
| B | 2 | 249 | 1374217 | 3311.36 | 1939 | 1866 | 414.4 |
| B | 4 | 171 | 1034678 | 2492.08 | 1939 | 1866 | 414.4 |
| C | 1 | 241 | 18134130 | 48583.5 | 1362 | 1351 | 373.2 |
| C | 15 | 178 | 8149758 | 21832.18 | 1362 | 1351 | 373.2 |
| C | 15 | 224 | 2905106 | 7780.08 | 1362 | 1351 | 373.2 |
| D | 7 | 70 | 603712 | 1099.28 | 1943 | 1857 | 547.5 |
| D | 2 | 249 | 583521 | 1062.4 | 1943 | 1857 | 547.5 |
| D | 12 | 17 | 451858 | 821.92 | 1943 | 1857 | 547.5 |
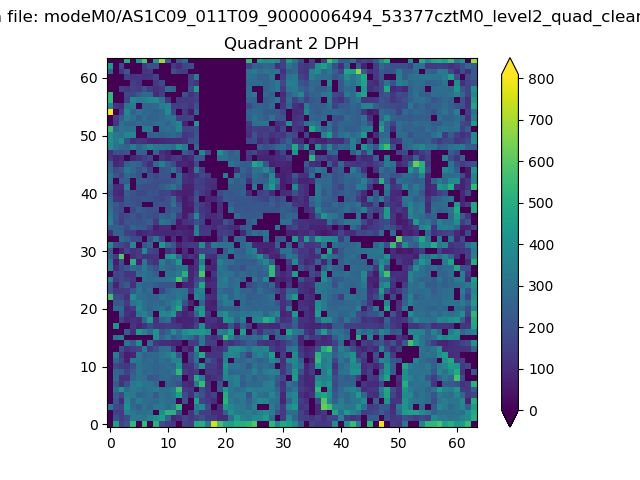
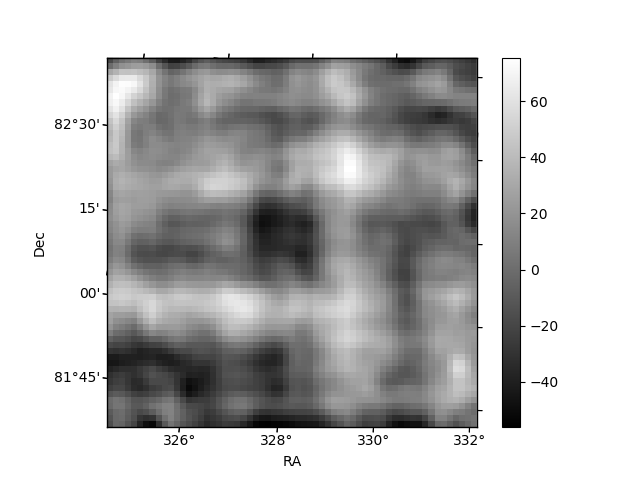
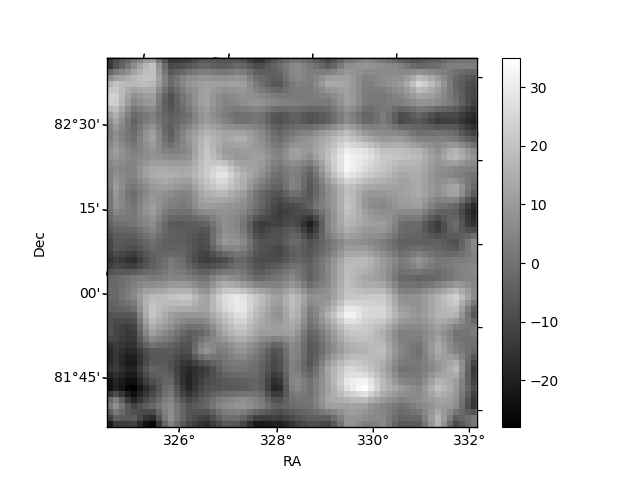
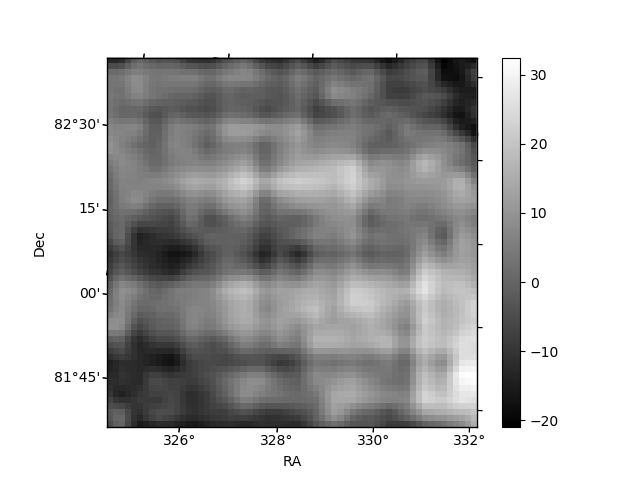
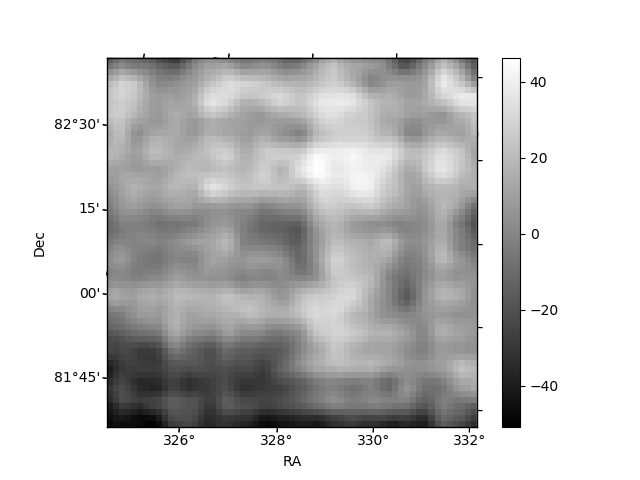
Histogram calculated using DETX and DETY for each event in the final _common_clean file
| Quadrant A | 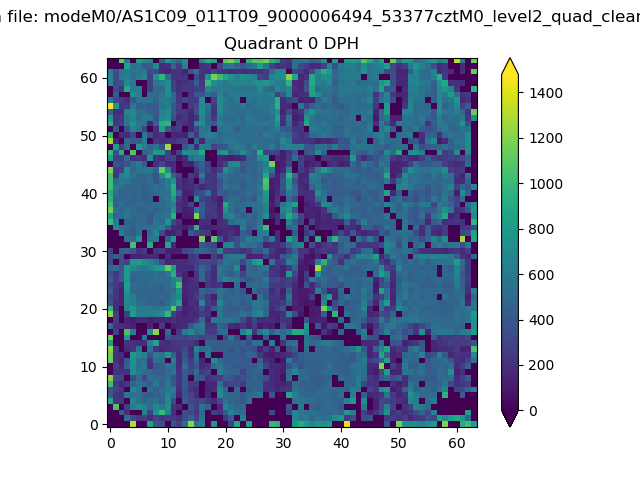 |
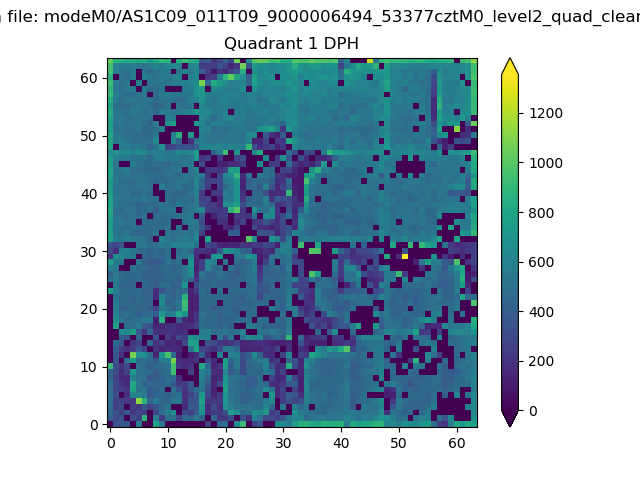 |
Quadrant B |
|---|---|---|---|
| Quadrant D | 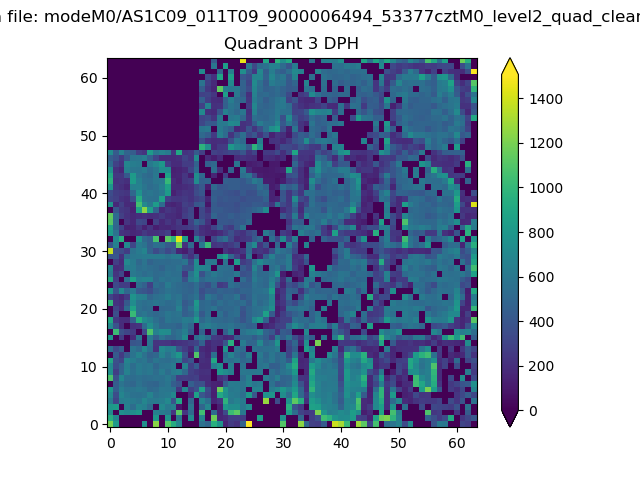 |
 |
Quadrant C |
| Plot type | Count rate plots | Images |
|---|---|---|
| Comparison with Poisson distribution Blue bars denote a histogram of data divided into 1 sec bins. Red curve is a Poisson curve with rate = median count rate of data. |
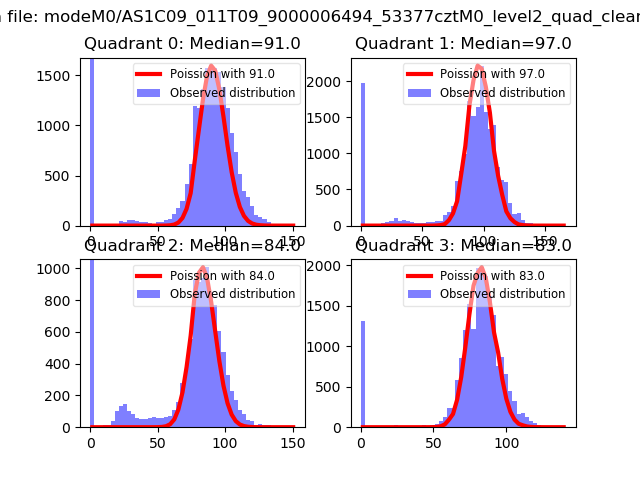 |
 |
| Quadrant-wise count rates Data is divided into 100 sec bins |
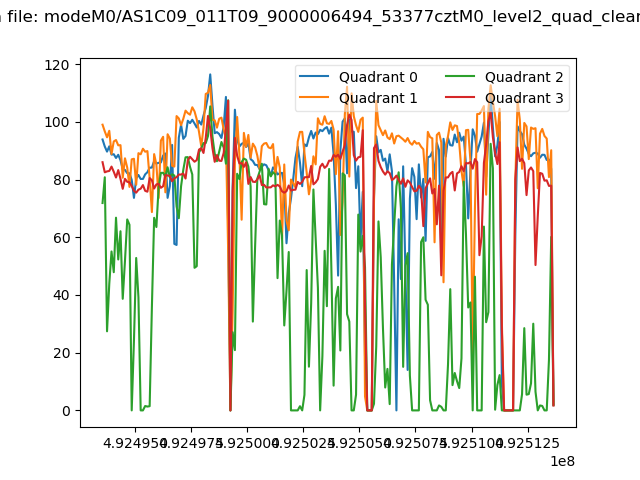 |
|
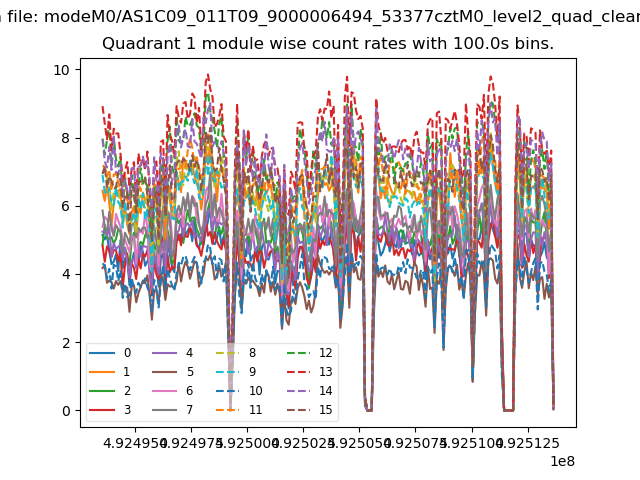
| Module-wise count rates for Quadrant A Data is divided into 100 sec bins |
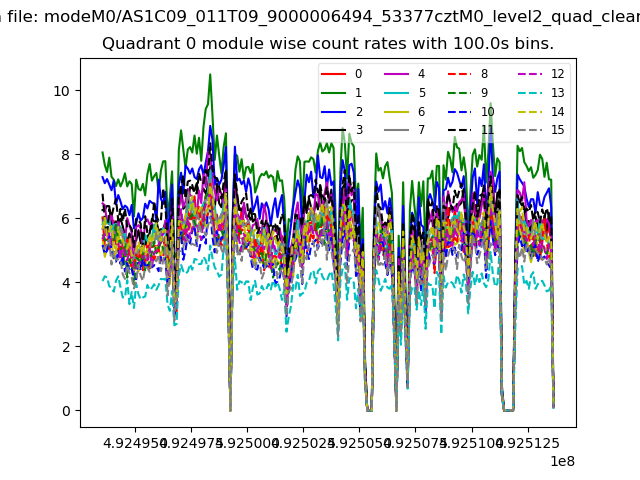 |
 |
| Module-wise count rates for Quadrant B Data is divided into 100 sec bins |
 |
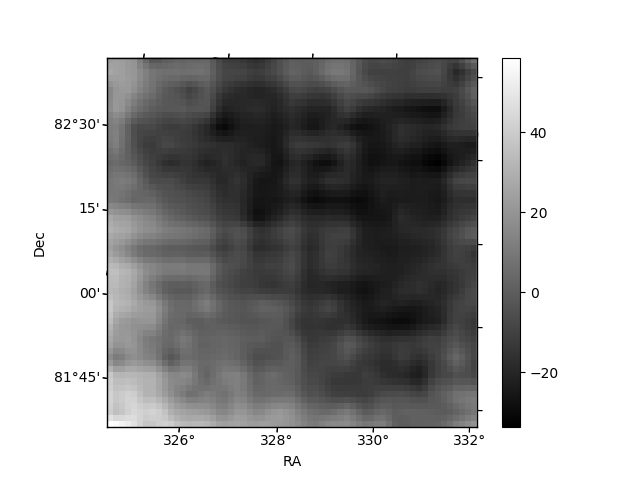 |
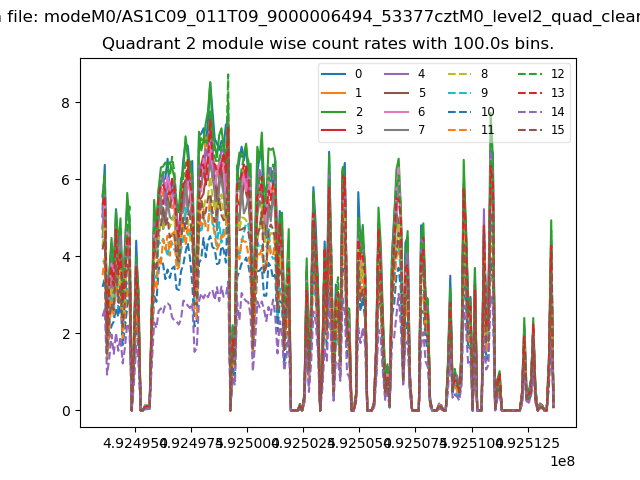
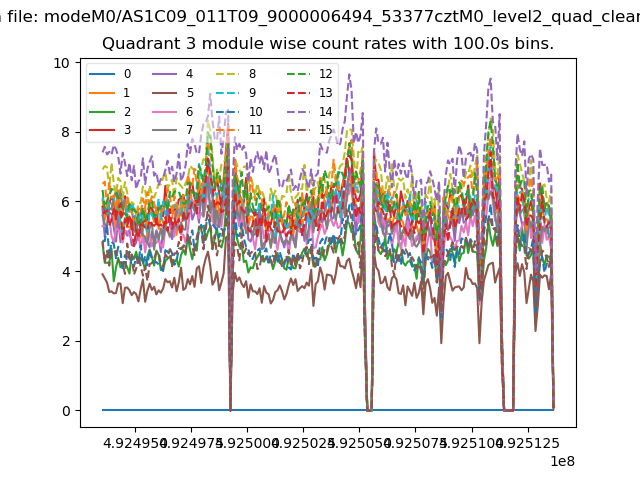
| Module-wise count rates for Quadrant C Data is divided into 100 sec bins |
 |
 |
| Module-wise count rates for Quadrant D Data is divided into 100 sec bins |
 |
 |
| Parameter | Plot |
|---|---|
| CZT HV Monitor | 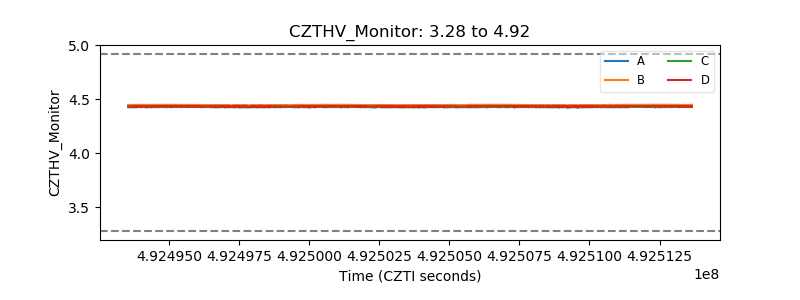 |
| D_VDD | 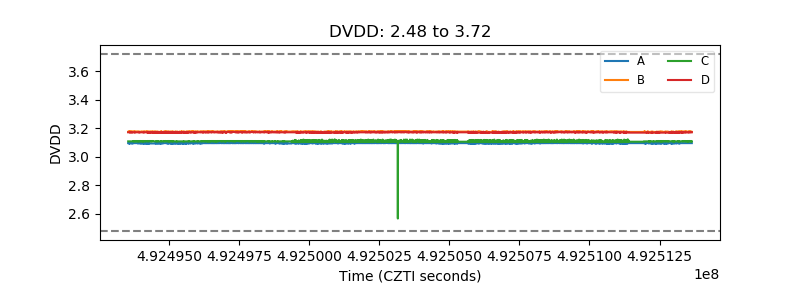 |
| Temperature 1 | 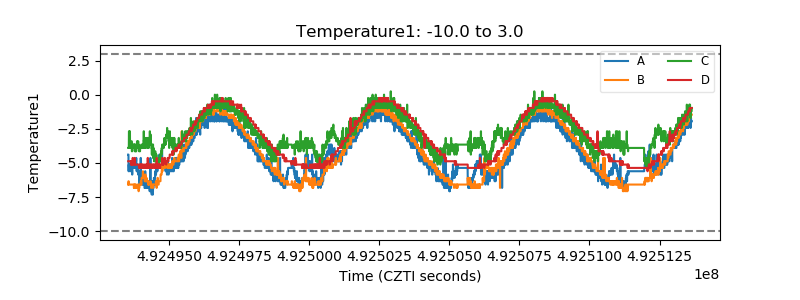 |
| Veto HV Monitor |  |
| Veto LLD | 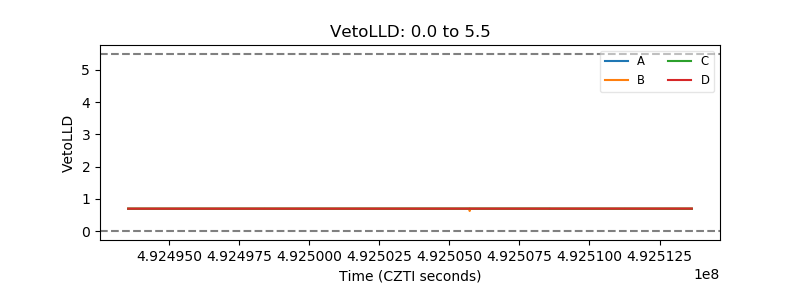 |
| Alpha Counter | 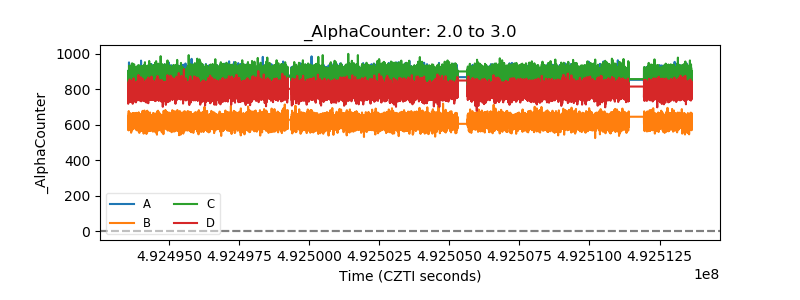 |
| _CPM_Rate | 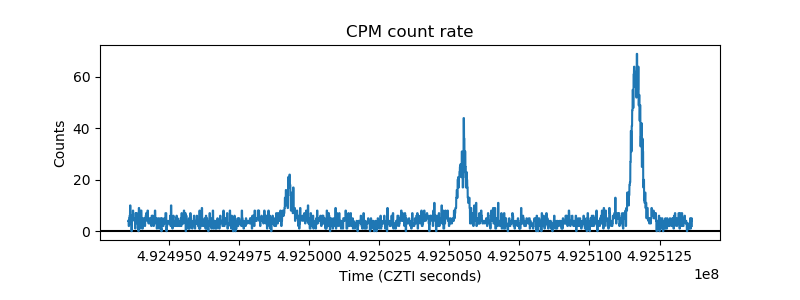 |
| CZT Counter | 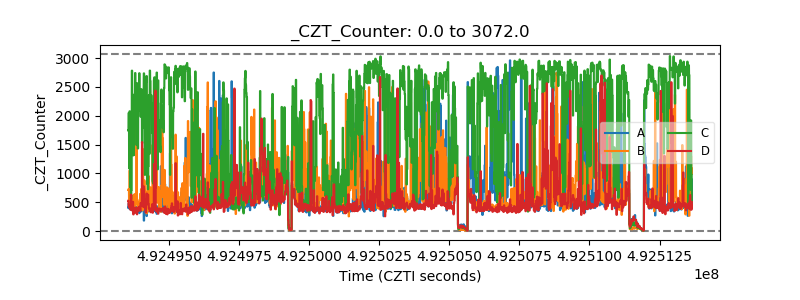 |
| +2.5 Volts monitor |  |
| +5 Volts monitor |  |
| _ROLL_ROT | 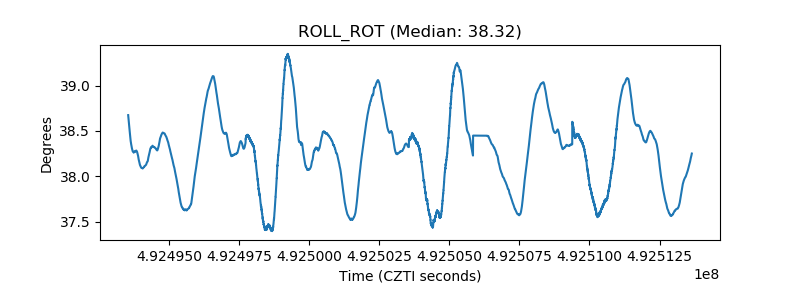 |
| _Roll_DEC | 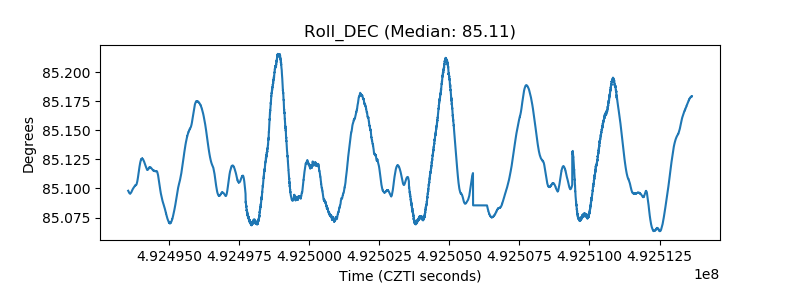 |
| _Roll_RA | 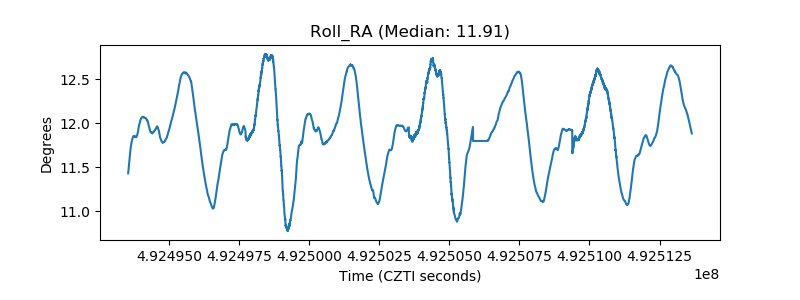 |
| Veto Counter | 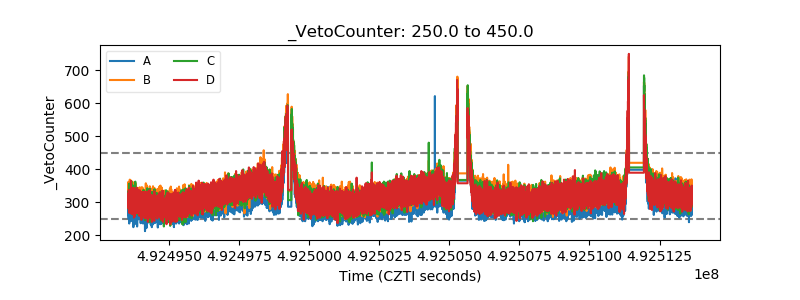 |