| Param | Original file | Final file |
|---|---|---|
| Filename | modeM0/AS1C09_011T09_9000006494_53378cztM0_level2.fits | modeM0/AS1C09_011T09_9000006494_53378cztM0_level2_quad_clean.evt |
| Size (bytes) | 755,677,440 | 74,096,640 |
| Size | 720.7 MB | 70.7 MB |
| Events in quadrant A | 3,347,690 | 586,100 |
| Events in quadrant B | 6,172,088 | 562,728 |
| Events in quadrant C | 13,581,004 | 155,853 |
| Events in quadrant D | 4,387,192 | 502,151 |
| Mode SS | |||
|---|---|---|---|
| Quadrant | BADHDUFLAG | Total packets | Discarded packets |
| A | 0 | 128 | 0 |
| B | 0 | 128 | 0 |
| C | 0 | 128 | 0 |
| D | 0 | 128 | 0 |
| Mode M0 | |||
|---|---|---|---|
| Quadrant | BADHDUFLAG | Total packets | Discarded packets |
| A | 0 | 14261 | 1 |
| B | 0 | 22631 | 1 |
| C | 0 | 44660 | 1 |
| D | 0 | 17350 | 1 |
| Mode M9 | |||
|---|---|---|---|
| Quadrant | BADHDUFLAG | Total packets | Discarded packets |
| A | 0 | 8 | 0 |
| B | 0 | 8 | 0 |
| C | 0 | 8 | 0 |
| D | 0 | 8 | 0 |
| Quadrant | Total seconds | Saturated seconds | Saturation percentage |
|---|---|---|---|
| A | 6249 | 120 | 1.920307% |
| B | 6250 | 990 | 15.840000% |
| C | 6250 | 4573 | 73.168000% |
| D | 6249 | 443 | 7.089134% |
Noise dominated data is calculated using 1-second bins in cleaned event files. If a bin has >2000 counts, and if more than 50% of those come from <1% of pixels, then it is considered to be noise-dominated and hence unusable.
| Quadrant | # 1 sec bins | Bins with >0 counts | Bins with >2000 counts | High rate bins dominated by noise | Noise dominated (total time) | Noise dominated (detector-on time) | Marked lightcurve |
|---|---|---|---|---|---|---|---|
| A | 7014 | 6250 | 29 | 29 | 0.41% | 0.46% | 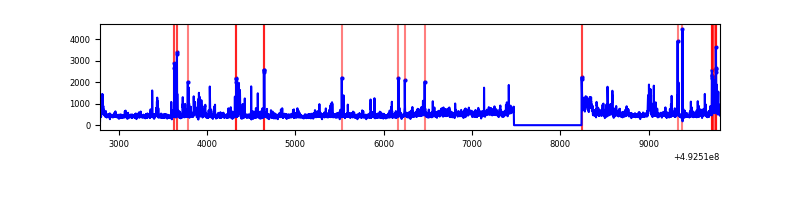 |
| B | 7015 | 6251 | 596 | 596 | 8.50% | 9.53% | 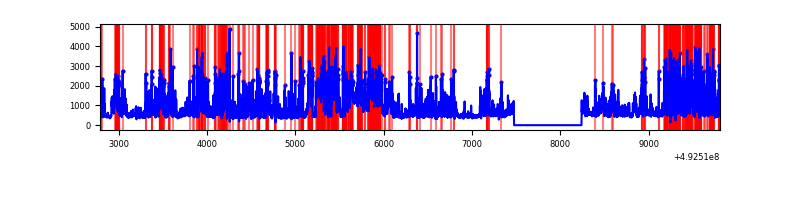 |
| C | 7014 | 6249 | 4387 | 4387 | 62.55% | 70.20% |  |
| D | 7014 | 6250 | 296 | 296 | 4.22% | 4.74% | 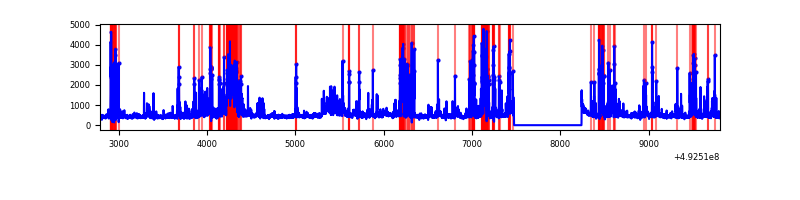 |
Top three noisy pixels from each quadrant. If the there are fewer than three noisy pixels in the level2.evt file, extra rows are filled as -1
| Pixel properties | Quadrant properties | ||||||
|---|---|---|---|---|---|---|---|
| Quadrant | DetID | PixID | Counts | Sigma | Mean | Median | Sigma |
| A | 3 | 27 | 202757 | 1244.61 | 660 | 645 | 162.4 |
| A | 15 | 174 | 195157 | 1197.8 | 660 | 645 | 162.4 |
| A | 3 | 62 | 60929 | 371.23 | 660 | 645 | 162.4 |
| B | 4 | 171 | 1400453 | 10518.89 | 624 | 600 | 133.1 |
| B | 4 | 206 | 922537 | 6927.69 | 624 | 600 | 133.1 |
| B | 2 | 249 | 704270 | 5287.57 | 624 | 600 | 133.1 |
| C | 1 | 241 | 9536162 | 99350.43 | 346 | 344 | 96.0 |
| C | 15 | 178 | 1586384 | 16524.41 | 346 | 344 | 96.0 |
| C | 15 | 224 | 879486 | 9159.48 | 346 | 344 | 96.0 |
| D | 11 | 245 | 586876 | 3289.33 | 626 | 599 | 178.2 |
| D | 12 | 17 | 473847 | 2655.18 | 626 | 599 | 178.2 |
| D | 2 | 249 | 182435 | 1020.2 | 626 | 599 | 178.2 |
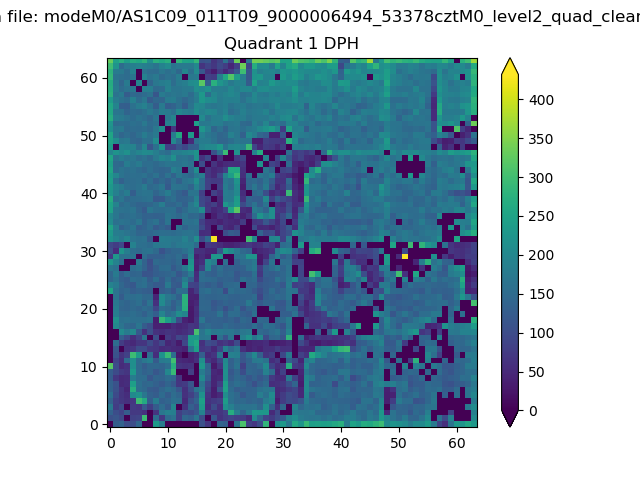
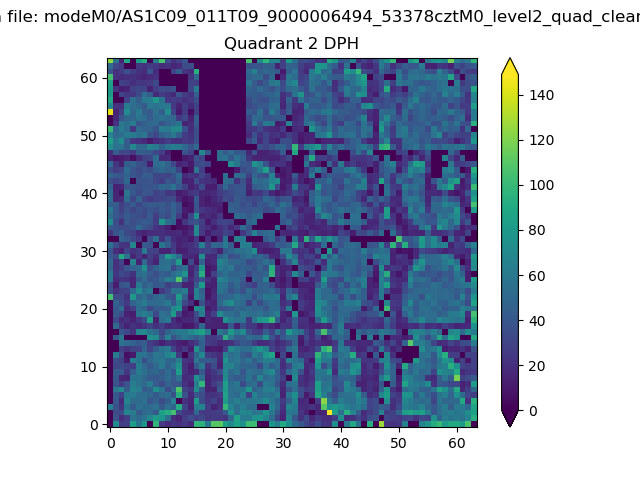
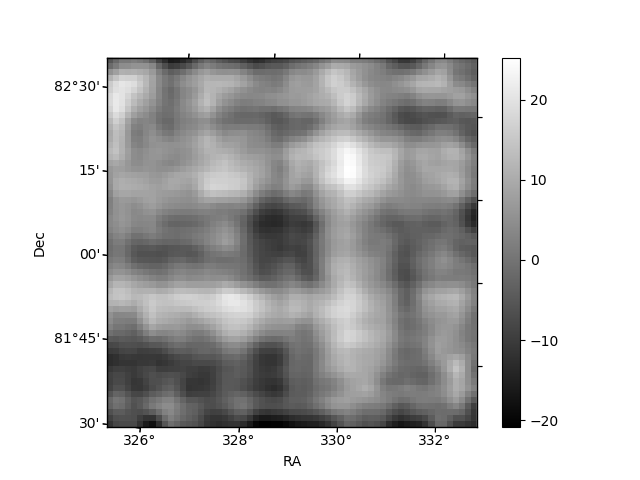
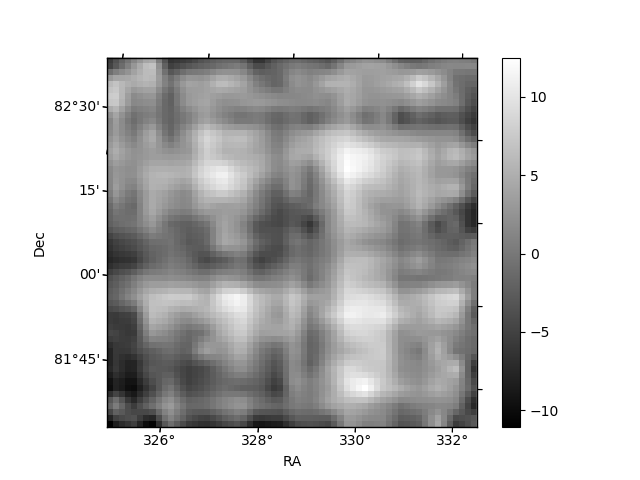
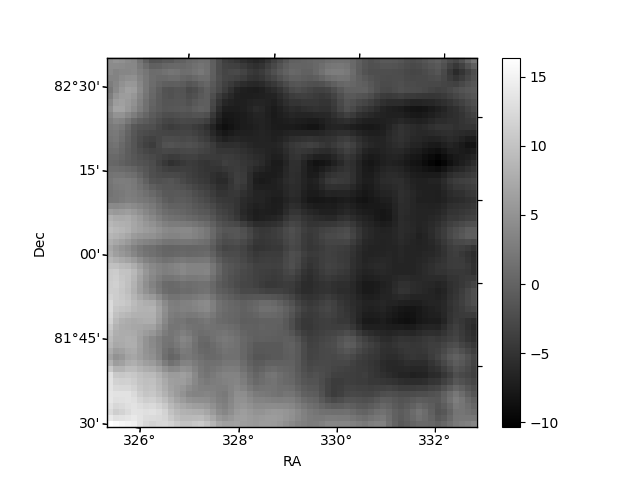
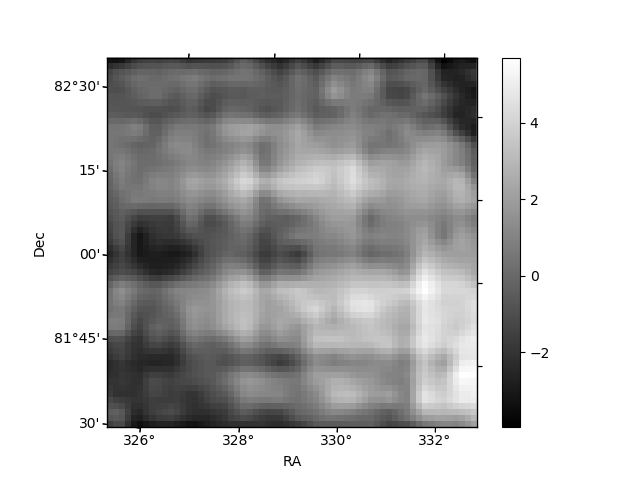
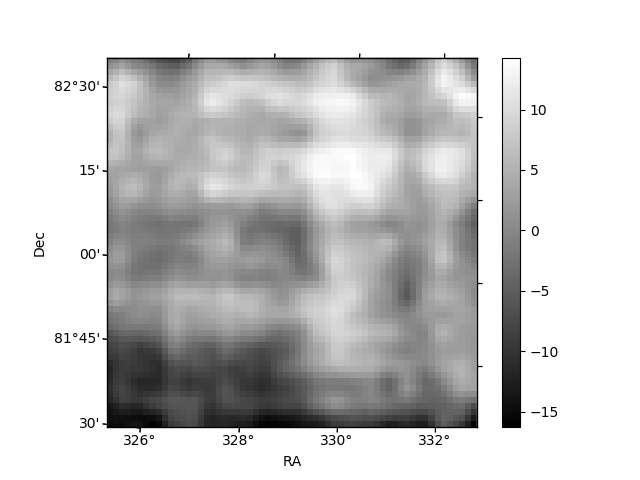
Histogram calculated using DETX and DETY for each event in the final _common_clean file
| Quadrant A | 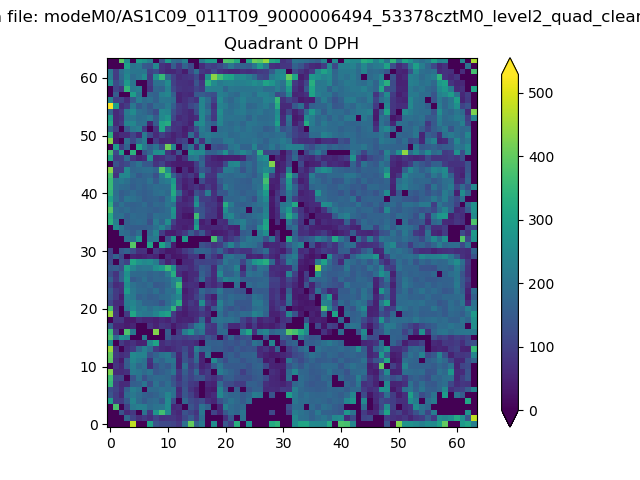 |
 |
Quadrant B |
|---|---|---|---|
| Quadrant D | 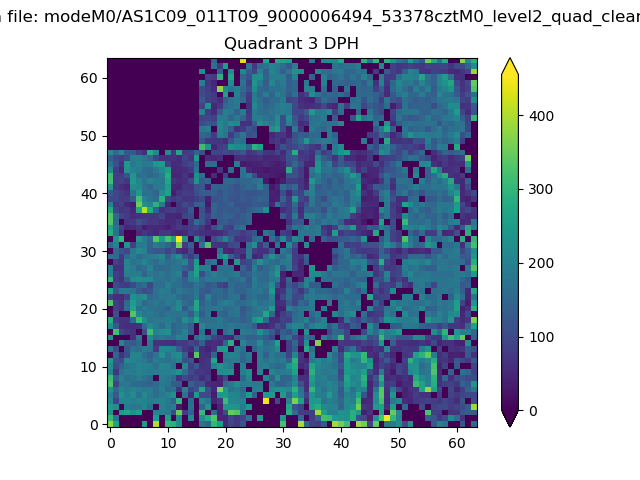 |
 |
Quadrant C |
| Plot type | Count rate plots | Images |
|---|---|---|
| Comparison with Poisson distribution Blue bars denote a histogram of data divided into 1 sec bins. Red curve is a Poisson curve with rate = median count rate of data. |
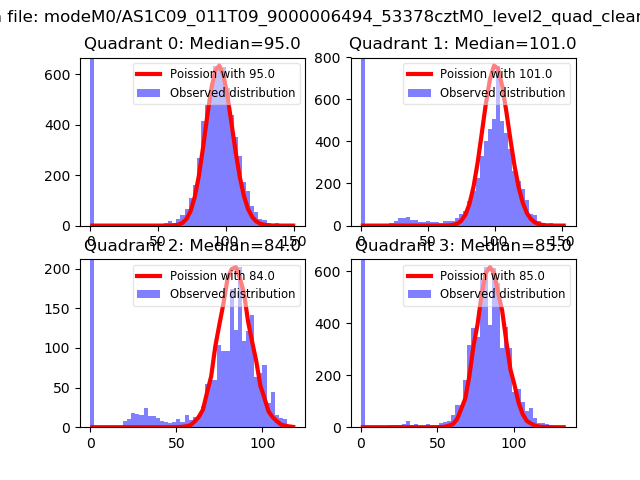 |
 |
| Quadrant-wise count rates Data is divided into 100 sec bins |
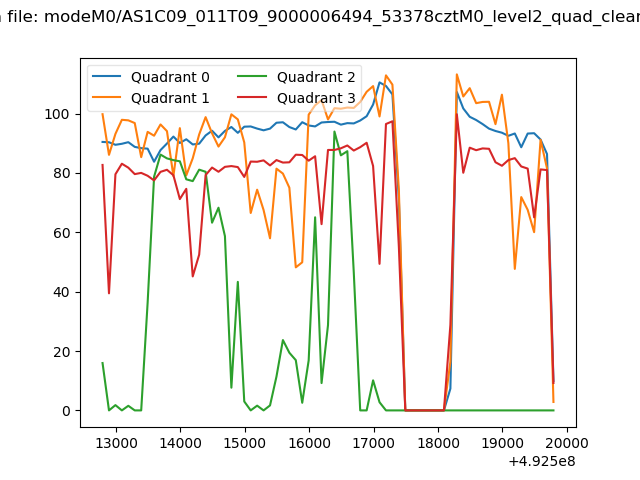 |
|
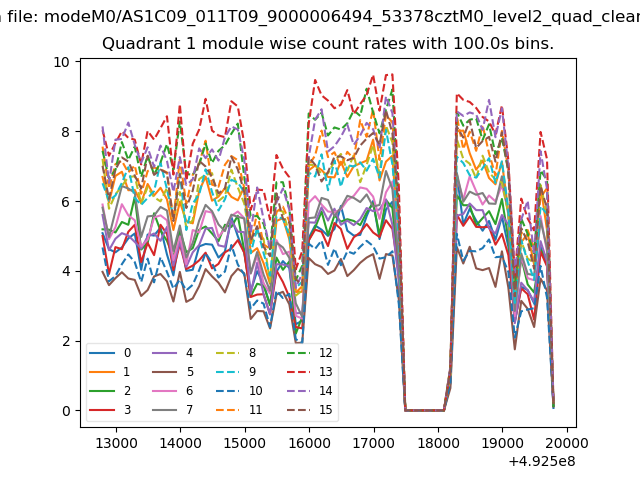
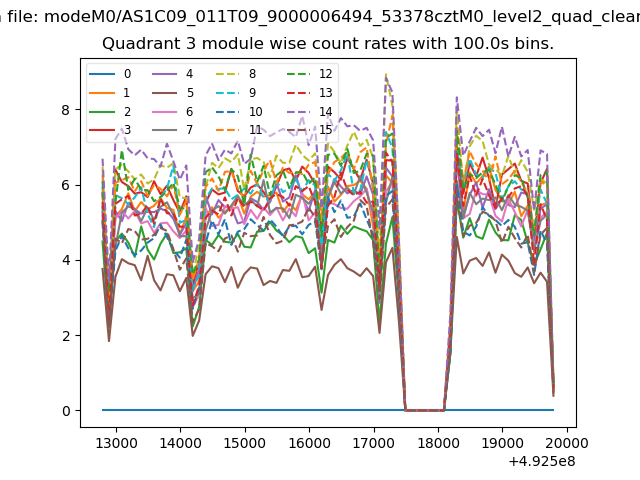
| Module-wise count rates for Quadrant A Data is divided into 100 sec bins |
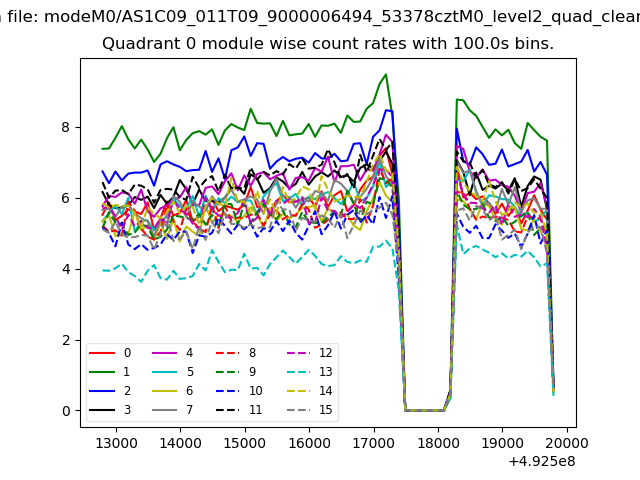 |
 |
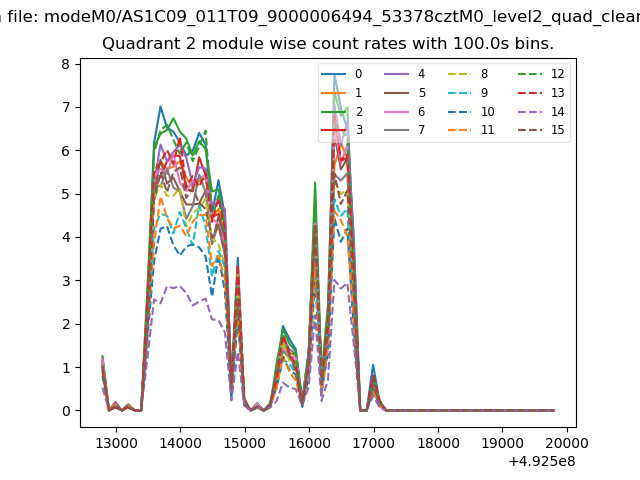
| Module-wise count rates for Quadrant B Data is divided into 100 sec bins |
 |
 |
| Module-wise count rates for Quadrant C Data is divided into 100 sec bins |
 |
 |
| Module-wise count rates for Quadrant D Data is divided into 100 sec bins |
 |
 |
| Parameter | Plot |
|---|---|
| CZT HV Monitor |  |
| D_VDD | 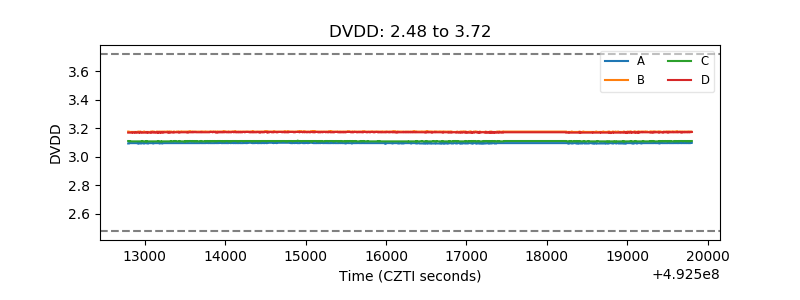 |
| Temperature 1 | 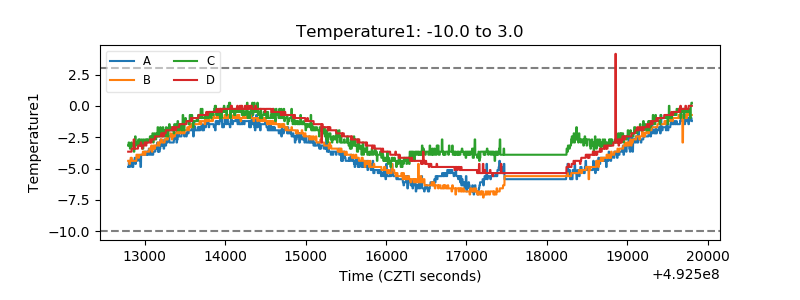 |
| Veto HV Monitor | 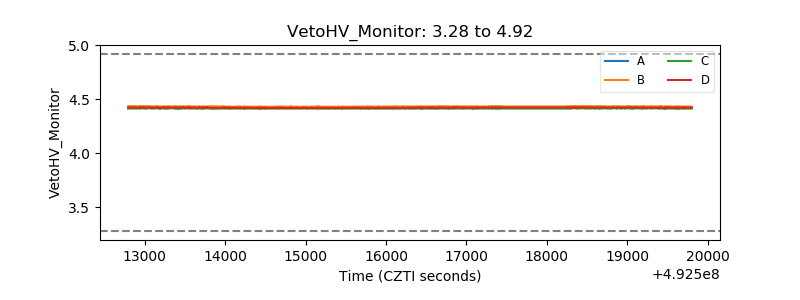 |
| Veto LLD | 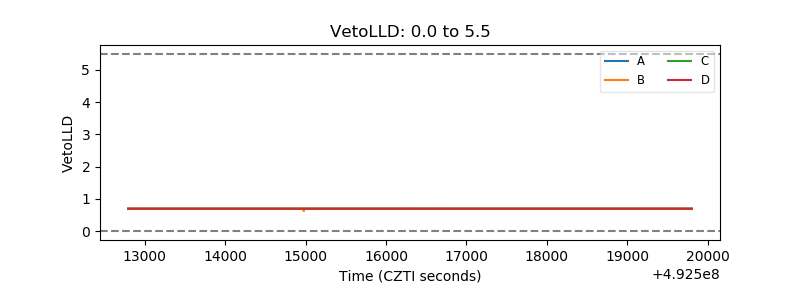 |
| Alpha Counter | 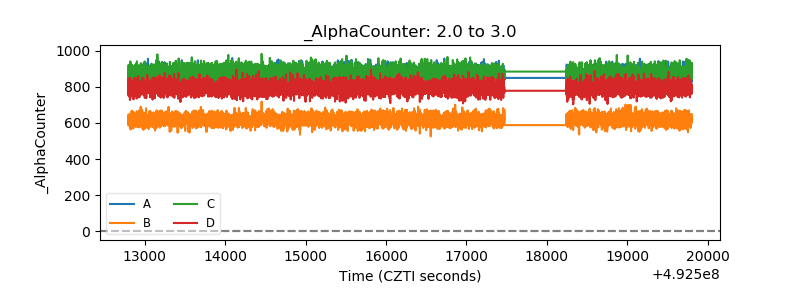 |
| _CPM_Rate | 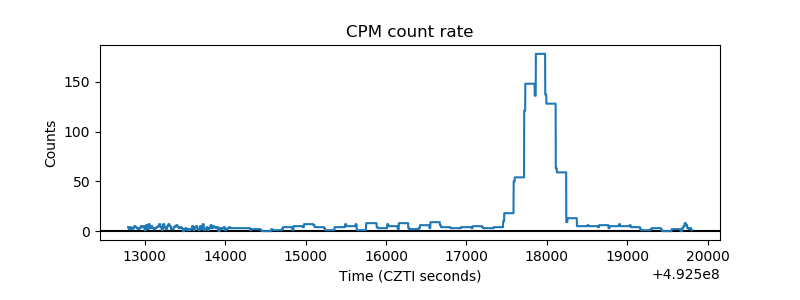 |
| CZT Counter | 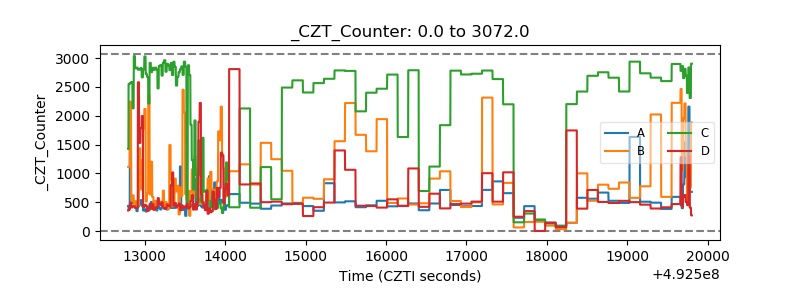 |
| +2.5 Volts monitor |  |
| +5 Volts monitor |  |
| _ROLL_ROT | 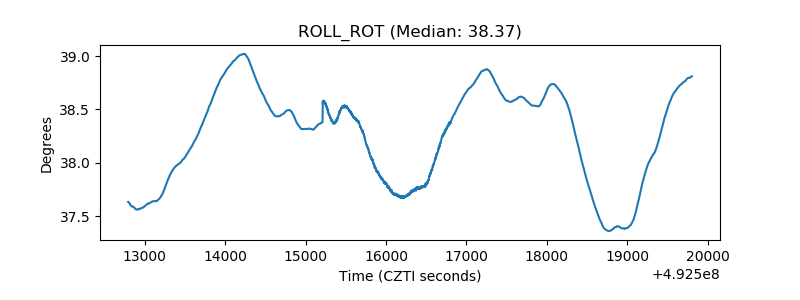 |
| _Roll_DEC | 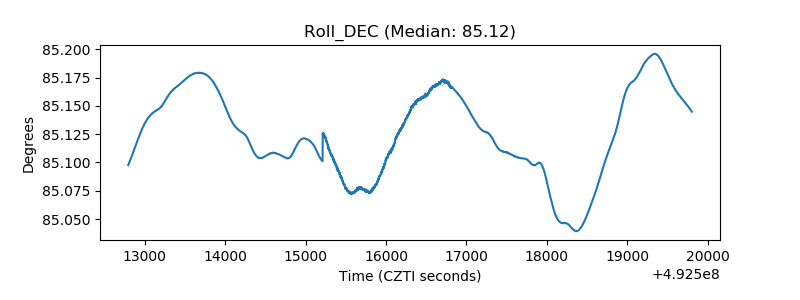 |
| _Roll_RA | 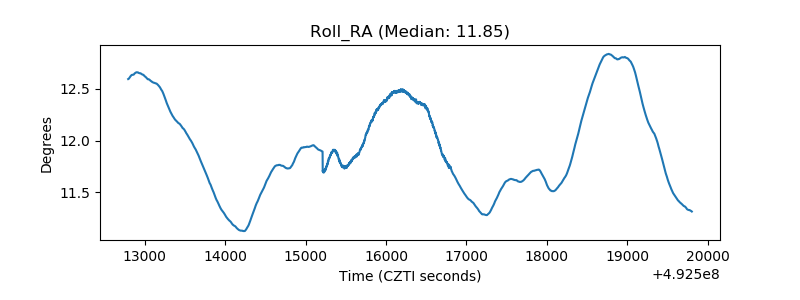 |
| Veto Counter | 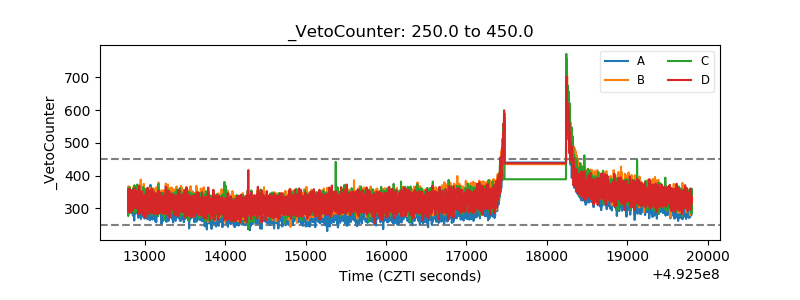 |