| Param | Original file | Final file |
|---|---|---|
| Filename | modeM0/AS1C09_011T09_9000006494_53383cztM0_level2.fits | modeM0/AS1C09_011T09_9000006494_53383cztM0_level2_quad_clean.evt |
| Size (bytes) | 620,553,600 | 81,820,800 |
| Size | 591.8 MB | 78.0 MB |
| Events in quadrant A | 4,780,457 | 550,574 |
| Events in quadrant B | 4,692,108 | 604,140 |
| Events in quadrant C | 9,455,300 | 372,485 |
| Events in quadrant D | 3,580,444 | 533,499 |
| Mode SS | |||
|---|---|---|---|
| Quadrant | BADHDUFLAG | Total packets | Discarded packets |
| A | 0 | 120 | 0 |
| B | 0 | 120 | 0 |
| C | 0 | 120 | 0 |
| D | 0 | 120 | 0 |
| Mode M0 | |||
|---|---|---|---|
| Quadrant | BADHDUFLAG | Total packets | Discarded packets |
| A | 0 | 18436 | 1 |
| B | 0 | 18111 | 1 |
| C | 0 | 32139 | 1 |
| D | 0 | 14896 | 1 |
| Mode M9 | |||
|---|---|---|---|
| Quadrant | BADHDUFLAG | Total packets | Discarded packets |
| A | 0 | 12 | 0 |
| B | 0 | 12 | 0 |
| C | 0 | 12 | 0 |
| D | 0 | 12 | 0 |
| Quadrant | Total seconds | Saturated seconds | Saturation percentage |
|---|---|---|---|
| A | 5964 | 631 | 10.580148% |
| B | 5964 | 525 | 8.802817% |
| C | 5964 | 2262 | 37.927565% |
| D | 5965 | 167 | 2.799665% |
Noise dominated data is calculated using 1-second bins in cleaned event files. If a bin has >2000 counts, and if more than 50% of those come from <1% of pixels, then it is considered to be noise-dominated and hence unusable.
| Quadrant | # 1 sec bins | Bins with >0 counts | Bins with >2000 counts | High rate bins dominated by noise | Noise dominated (total time) | Noise dominated (detector-on time) | Marked lightcurve |
|---|---|---|---|---|---|---|---|
| A | 7144 | 5965 | 439 | 439 | 6.15% | 7.36% | 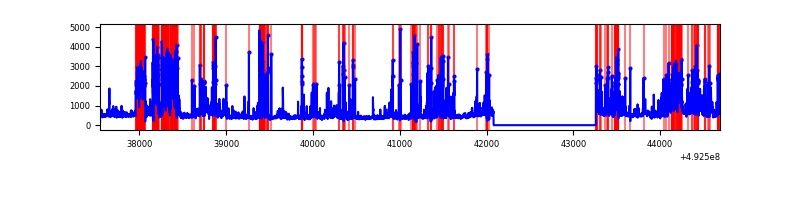 |
| B | 7144 | 5965 | 292 | 292 | 4.09% | 4.90% | 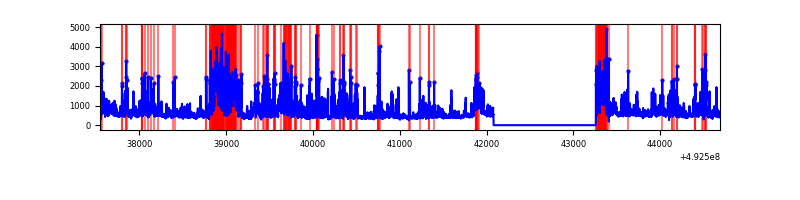 |
| C | 7144 | 5965 | 2012 | 2012 | 28.16% | 33.73% | 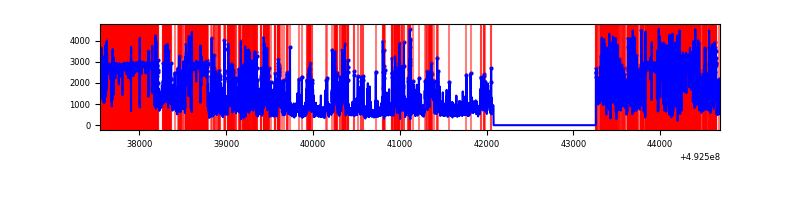 |
| D | 7145 | 5966 | 101 | 101 | 1.41% | 1.69% | 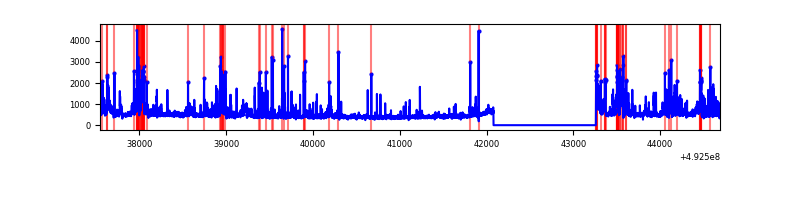 |
Top three noisy pixels from each quadrant. If the there are fewer than three noisy pixels in the level2.evt file, extra rows are filled as -1
| Pixel properties | Quadrant properties | ||||||
|---|---|---|---|---|---|---|---|
| Quadrant | DetID | PixID | Counts | Sigma | Mean | Median | Sigma |
| A | 15 | 174 | 726509 | 4749.26 | 612 | 598 | 152.8 |
| A | 12 | 115 | 726237 | 4747.48 | 612 | 598 | 152.8 |
| A | 0 | 8 | 460270 | 3007.4 | 612 | 598 | 152.8 |
| B | 4 | 206 | 687886 | 5334.94 | 620 | 598 | 128.8 |
| B | 10 | 28 | 472780 | 3665.22 | 620 | 598 | 128.8 |
| B | 4 | 171 | 386374 | 2994.51 | 620 | 598 | 128.8 |
| C | 1 | 241 | 4054584 | 30542.3 | 479 | 473 | 132.7 |
| C | 9 | 38 | 1539696 | 11595.99 | 479 | 473 | 132.7 |
| C | 15 | 224 | 1218409 | 9175.52 | 479 | 473 | 132.7 |
| D | 2 | 249 | 355725 | 1990.43 | 624 | 597 | 178.4 |
| D | 2 | 153 | 187400 | 1047.0 | 624 | 597 | 178.4 |
| D | 3 | 12 | 116363 | 648.85 | 624 | 597 | 178.4 |
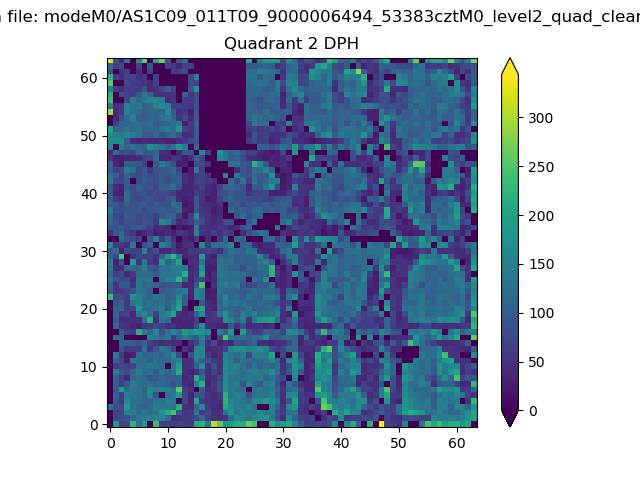
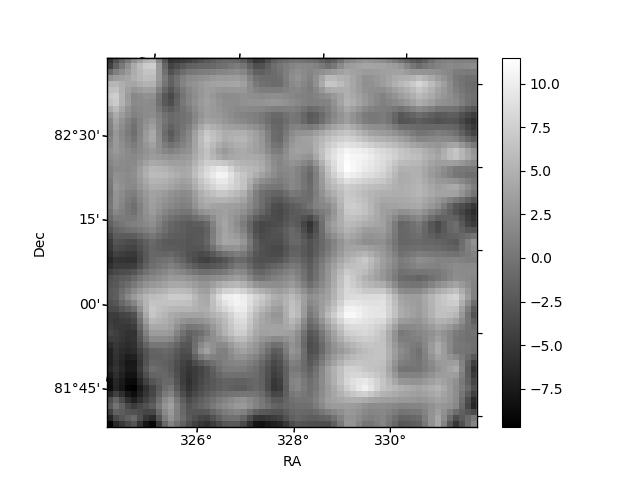
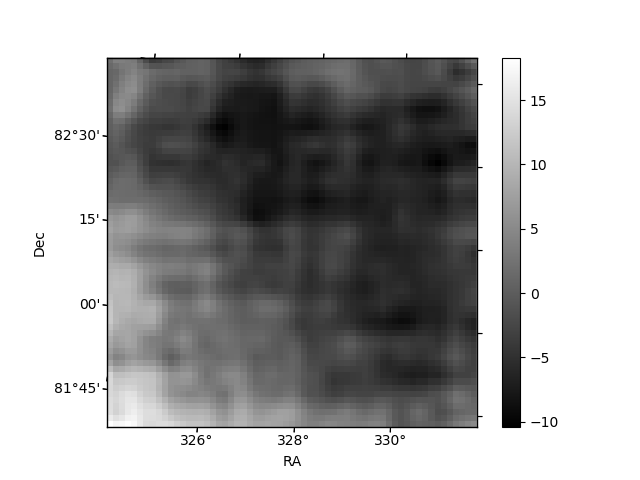
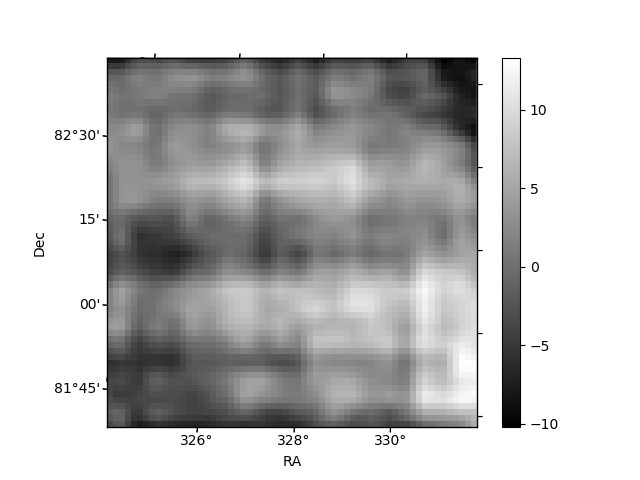
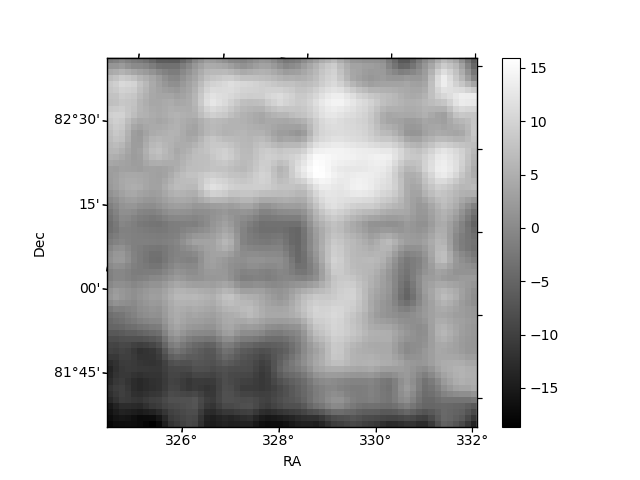
Histogram calculated using DETX and DETY for each event in the final _common_clean file
| Quadrant A | 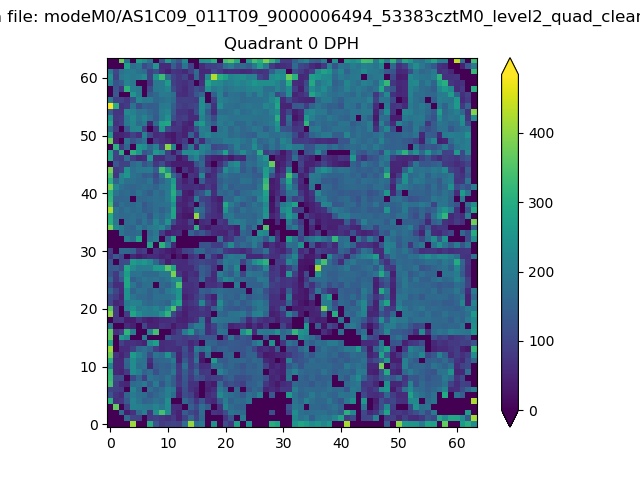 |
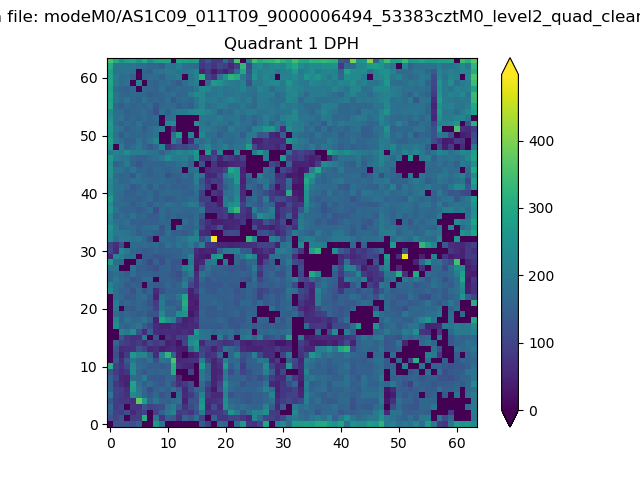 |
Quadrant B |
|---|---|---|---|
| Quadrant D | 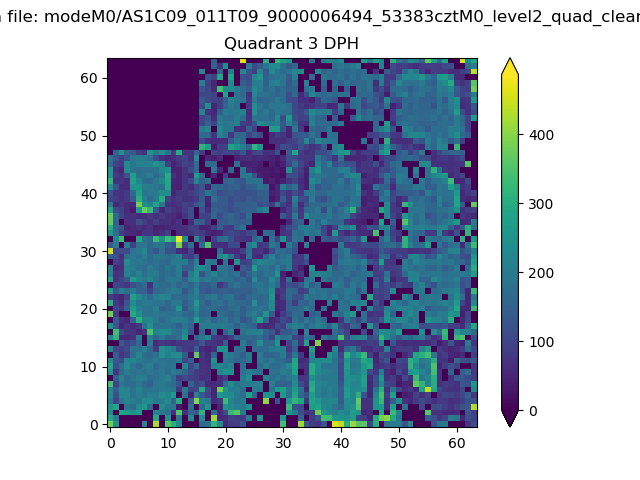 |
 |
Quadrant C |
| Plot type | Count rate plots | Images |
|---|---|---|
| Comparison with Poisson distribution Blue bars denote a histogram of data divided into 1 sec bins. Red curve is a Poisson curve with rate = median count rate of data. |
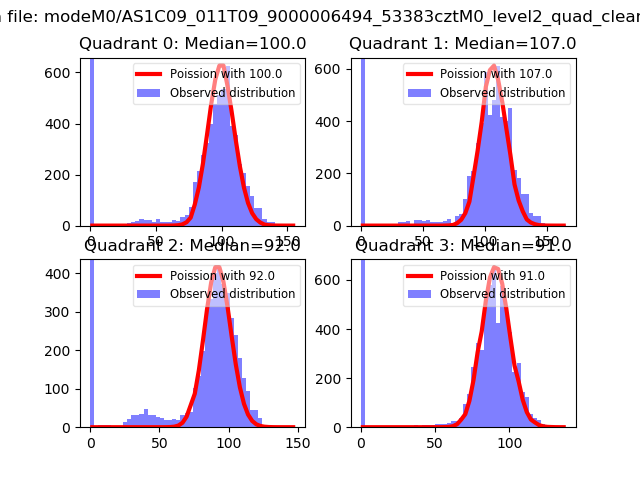 |
 |
| Quadrant-wise count rates Data is divided into 100 sec bins |
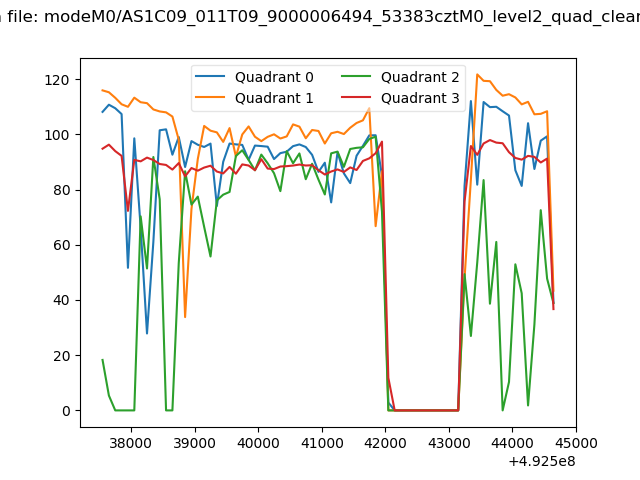 |
|
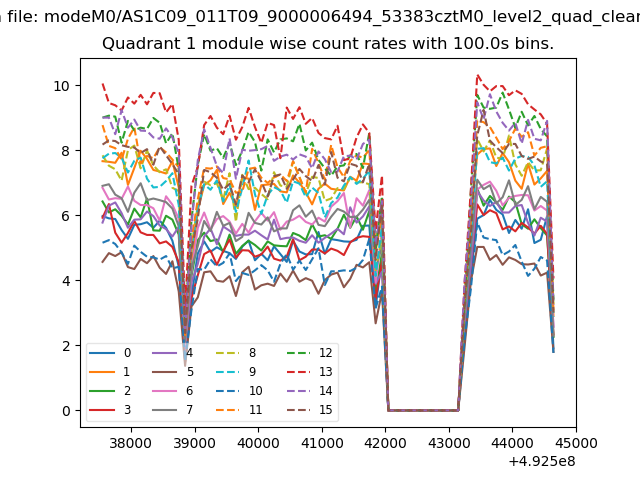
| Module-wise count rates for Quadrant A Data is divided into 100 sec bins |
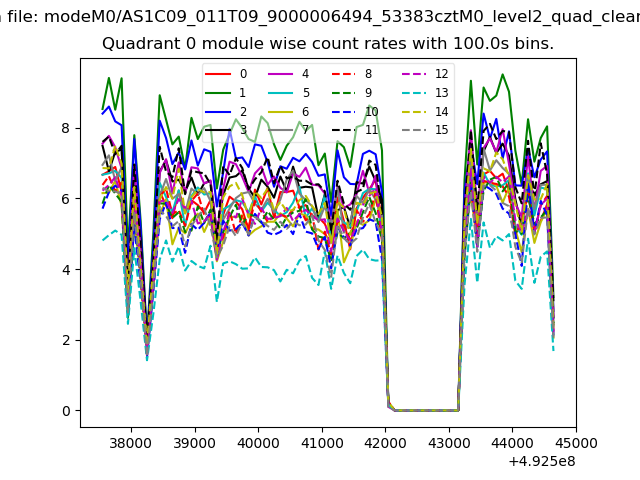 |
 |
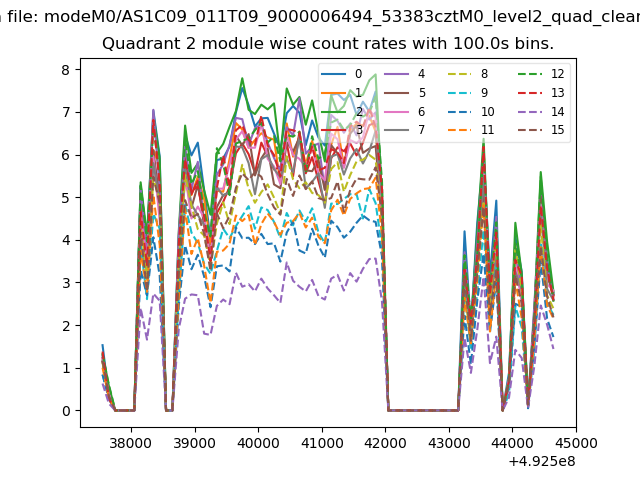
| Module-wise count rates for Quadrant B Data is divided into 100 sec bins |
 |
 |
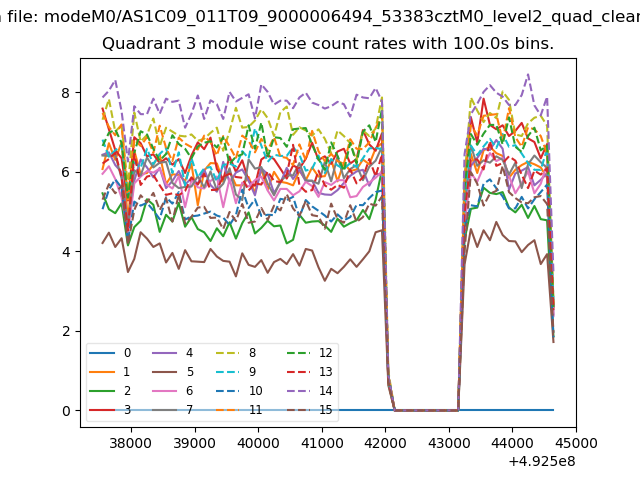
| Module-wise count rates for Quadrant C Data is divided into 100 sec bins |
 |
 |
| Module-wise count rates for Quadrant D Data is divided into 100 sec bins |
 |
 |
| Parameter | Plot |
|---|---|
| CZT HV Monitor | 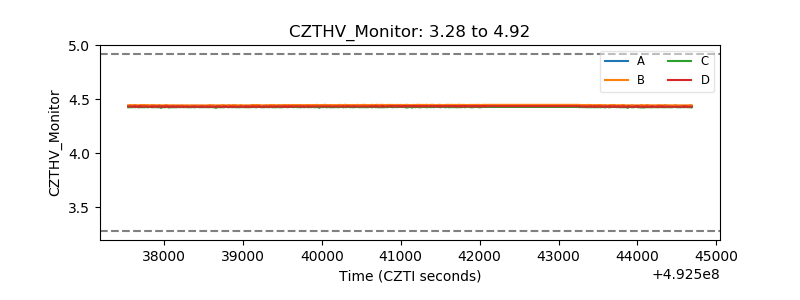 |
| D_VDD | 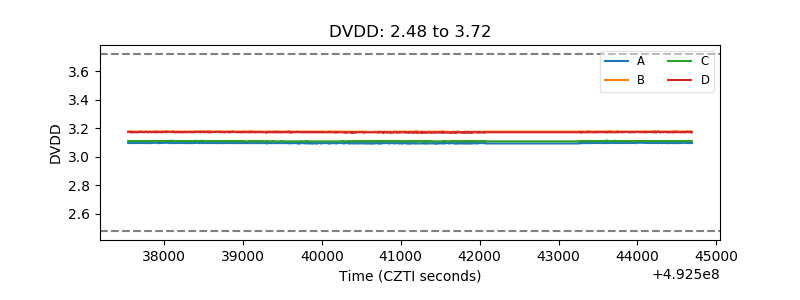 |
| Temperature 1 | 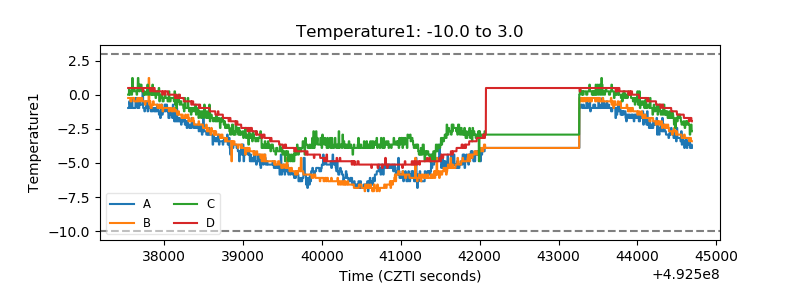 |
| Veto HV Monitor |  |
| Veto LLD | 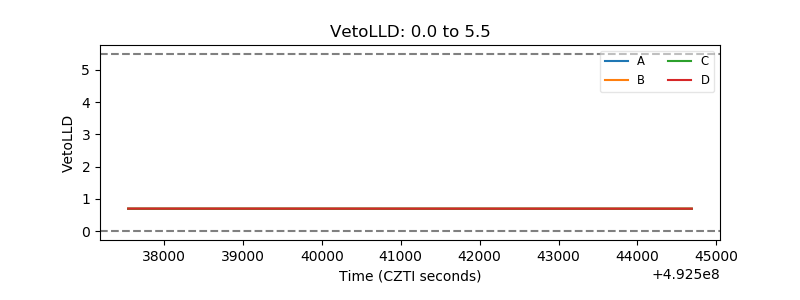 |
| Alpha Counter |  |
| _CPM_Rate | 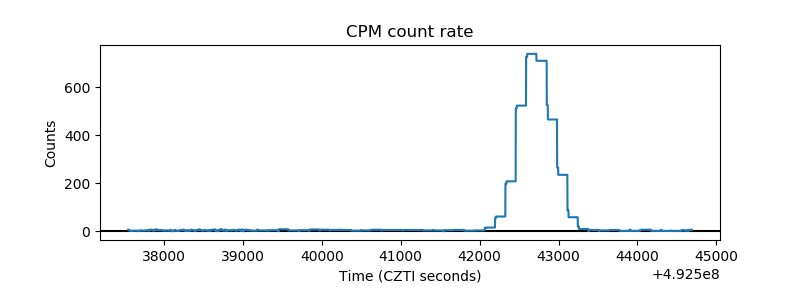 |
| CZT Counter | 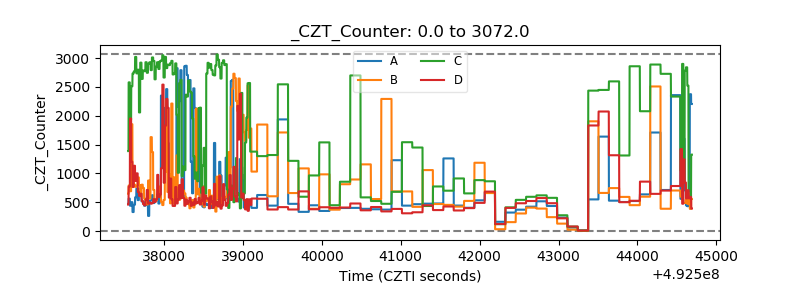 |
| +2.5 Volts monitor | 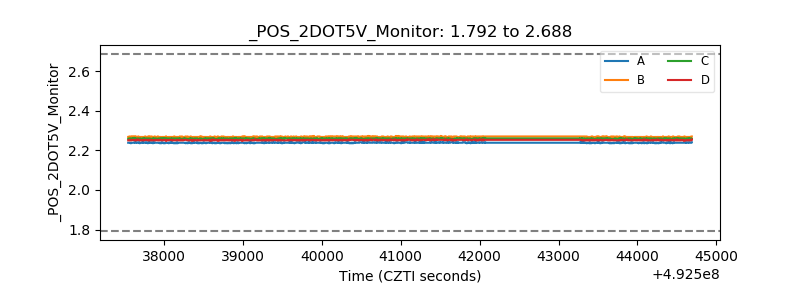 |
| +5 Volts monitor | 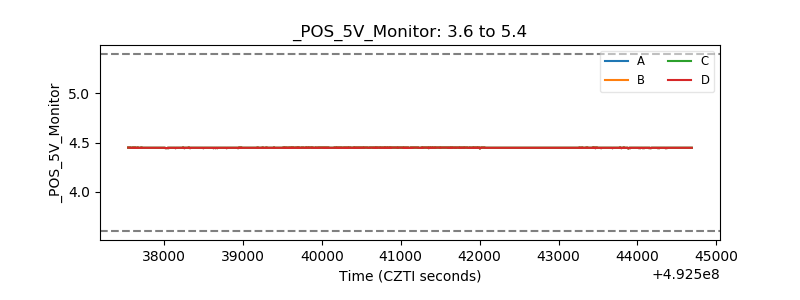 |
| _ROLL_ROT | 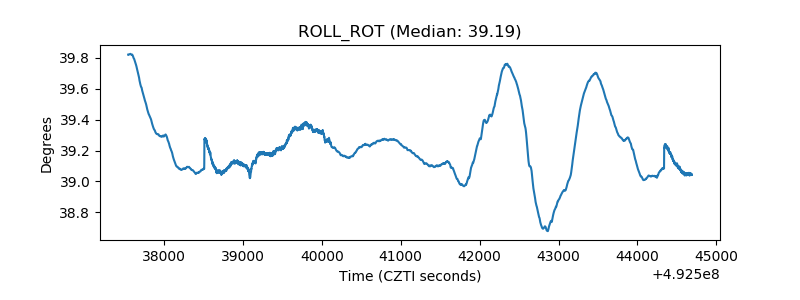 |
| _Roll_DEC |  |
| _Roll_RA | 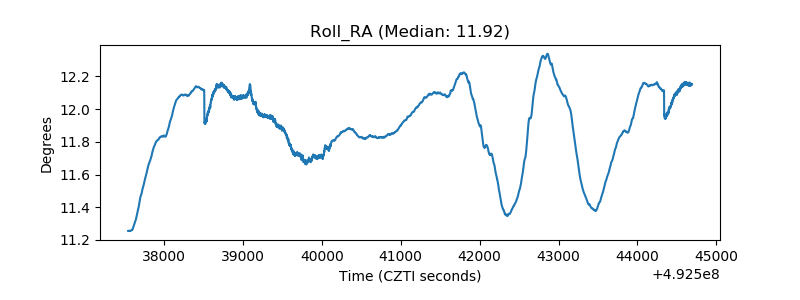 |
| Veto Counter | 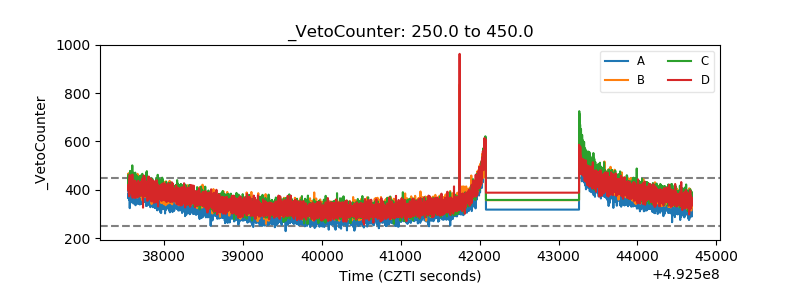 |