| Param | Original file | Final file |
|---|---|---|
| Filename | modeM0/AS1C09_011T09_9000006494_53384cztM0_level2.fits | modeM0/AS1C09_011T09_9000006494_53384cztM0_level2_quad_clean.evt |
| Size (bytes) | 701,772,480 | 85,593,600 |
| Size | 669.3 MB | 81.6 MB |
| Events in quadrant A | 4,345,626 | 609,399 |
| Events in quadrant B | 5,581,436 | 613,939 |
| Events in quadrant C | 11,251,562 | 355,843 |
| Events in quadrant D | 4,303,878 | 566,066 |
| Mode SS | |||
|---|---|---|---|
| Quadrant | BADHDUFLAG | Total packets | Discarded packets |
| A | 0 | 132 | 0 |
| B | 0 | 132 | 0 |
| C | 0 | 132 | 0 |
| D | 0 | 132 | 0 |
| Mode M0 | |||
|---|---|---|---|
| Quadrant | BADHDUFLAG | Total packets | Discarded packets |
| A | 0 | 17285 | 2 |
| B | 0 | 21058 | 1 |
| C | 0 | 37830 | 1 |
| D | 0 | 17320 | 1 |
| Mode M9 | |||
|---|---|---|---|
| Quadrant | BADHDUFLAG | Total packets | Discarded packets |
| A | 0 | 11 | 0 |
| B | 0 | 11 | 0 |
| C | 0 | 11 | 0 |
| D | 0 | 11 | 0 |
| Quadrant | Total seconds | Saturated seconds | Saturation percentage |
|---|---|---|---|
| A | 6388 | 377 | 5.901691% |
| B | 6388 | 837 | 13.102693% |
| C | 6389 | 2838 | 44.420097% |
| D | 6389 | 177 | 2.770387% |
Noise dominated data is calculated using 1-second bins in cleaned event files. If a bin has >2000 counts, and if more than 50% of those come from <1% of pixels, then it is considered to be noise-dominated and hence unusable.
| Quadrant | # 1 sec bins | Bins with >0 counts | Bins with >2000 counts | High rate bins dominated by noise | Noise dominated (total time) | Noise dominated (detector-on time) | Marked lightcurve |
|---|---|---|---|---|---|---|---|
| A | 7533 | 6389 | 252 | 252 | 3.35% | 3.94% | 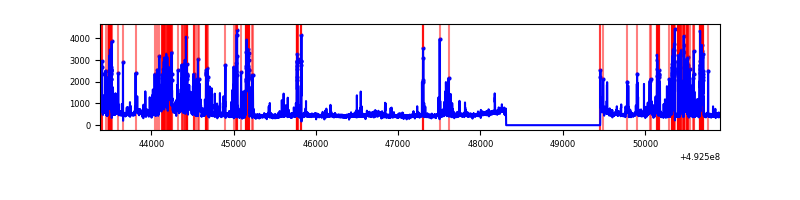 |
| B | 7532 | 6388 | 495 | 495 | 6.57% | 7.75% | 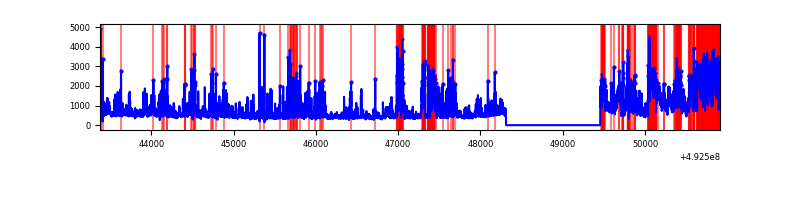 |
| C | 7534 | 6389 | 2579 | 2579 | 34.23% | 40.37% | 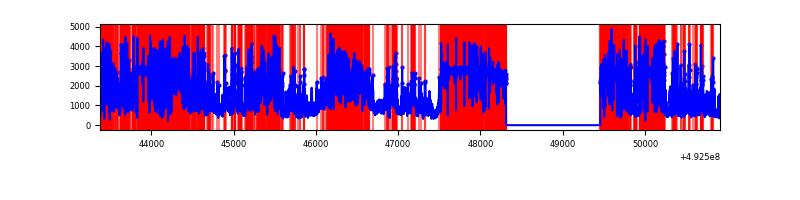 |
| D | 7534 | 6390 | 177 | 177 | 2.35% | 2.77% |  |
Top three noisy pixels from each quadrant. If the there are fewer than three noisy pixels in the level2.evt file, extra rows are filled as -1
| Pixel properties | Quadrant properties | ||||||
|---|---|---|---|---|---|---|---|
| Quadrant | DetID | PixID | Counts | Sigma | Mean | Median | Sigma |
| A | 0 | 8 | 604785 | 3679.24 | 665 | 649 | 164.2 |
| A | 15 | 174 | 553522 | 3367.04 | 665 | 649 | 164.2 |
| A | 8 | 249 | 155168 | 941.03 | 665 | 649 | 164.2 |
| B | 4 | 171 | 1487501 | 10901.12 | 649 | 628 | 136.4 |
| B | 4 | 206 | 677363 | 4961.53 | 649 | 628 | 136.4 |
| B | 10 | 247 | 218015 | 1593.79 | 649 | 628 | 136.4 |
| C | 1 | 241 | 4942646 | 36927.24 | 487 | 482 | 133.8 |
| C | 9 | 38 | 1753620 | 13099.23 | 487 | 482 | 133.8 |
| C | 15 | 224 | 1569922 | 11726.66 | 487 | 482 | 133.8 |
| D | 2 | 249 | 573477 | 3011.09 | 665 | 635 | 190.2 |
| D | 3 | 12 | 355477 | 1865.19 | 665 | 635 | 190.2 |
| D | 13 | 46 | 152102 | 796.17 | 665 | 635 | 190.2 |
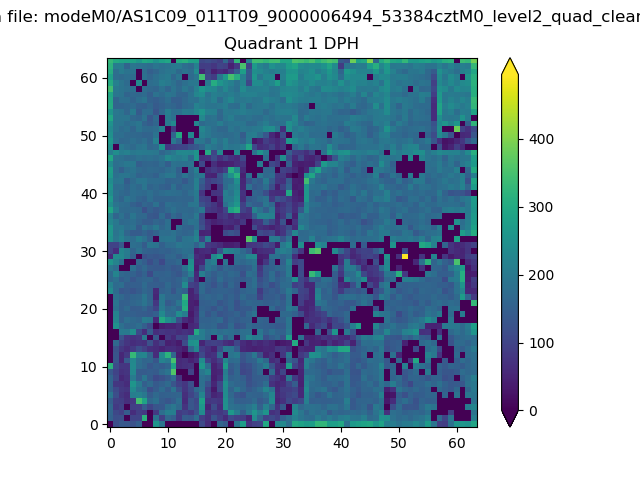
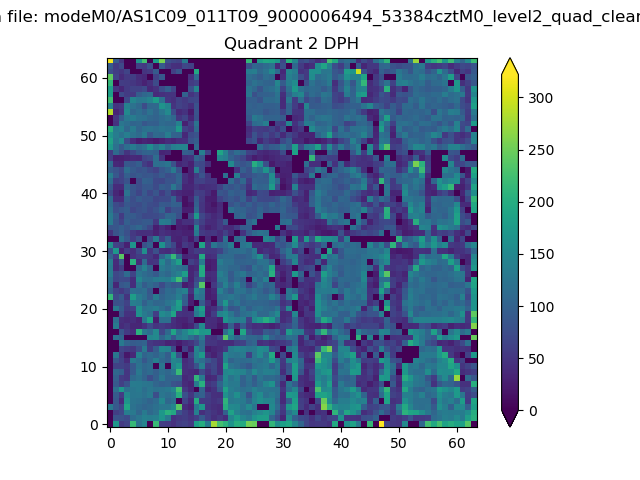
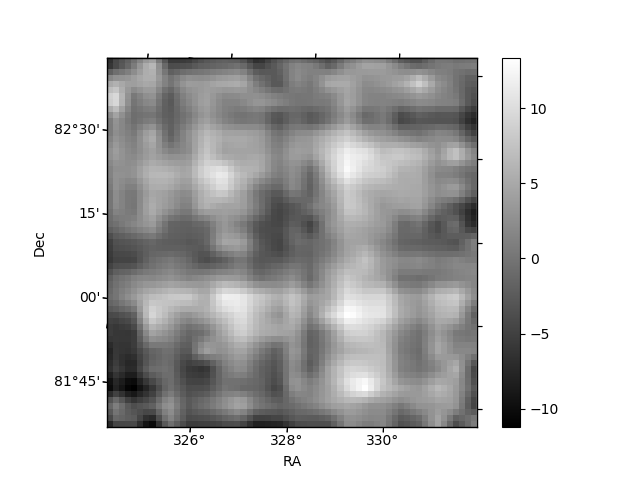
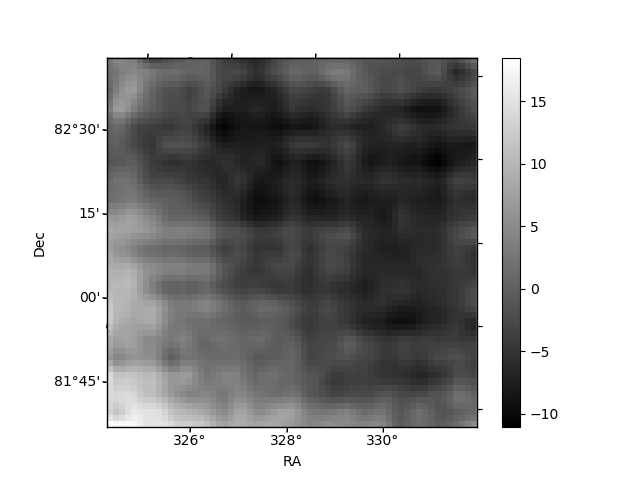
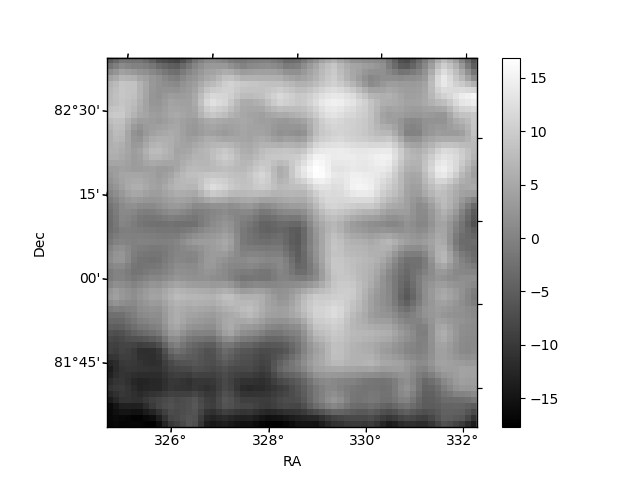
Histogram calculated using DETX and DETY for each event in the final _common_clean file
| Quadrant A | 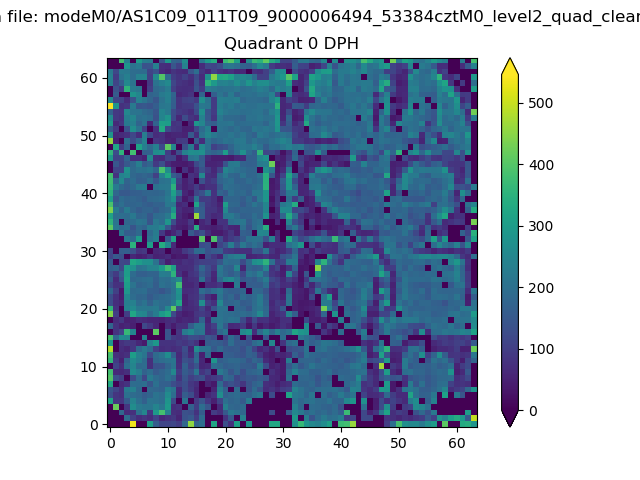 |
 |
Quadrant B |
|---|---|---|---|
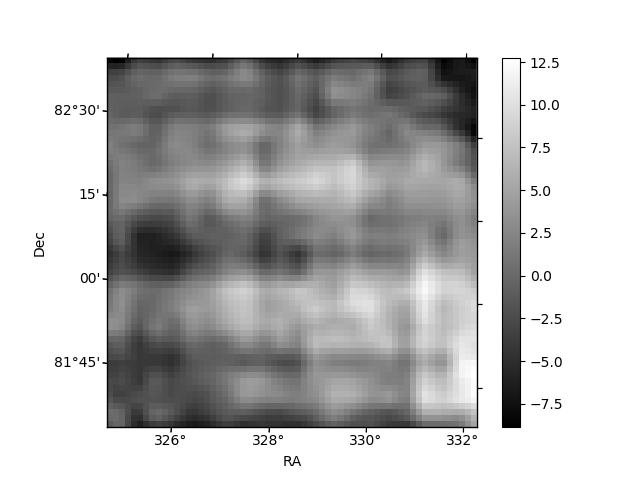
| Quadrant D | 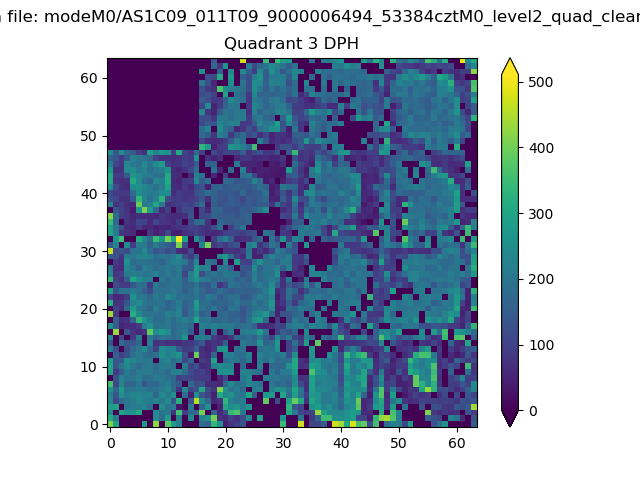 |
 |
Quadrant C |
| Plot type | Count rate plots | Images |
|---|---|---|
| Comparison with Poisson distribution Blue bars denote a histogram of data divided into 1 sec bins. Red curve is a Poisson curve with rate = median count rate of data. |
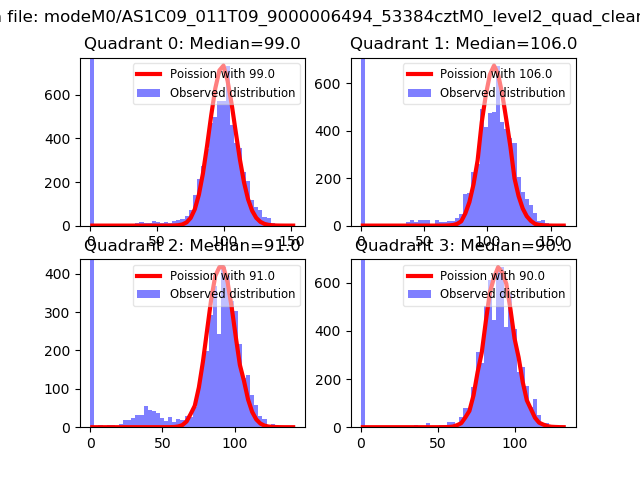 |
 |
| Quadrant-wise count rates Data is divided into 100 sec bins |
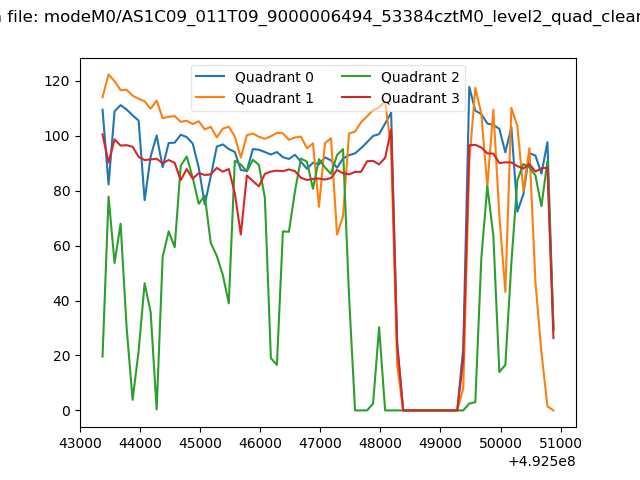 |
|
| Module-wise count rates for Quadrant A Data is divided into 100 sec bins |
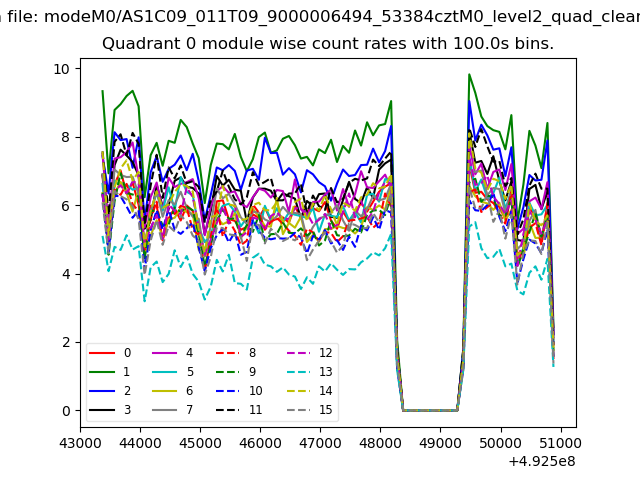 |
 |
| Module-wise count rates for Quadrant B Data is divided into 100 sec bins |
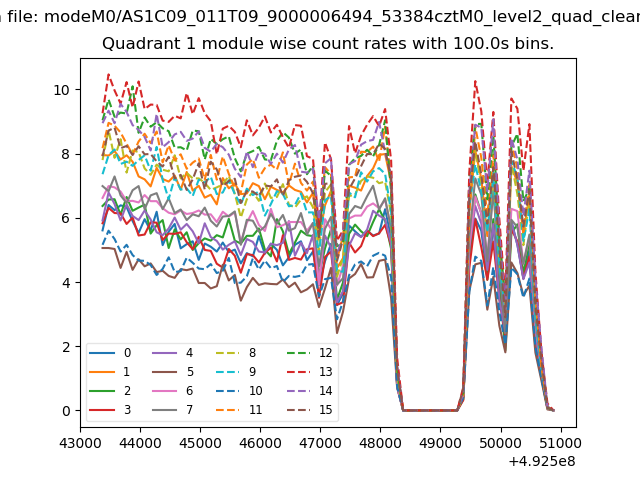 |
 |
| Module-wise count rates for Quadrant C Data is divided into 100 sec bins |
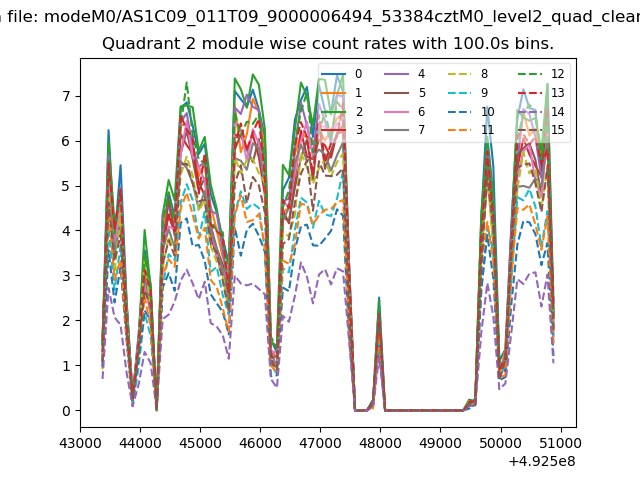 |
 |
| Module-wise count rates for Quadrant D Data is divided into 100 sec bins |
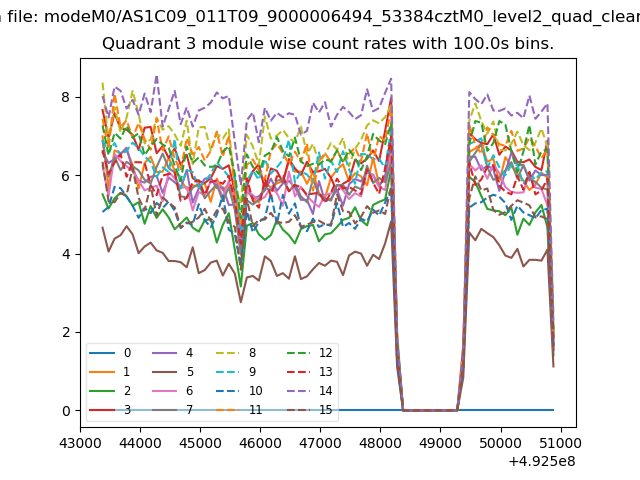 |
 |
| Parameter | Plot |
|---|---|
| CZT HV Monitor | 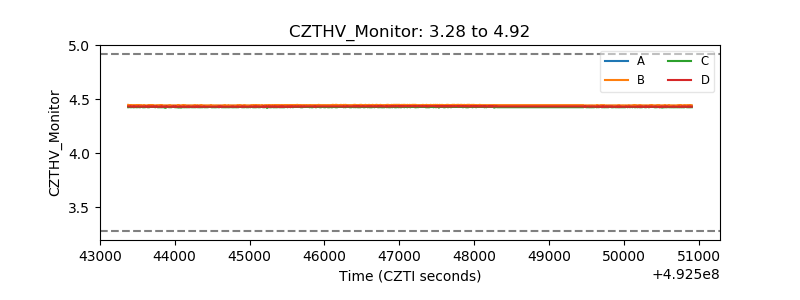 |
| D_VDD | 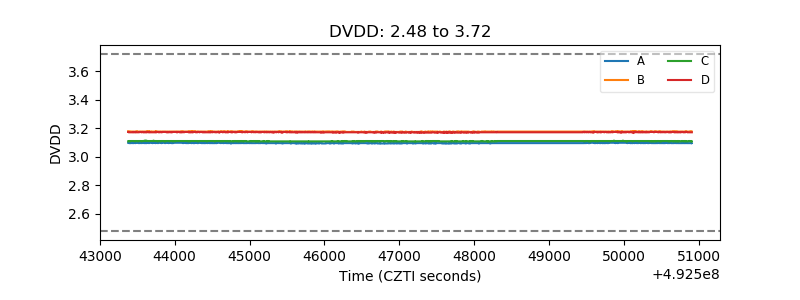 |
| Temperature 1 | 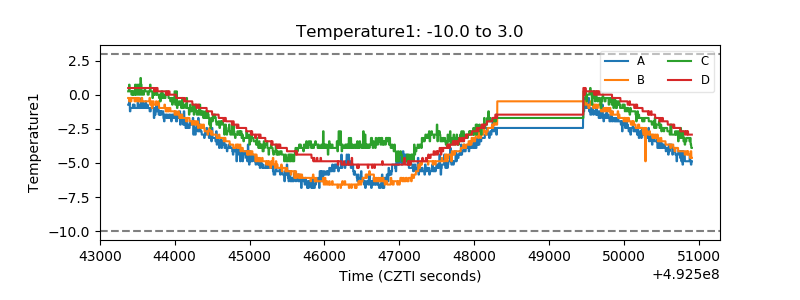 |
| Veto HV Monitor | 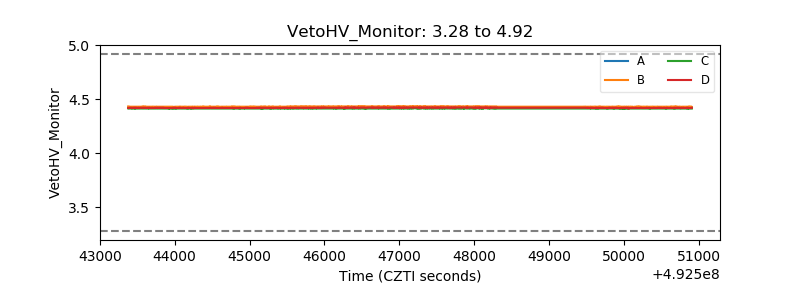 |
| Veto LLD | 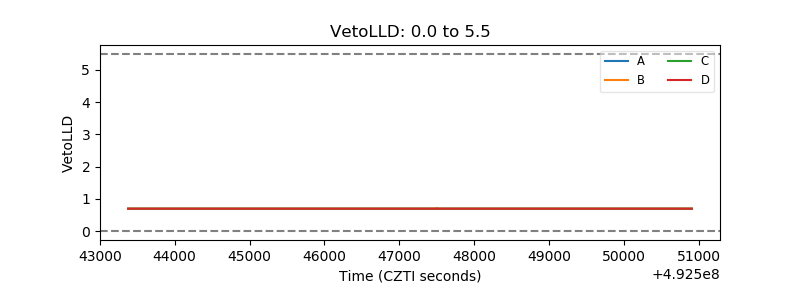 |
| Alpha Counter |  |
| _CPM_Rate | 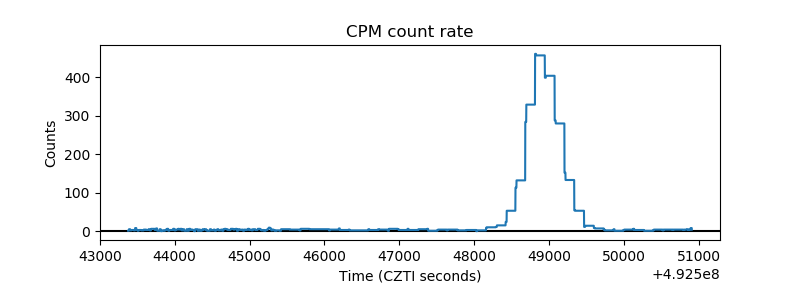 |
| CZT Counter | 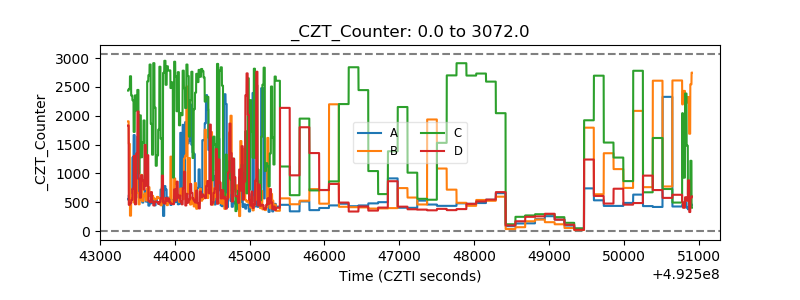 |
| +2.5 Volts monitor | 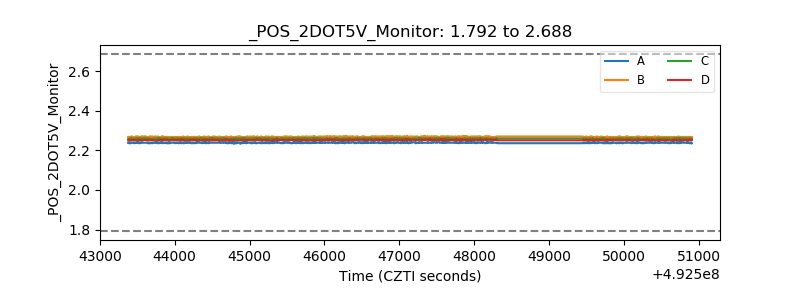 |
| +5 Volts monitor | 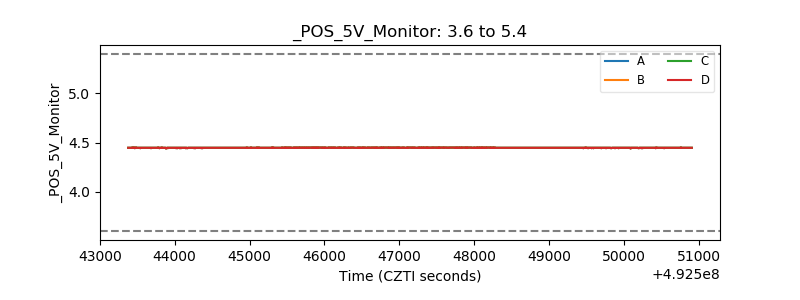 |
| _ROLL_ROT | 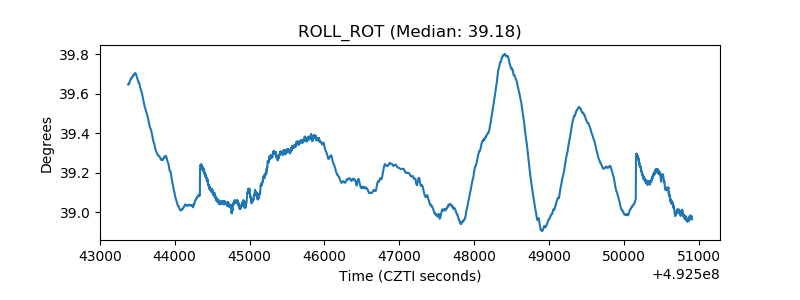 |
| _Roll_DEC | 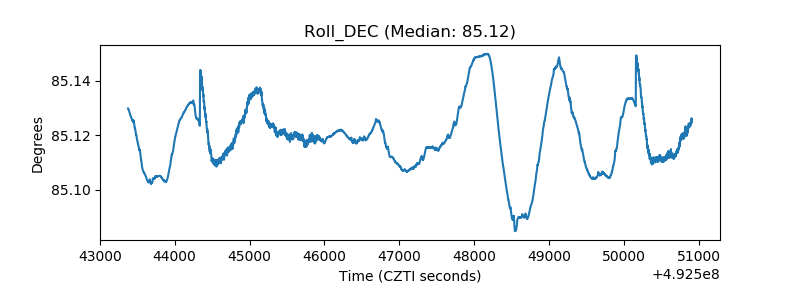 |
| _Roll_RA | 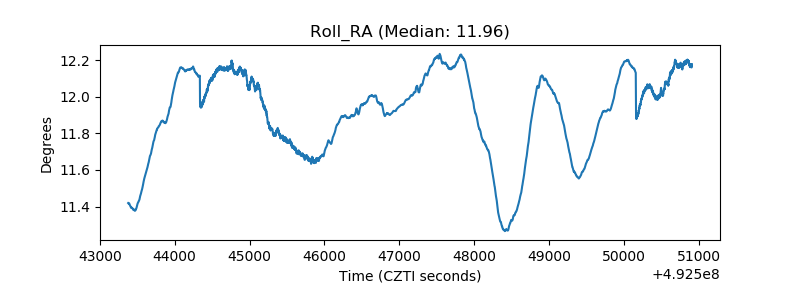 |
| Veto Counter | 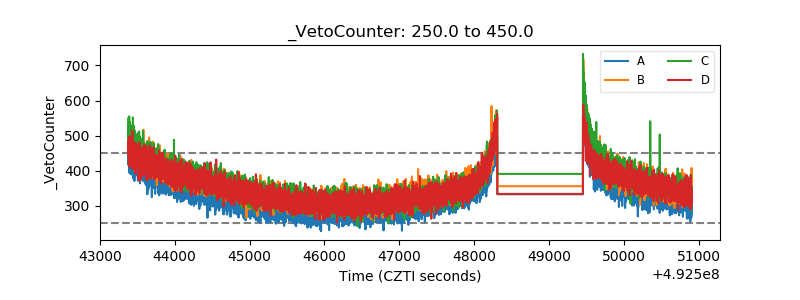 |