| Param | Original file | Final file |
|---|---|---|
| Filename | modeM0/AS1C09_011T09_9000006494_53386cztM0_level2.fits | modeM0/AS1C09_011T09_9000006494_53386cztM0_level2_quad_clean.evt |
| Size (bytes) | 699,459,840 | 94,798,080 |
| Size | 667.1 MB | 90.4 MB |
| Events in quadrant A | 3,807,395 | 686,824 |
| Events in quadrant B | 5,881,951 | 650,935 |
| Events in quadrant C | 10,250,750 | 462,618 |
| Events in quadrant D | 5,406,213 | 579,845 |
| Mode SS | |||
|---|---|---|---|
| Quadrant | BADHDUFLAG | Total packets | Discarded packets |
| A | 0 | 142 | 0 |
| B | 0 | 142 | 0 |
| C | 0 | 142 | 0 |
| D | 0 | 142 | 0 |
| Mode M0 | |||
|---|---|---|---|
| Quadrant | BADHDUFLAG | Total packets | Discarded packets |
| A | 0 | 16324 | 2 |
| B | 0 | 22536 | 3 |
| C | 0 | 35324 | 2 |
| D | 0 | 21231 | 2 |
| Mode M9 | |||
|---|---|---|---|
| Quadrant | BADHDUFLAG | Total packets | Discarded packets |
| A | 0 | 7 | 0 |
| B | 0 | 8 | 0 |
| C | 0 | 8 | 0 |
| D | 0 | 8 | 0 |
| Quadrant | Total seconds | Saturated seconds | Saturation percentage |
|---|---|---|---|
| A | 7037 | 88 | 1.250533% |
| B | 7036 | 950 | 13.501990% |
| C | 7036 | 2321 | 32.987493% |
| D | 7036 | 596 | 8.470722% |
Noise dominated data is calculated using 1-second bins in cleaned event files. If a bin has >2000 counts, and if more than 50% of those come from <1% of pixels, then it is considered to be noise-dominated and hence unusable.
| Quadrant | # 1 sec bins | Bins with >0 counts | Bins with >2000 counts | High rate bins dominated by noise | Noise dominated (total time) | Noise dominated (detector-on time) | Marked lightcurve |
|---|---|---|---|---|---|---|---|
| A | 7672 | 7038 | 43 | 43 | 0.56% | 0.61% | 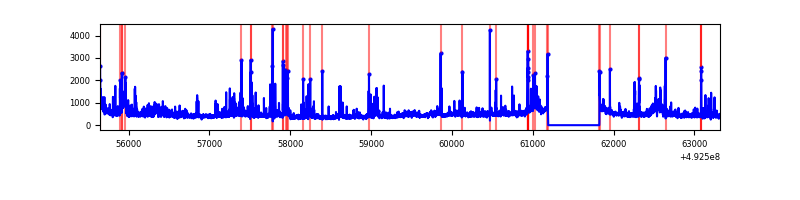 |
| B | 7671 | 7037 | 535 | 535 | 6.97% | 7.60% | 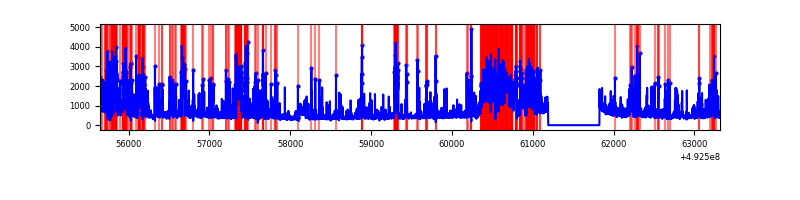 |
| C | 7671 | 7036 | 2006 | 2006 | 26.15% | 28.51% | 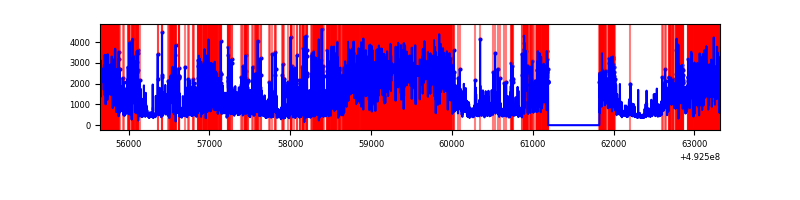 |
| D | 7671 | 7037 | 445 | 445 | 5.80% | 6.32% | 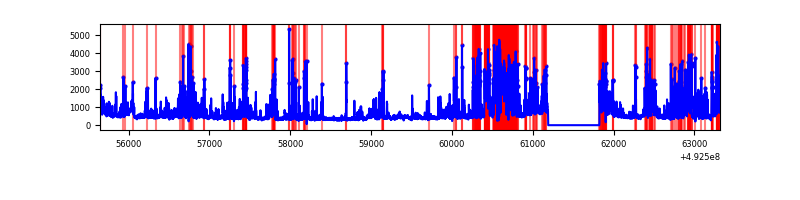 |
Top three noisy pixels from each quadrant. If the there are fewer than three noisy pixels in the level2.evt file, extra rows are filled as -1
| Pixel properties | Quadrant properties | ||||||
|---|---|---|---|---|---|---|---|
| Quadrant | DetID | PixID | Counts | Sigma | Mean | Median | Sigma |
| A | 8 | 249 | 198051 | 1066.45 | 740 | 722 | 185.0 |
| A | 15 | 174 | 148521 | 798.77 | 740 | 722 | 185.0 |
| A | 0 | 8 | 143114 | 769.55 | 740 | 722 | 185.0 |
| B | 4 | 206 | 1823718 | 12292.64 | 705 | 682 | 148.3 |
| B | 4 | 171 | 615186 | 4143.57 | 705 | 682 | 148.3 |
| B | 8 | 234 | 203221 | 1365.71 | 705 | 682 | 148.3 |
| C | 15 | 178 | 4035036 | 23710.06 | 612 | 602 | 170.2 |
| C | 15 | 224 | 2624201 | 15418.69 | 612 | 602 | 170.2 |
| C | 1 | 241 | 652770 | 3832.74 | 612 | 602 | 170.2 |
| D | 3 | 12 | 1377248 | 6859.25 | 697 | 666 | 200.7 |
| D | 2 | 249 | 375837 | 1869.41 | 697 | 666 | 200.7 |
| D | 2 | 153 | 312528 | 1553.95 | 697 | 666 | 200.7 |
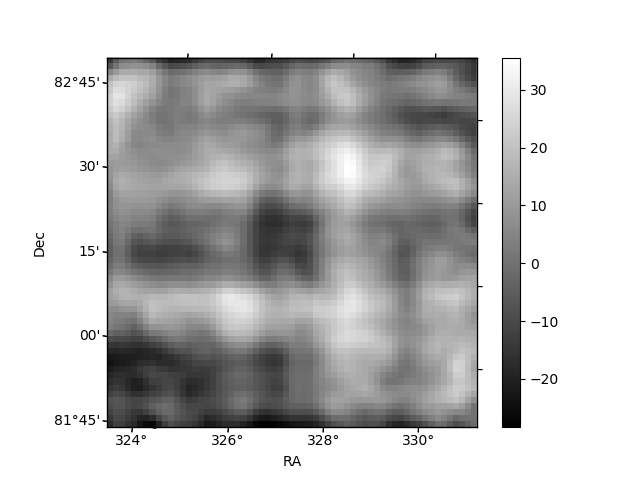
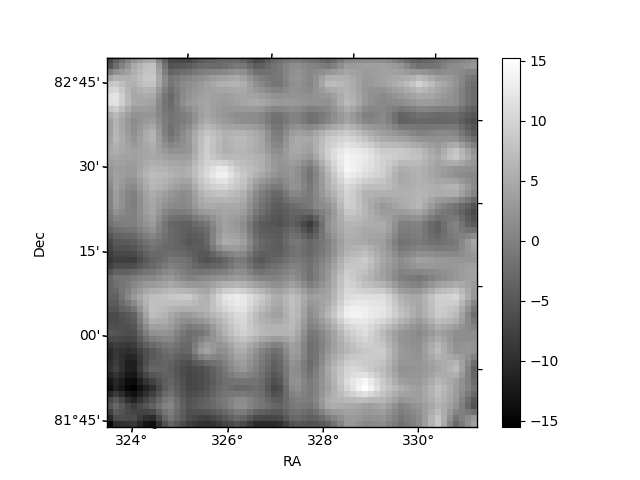
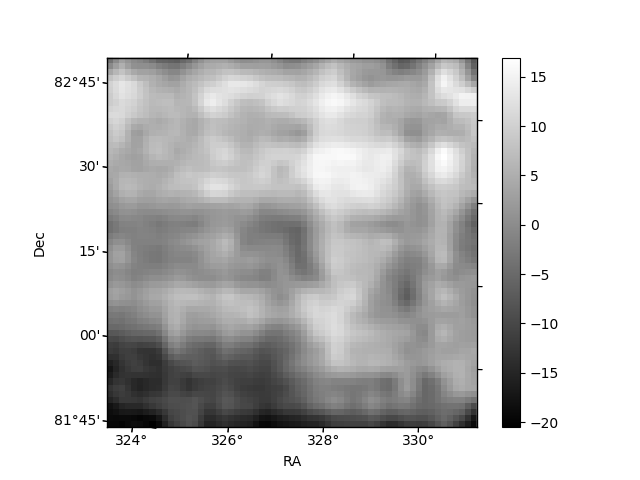
Histogram calculated using DETX and DETY for each event in the final _common_clean file
| Quadrant A | 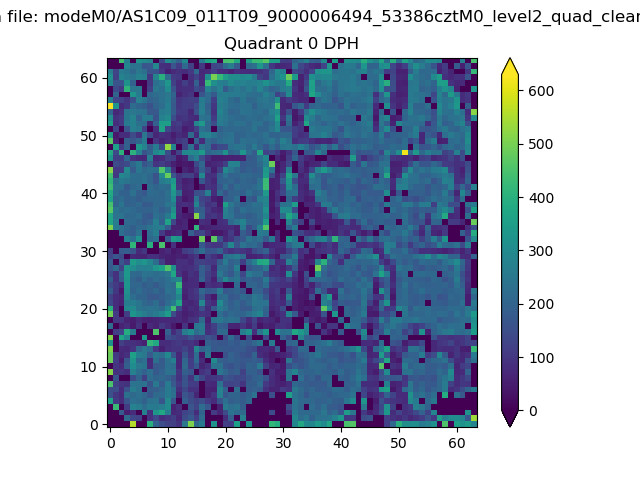 |
 |
Quadrant B |
|---|---|---|---|
| Quadrant D | 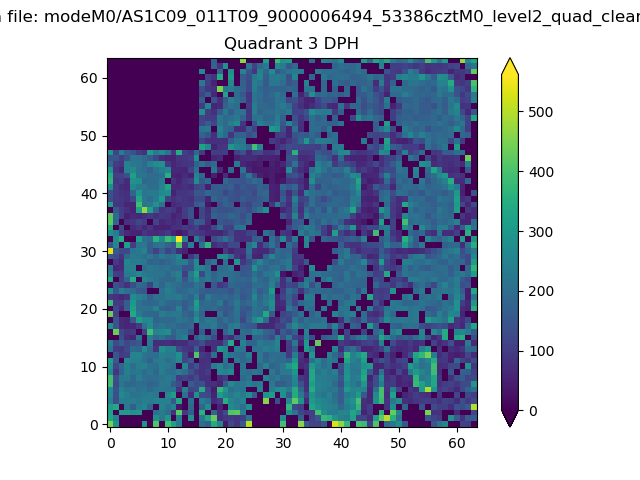 |
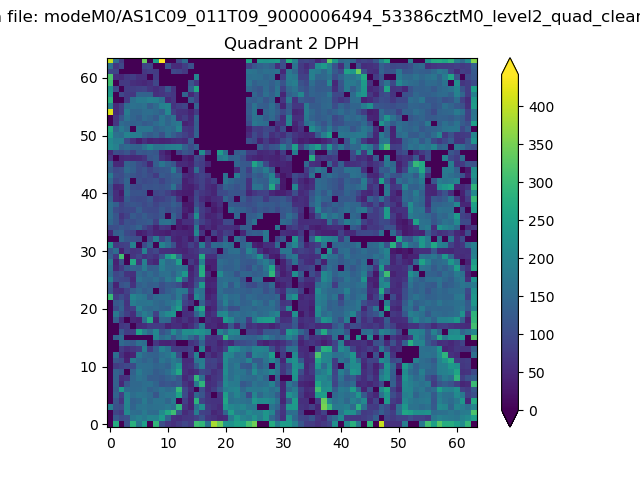 |
Quadrant C |
| Plot type | Count rate plots | Images |
|---|---|---|
| Comparison with Poisson distribution Blue bars denote a histogram of data divided into 1 sec bins. Red curve is a Poisson curve with rate = median count rate of data. |
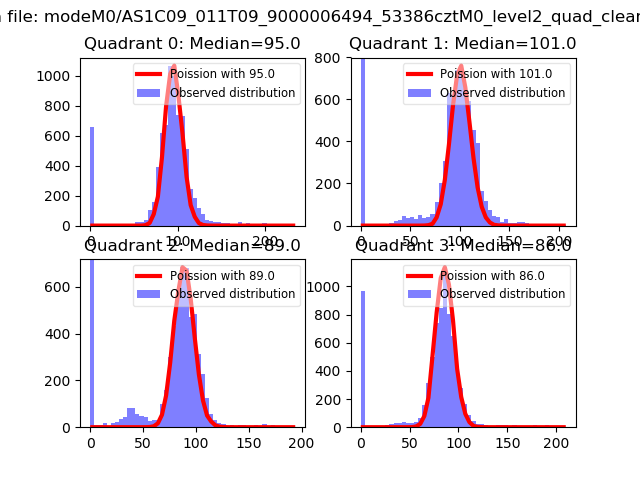 |
 |
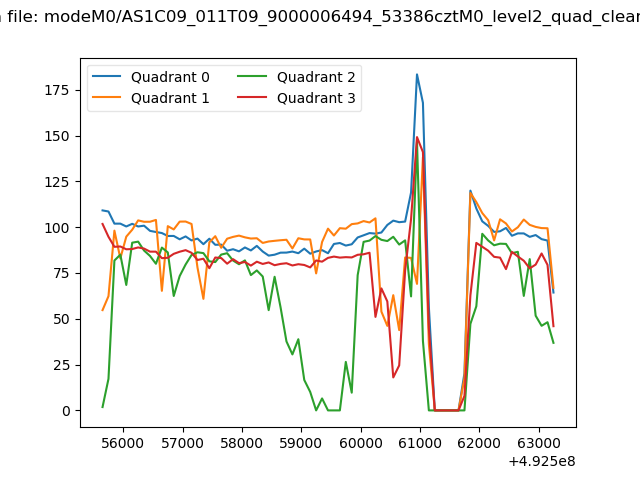
| Quadrant-wise count rates Data is divided into 100 sec bins |
 |
|
| Module-wise count rates for Quadrant A Data is divided into 100 sec bins |
 |
 |
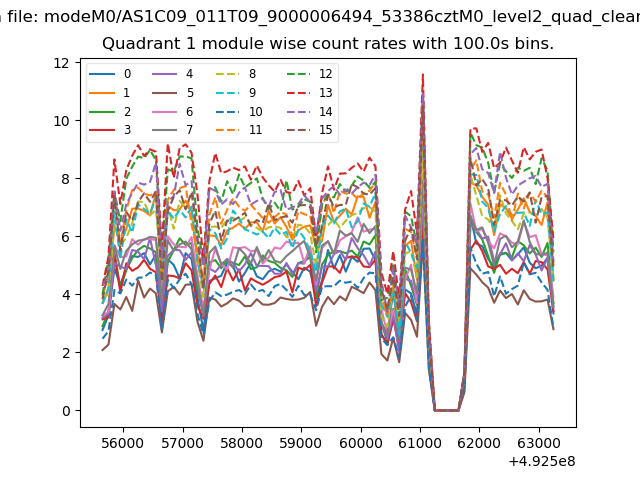
| Module-wise count rates for Quadrant B Data is divided into 100 sec bins |
 |
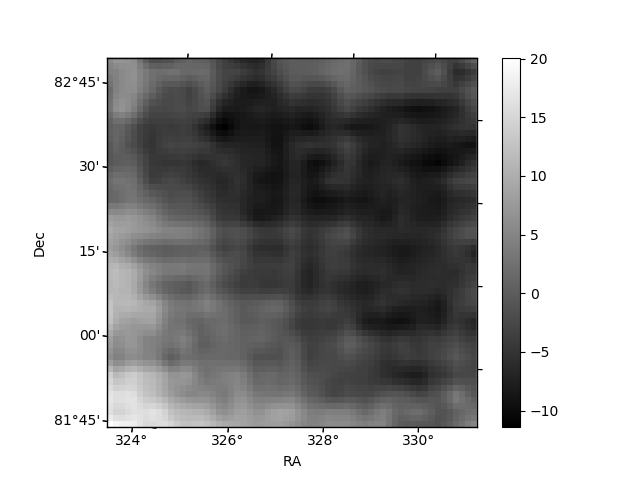 |
| Module-wise count rates for Quadrant C Data is divided into 100 sec bins |
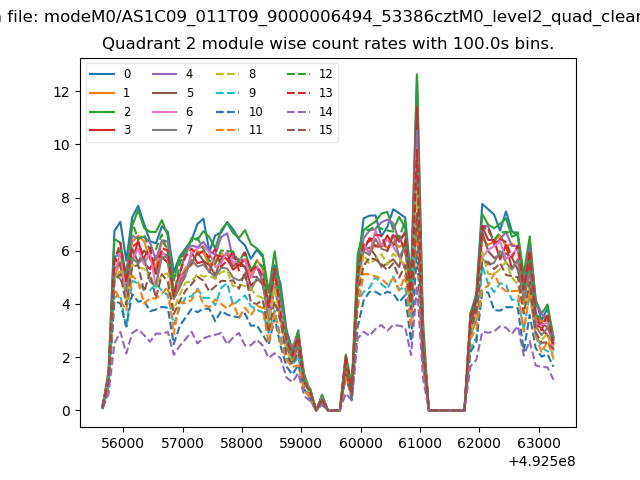 |
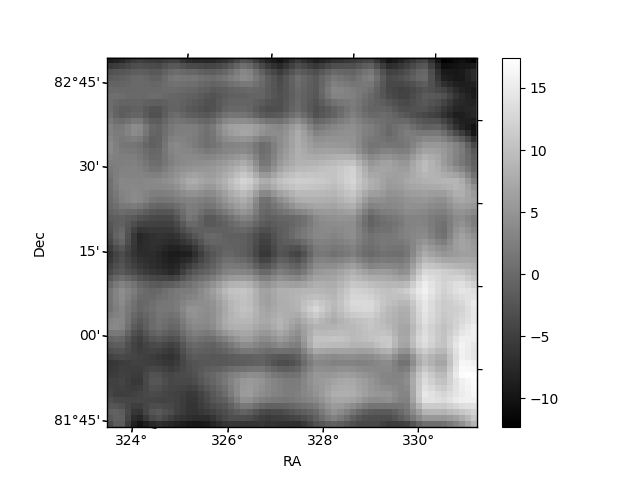 |
| Module-wise count rates for Quadrant D Data is divided into 100 sec bins |
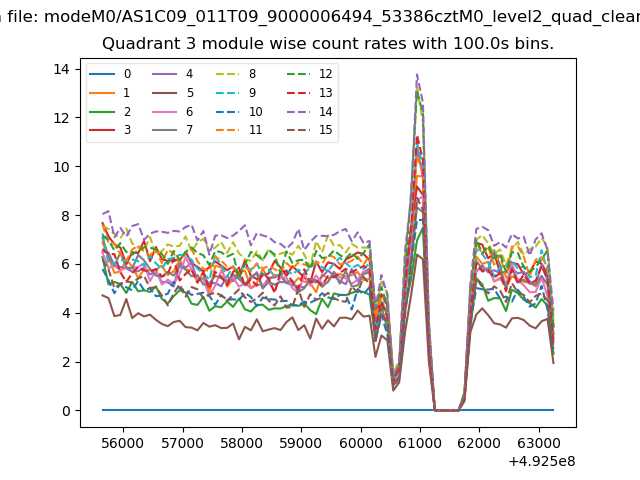 |
 |
| Parameter | Plot |
|---|---|
| CZT HV Monitor | 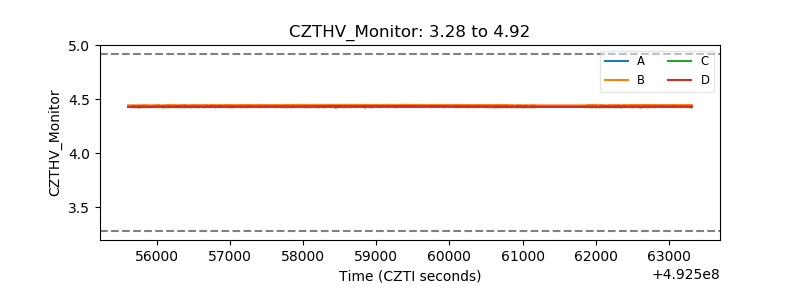 |
| D_VDD | 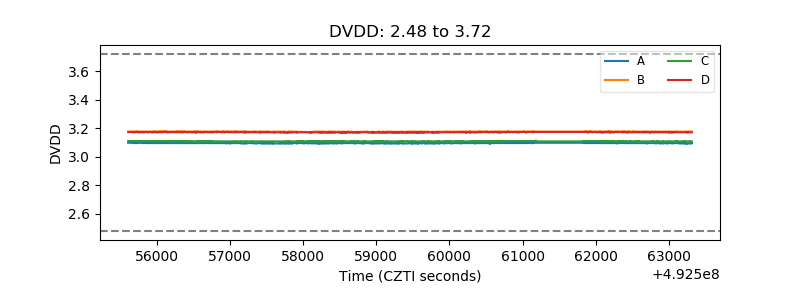 |
| Temperature 1 | 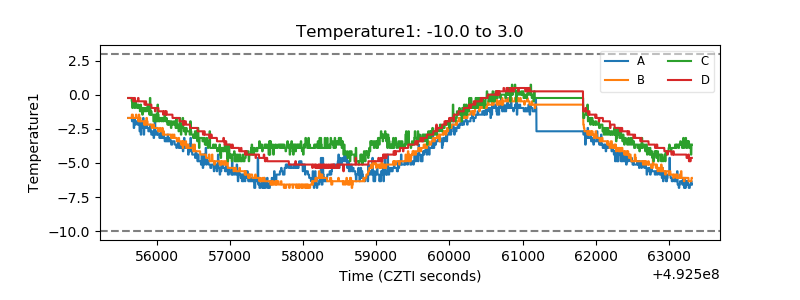 |
| Veto HV Monitor |  |
| Veto LLD | 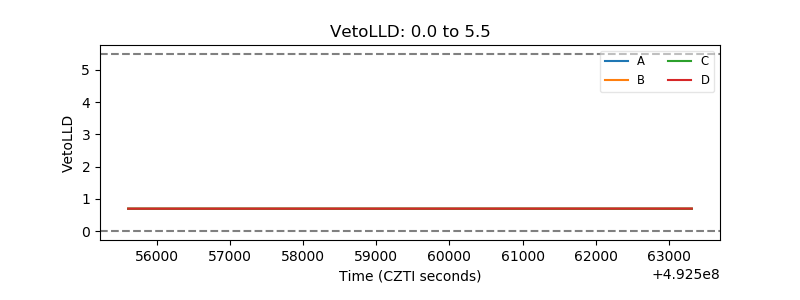 |
| Alpha Counter | 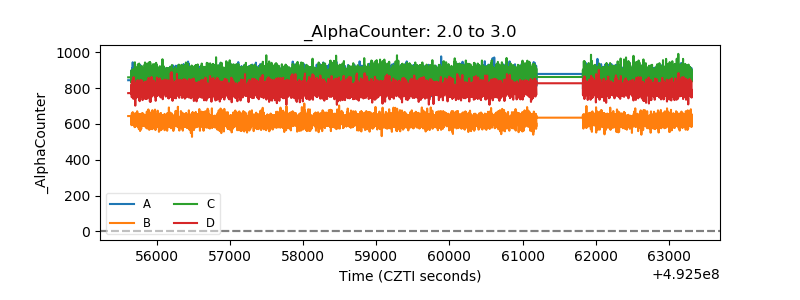 |
| _CPM_Rate | 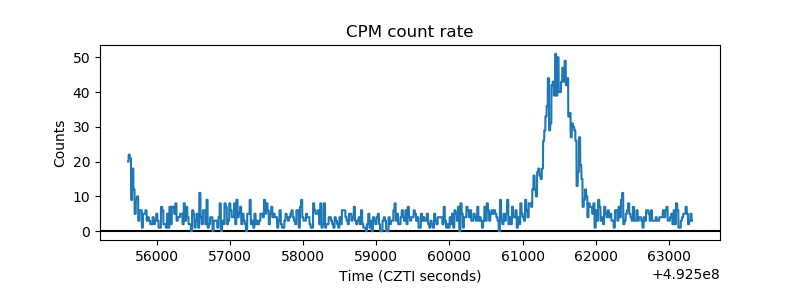 |
| CZT Counter | 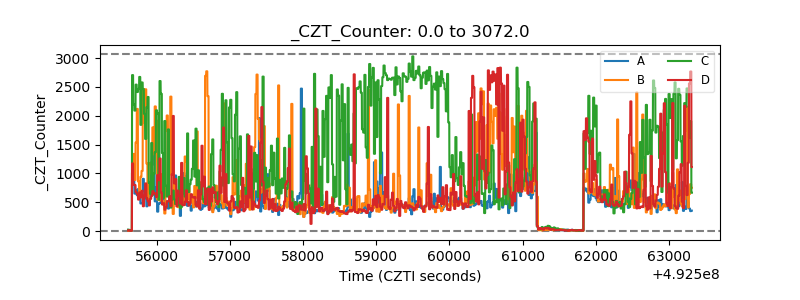 |
| +2.5 Volts monitor |  |
| +5 Volts monitor |  |
| _ROLL_ROT | 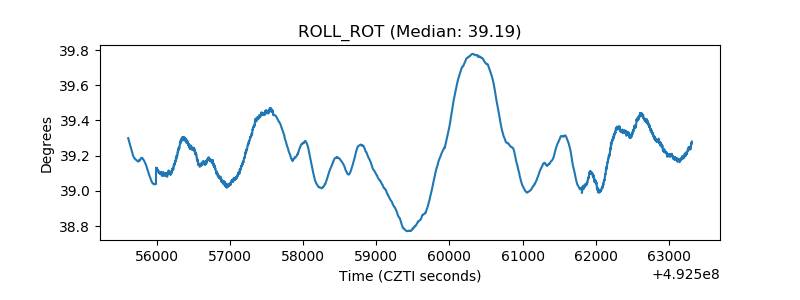 |
| _Roll_DEC | 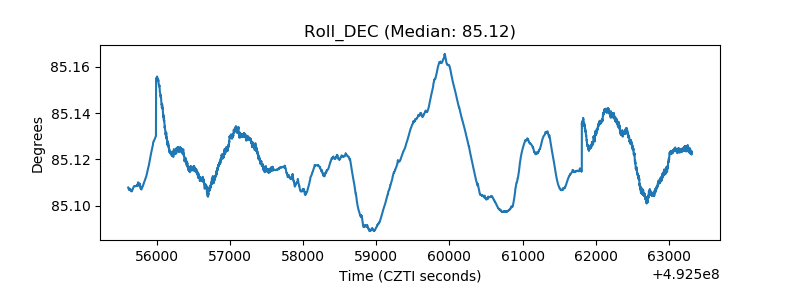 |
| _Roll_RA | 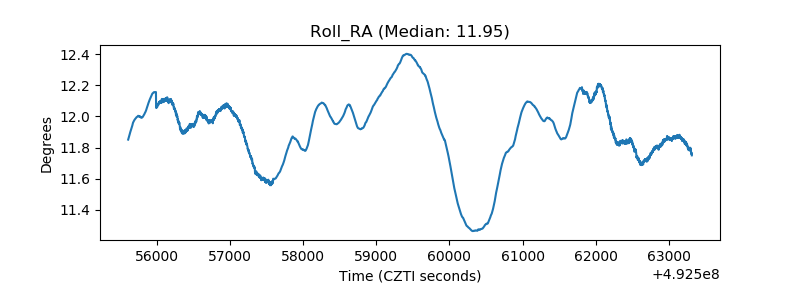 |
| Veto Counter | 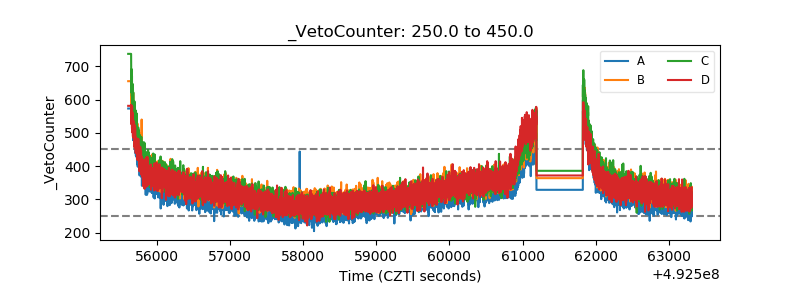 |