| Param | Original file | Final file |
|---|---|---|
| Filename | modeM0/AS1C09_011T09_9000006494_53387cztM0_level2.fits | modeM0/AS1C09_011T09_9000006494_53387cztM0_level2_quad_clean.evt |
| Size (bytes) | 877,129,920 | 99,734,400 |
| Size | 836.5 MB | 95.1 MB |
| Events in quadrant A | 4,593,904 | 758,842 |
| Events in quadrant B | 6,699,647 | 713,905 |
| Events in quadrant C | 15,572,467 | 318,154 |
| Events in quadrant D | 4,986,191 | 676,390 |
| Mode SS | |||
|---|---|---|---|
| Quadrant | BADHDUFLAG | Total packets | Discarded packets |
| A | 0 | 160 | 0 |
| B | 0 | 160 | 0 |
| C | 0 | 160 | 0 |
| D | 0 | 160 | 0 |
| Mode M0 | |||
|---|---|---|---|
| Quadrant | BADHDUFLAG | Total packets | Discarded packets |
| A | 0 | 19472 | 2 |
| B | 0 | 25684 | 2 |
| C | 0 | 51696 | 2 |
| D | 0 | 20760 | 3 |
| Mode M9 | |||
|---|---|---|---|
| Quadrant | BADHDUFLAG | Total packets | Discarded packets |
| A | 0 | 8 | 0 |
| B | 0 | 8 | 0 |
| C | 0 | 8 | 0 |
| D | 0 | 8 | 0 |
| Quadrant | Total seconds | Saturated seconds | Saturation percentage |
|---|---|---|---|
| A | 7951 | 159 | 1.999748% |
| B | 7951 | 1156 | 14.539052% |
| C | 7951 | 4837 | 60.835115% |
| D | 7950 | 312 | 3.924528% |
Noise dominated data is calculated using 1-second bins in cleaned event files. If a bin has >2000 counts, and if more than 50% of those come from <1% of pixels, then it is considered to be noise-dominated and hence unusable.
| Quadrant | # 1 sec bins | Bins with >0 counts | Bins with >2000 counts | High rate bins dominated by noise | Noise dominated (total time) | Noise dominated (detector-on time) | Marked lightcurve |
|---|---|---|---|---|---|---|---|
| A | 8646 | 7953 | 72 | 72 | 0.83% | 0.91% | 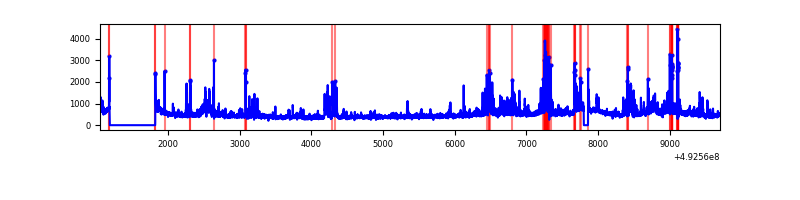 |
| B | 8646 | 7953 | 628 | 628 | 7.26% | 7.90% | 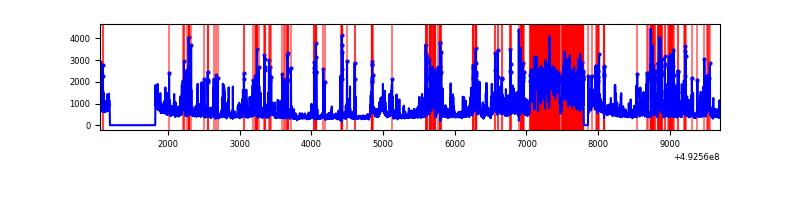 |
| C | 8646 | 7951 | 4355 | 4355 | 50.37% | 54.77% | 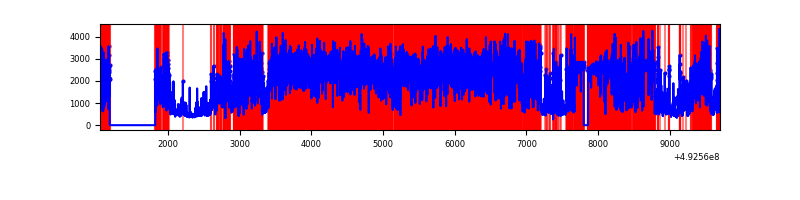 |
| D | 8645 | 7952 | 219 | 219 | 2.53% | 2.75% | 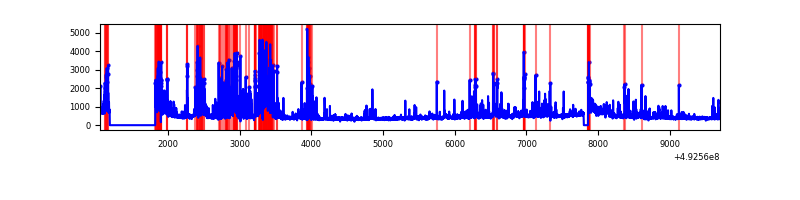 |
Top three noisy pixels from each quadrant. If the there are fewer than three noisy pixels in the level2.evt file, extra rows are filled as -1
| Pixel properties | Quadrant properties | ||||||
|---|---|---|---|---|---|---|---|
| Quadrant | DetID | PixID | Counts | Sigma | Mean | Median | Sigma |
| A | 15 | 174 | 299610 | 1415.96 | 845 | 823 | 211.0 |
| A | 8 | 247 | 213855 | 1009.57 | 845 | 823 | 211.0 |
| A | 14 | 254 | 184067 | 868.4 | 845 | 823 | 211.0 |
| B | 4 | 206 | 1898870 | 11144.14 | 804 | 773 | 170.3 |
| B | 4 | 171 | 582401 | 3414.87 | 804 | 773 | 170.3 |
| B | 8 | 234 | 227543 | 1331.42 | 804 | 773 | 170.3 |
| C | 15 | 178 | 8440948 | 50340.03 | 603 | 595 | 167.7 |
| C | 1 | 241 | 2238269 | 13345.95 | 603 | 595 | 167.7 |
| C | 15 | 224 | 1746088 | 10410.48 | 603 | 595 | 167.7 |
| D | 2 | 249 | 564599 | 2438.9 | 818 | 783 | 231.2 |
| D | 3 | 12 | 528258 | 2281.7 | 818 | 783 | 231.2 |
| D | 2 | 153 | 268651 | 1158.72 | 818 | 783 | 231.2 |
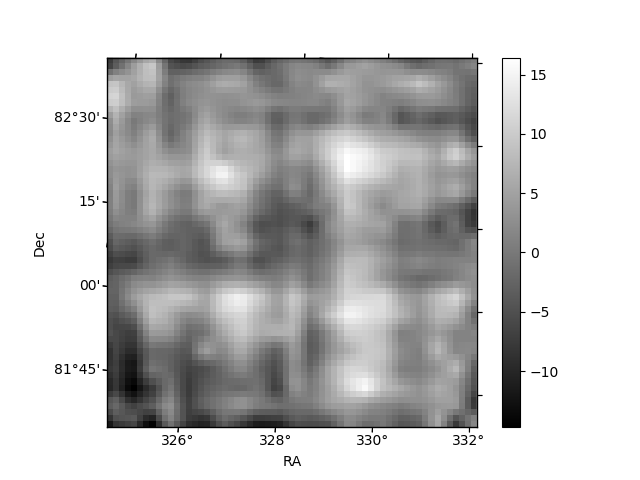
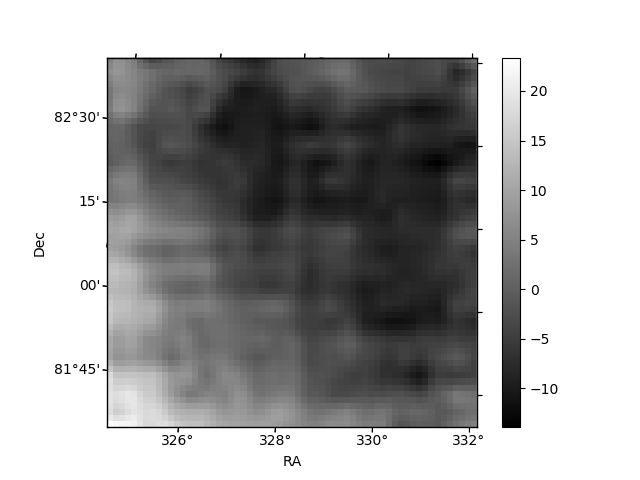
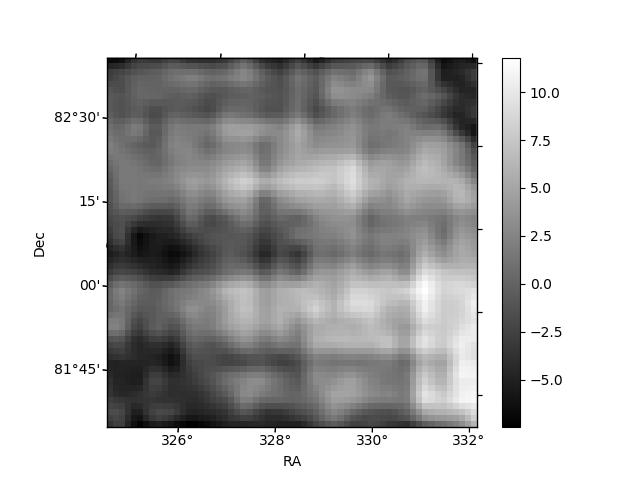
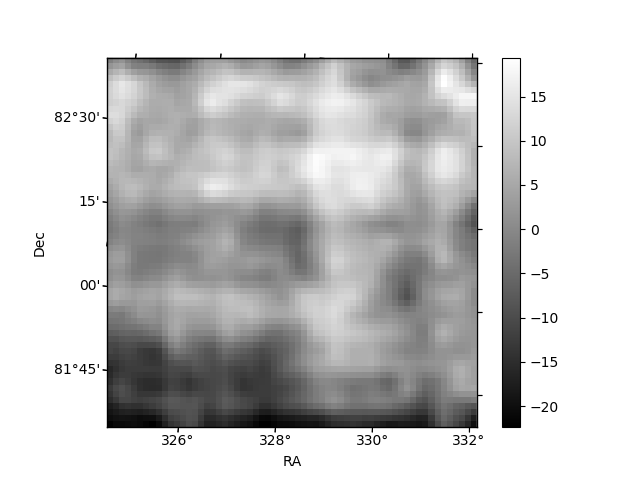
Histogram calculated using DETX and DETY for each event in the final _common_clean file
| Quadrant A | 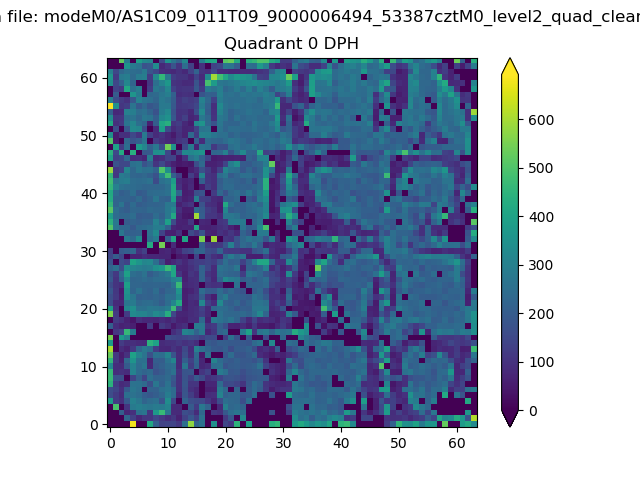 |
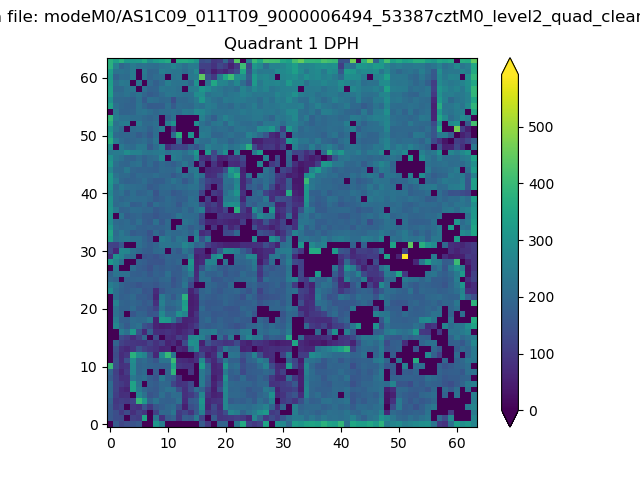 |
Quadrant B |
|---|---|---|---|
| Quadrant D | 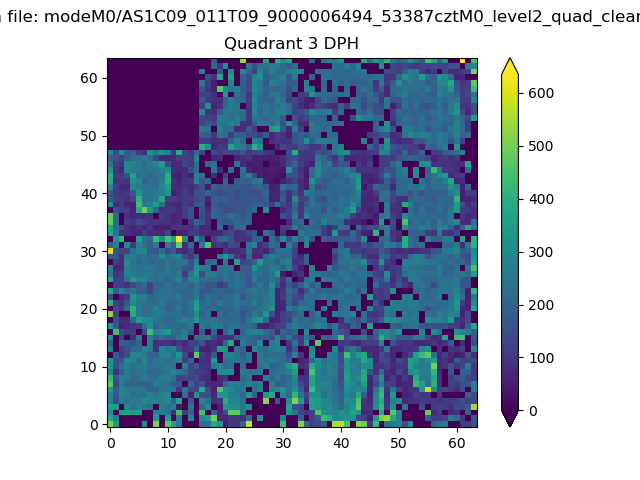 |
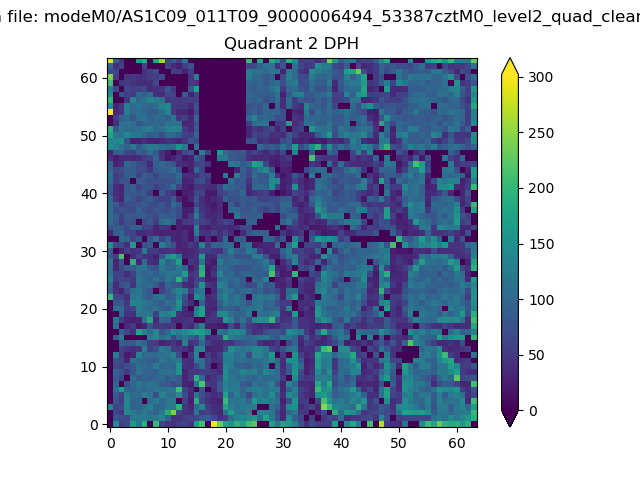 |
Quadrant C |
| Plot type | Count rate plots | Images |
|---|---|---|
| Comparison with Poisson distribution Blue bars denote a histogram of data divided into 1 sec bins. Red curve is a Poisson curve with rate = median count rate of data. |
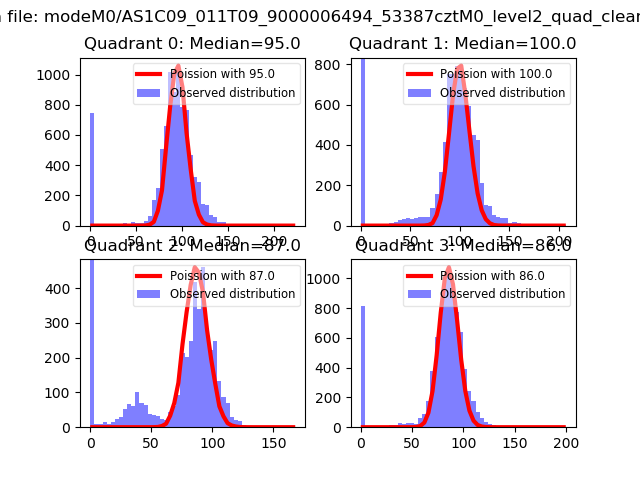 |
 |
| Quadrant-wise count rates Data is divided into 100 sec bins |
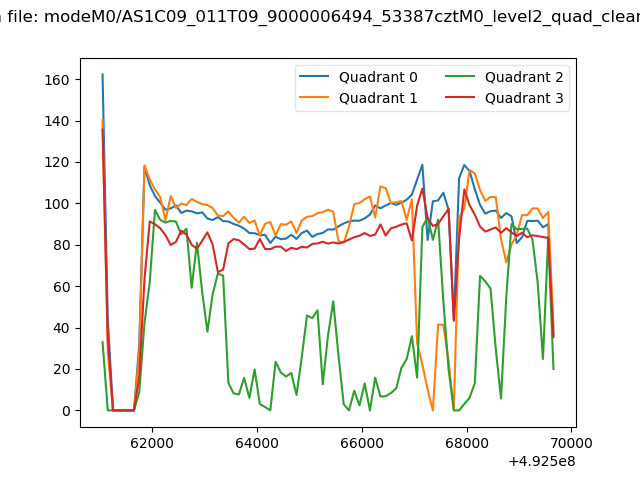 |
|
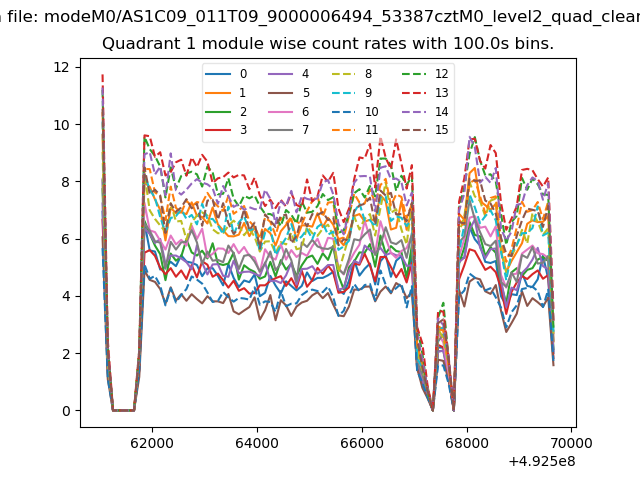
| Module-wise count rates for Quadrant A Data is divided into 100 sec bins |
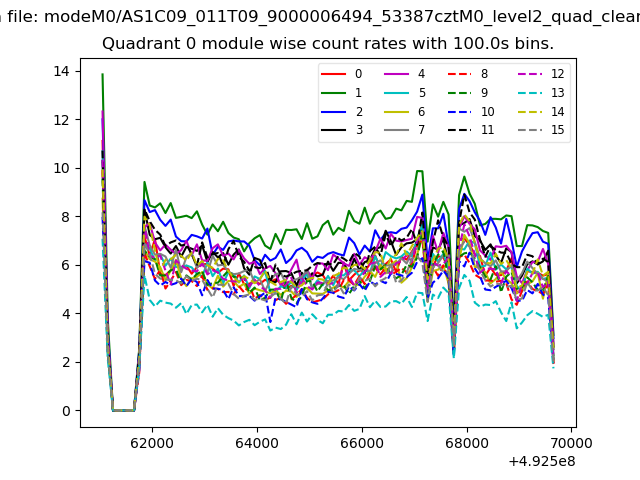 |
 |
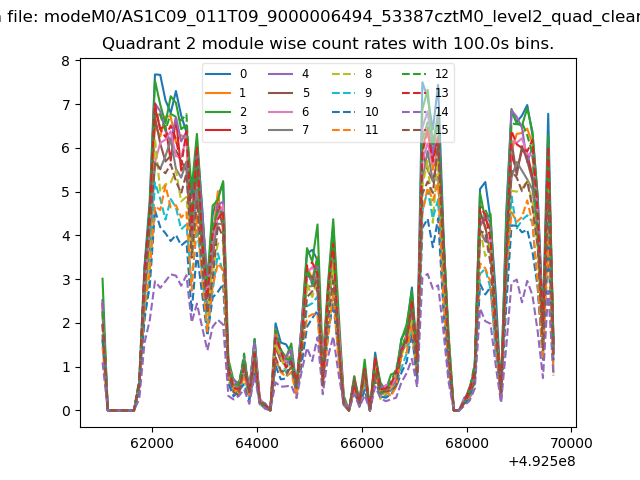
| Module-wise count rates for Quadrant B Data is divided into 100 sec bins |
 |
 |
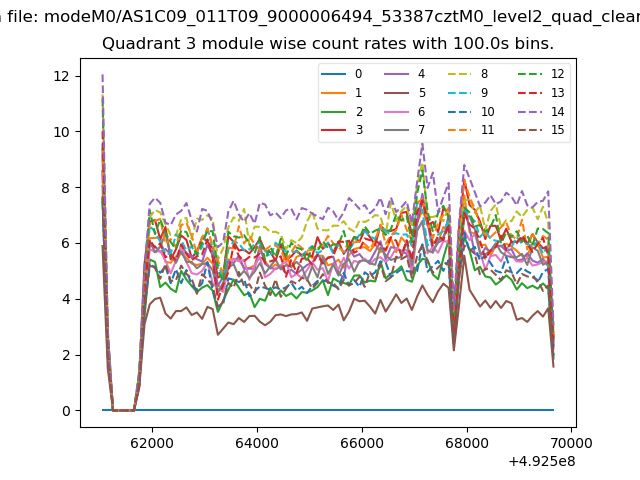
| Module-wise count rates for Quadrant C Data is divided into 100 sec bins |
 |
 |
| Module-wise count rates for Quadrant D Data is divided into 100 sec bins |
 |
 |
| Parameter | Plot |
|---|---|
| CZT HV Monitor | 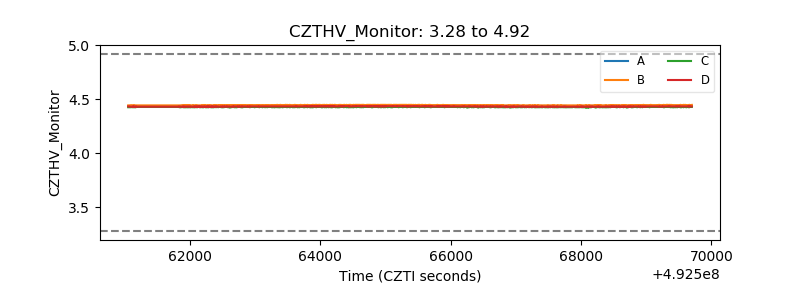 |
| D_VDD | 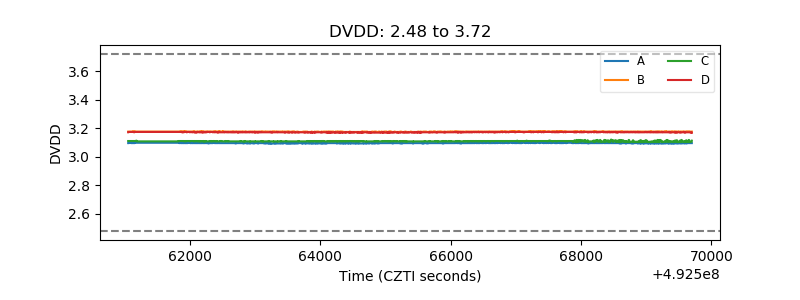 |
| Temperature 1 | 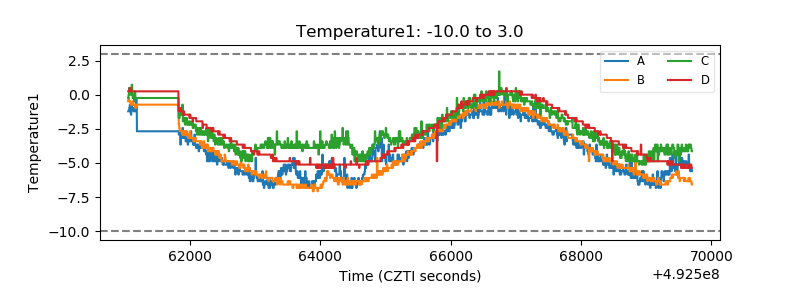 |
| Veto HV Monitor |  |
| Veto LLD | 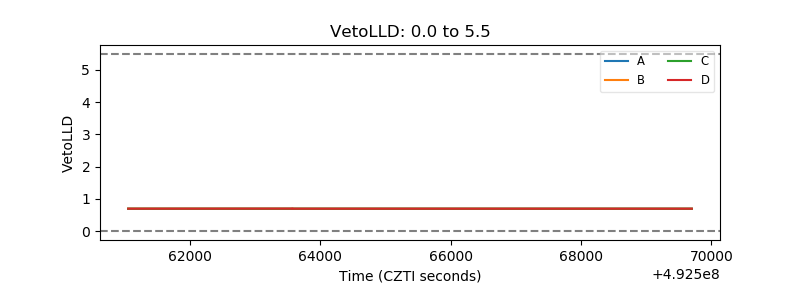 |
| Alpha Counter |  |
| _CPM_Rate | 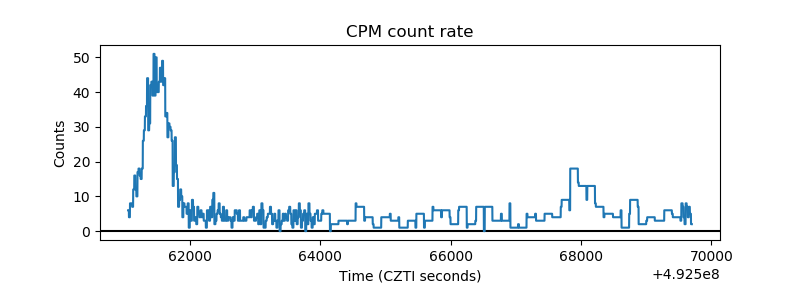 |
| CZT Counter | 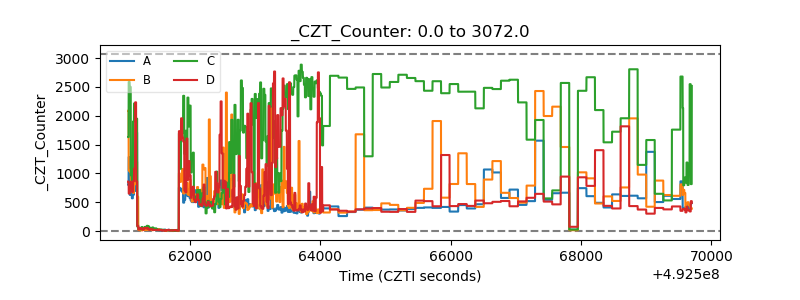 |
| +2.5 Volts monitor | 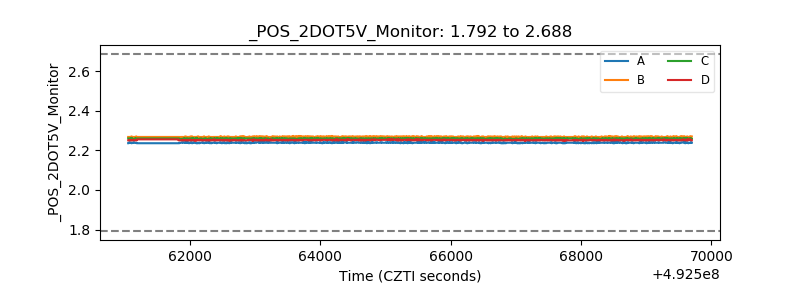 |
| +5 Volts monitor | 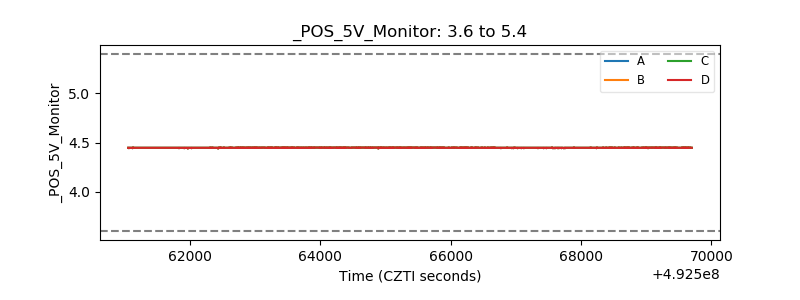 |
| _ROLL_ROT | 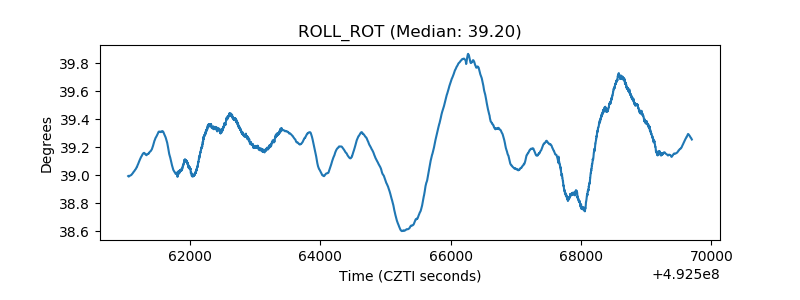 |
| _Roll_DEC | 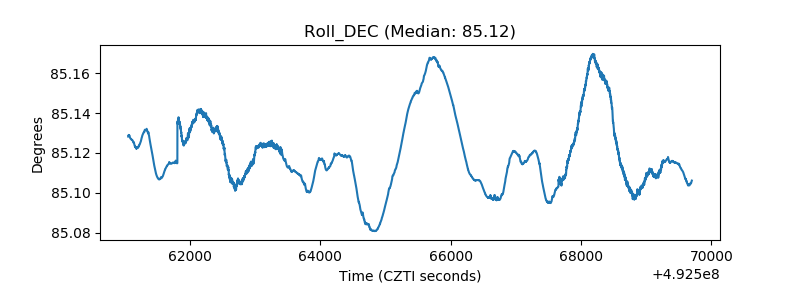 |
| _Roll_RA | 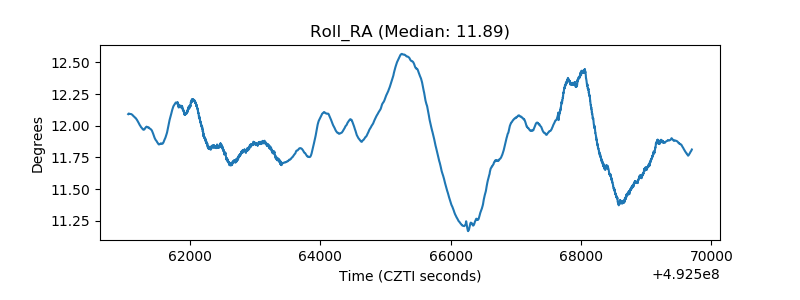 |
| Veto Counter | 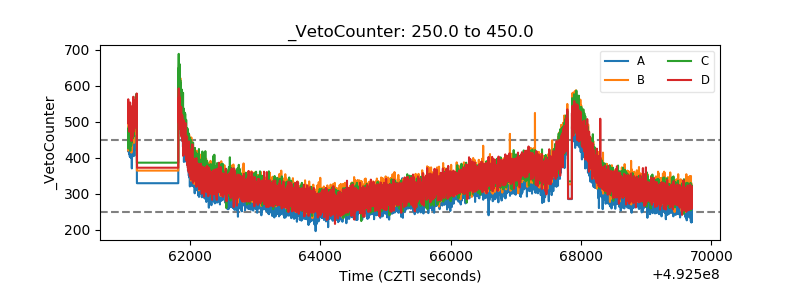 |