| Param | Original file | Final file |
|---|---|---|
| Filename | modeM0/AS1C09_011T09_9000006494_53388cztM0_level2.fits | modeM0/AS1C09_011T09_9000006494_53388cztM0_level2_quad_clean.evt |
| Size (bytes) | 1,046,364,480 | 107,040,960 |
| Size | 997.9 MB | 102.1 MB |
| Events in quadrant A | 5,802,275 | 812,452 |
| Events in quadrant B | 8,911,809 | 746,921 |
| Events in quadrant C | 17,674,668 | 328,417 |
| Events in quadrant D | 5,664,498 | 742,529 |
| Mode SS | |||
|---|---|---|---|
| Quadrant | BADHDUFLAG | Total packets | Discarded packets |
| A | 0 | 178 | 0 |
| B | 0 | 178 | 0 |
| C | 0 | 178 | 0 |
| D | 0 | 178 | 0 |
| Mode M0 | |||
|---|---|---|---|
| Quadrant | BADHDUFLAG | Total packets | Discarded packets |
| A | 0 | 23315 | 1 |
| B | 0 | 32668 | 1 |
| C | 0 | 58402 | 5 |
| D | 0 | 23230 | 1 |
| Mode M9 | |||
|---|---|---|---|
| Quadrant | BADHDUFLAG | Total packets | Discarded packets |
| A | 0 | 1 | 0 |
| B | 0 | 1 | 0 |
| C | 0 | 1 | 0 |
| D | 0 | 1 | 0 |
| Quadrant | Total seconds | Saturated seconds | Saturation percentage |
|---|---|---|---|
| A | 8789 | 335 | 3.811583% |
| B | 8789 | 1729 | 19.672318% |
| C | 8788 | 5365 | 61.049158% |
| D | 8788 | 258 | 2.935822% |
Noise dominated data is calculated using 1-second bins in cleaned event files. If a bin has >2000 counts, and if more than 50% of those come from <1% of pixels, then it is considered to be noise-dominated and hence unusable.
| Quadrant | # 1 sec bins | Bins with >0 counts | Bins with >2000 counts | High rate bins dominated by noise | Noise dominated (total time) | Noise dominated (detector-on time) | Marked lightcurve |
|---|---|---|---|---|---|---|---|
| A | 8849 | 8790 | 244 | 244 | 2.76% | 2.78% | 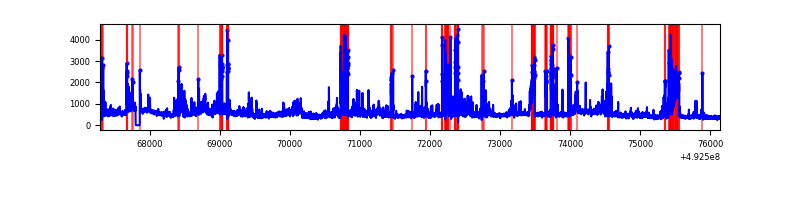 |
| B | 8849 | 8790 | 1033 | 1033 | 11.67% | 11.75% | 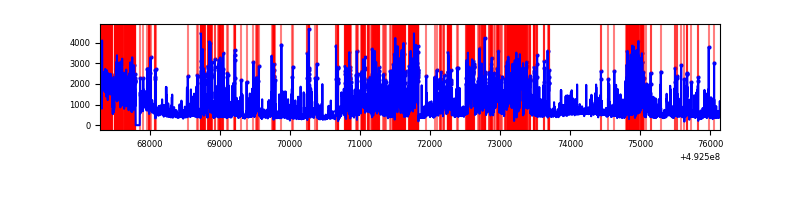 |
| C | 8847 | 8787 | 5088 | 5088 | 57.51% | 57.90% | 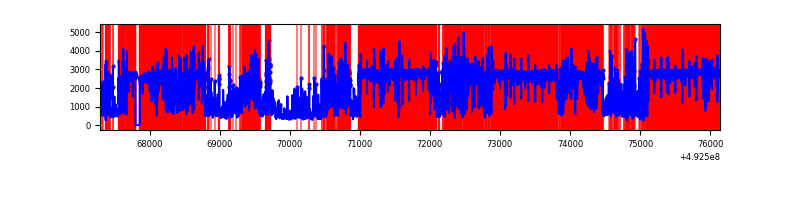 |
| D | 8848 | 8789 | 228 | 228 | 2.58% | 2.59% | 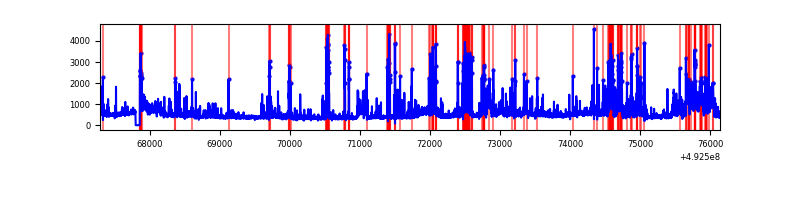 |
Top three noisy pixels from each quadrant. If the there are fewer than three noisy pixels in the level2.evt file, extra rows are filled as -1
| Pixel properties | Quadrant properties | ||||||
|---|---|---|---|---|---|---|---|
| Quadrant | DetID | PixID | Counts | Sigma | Mean | Median | Sigma |
| A | 15 | 174 | 703901 | 3090.6 | 922 | 902 | 227.5 |
| A | 0 | 8 | 467359 | 2050.69 | 922 | 902 | 227.5 |
| A | 14 | 235 | 361361 | 1584.69 | 922 | 902 | 227.5 |
| B | 4 | 206 | 3005921 | 16407.52 | 862 | 832 | 183.2 |
| B | 4 | 171 | 799266 | 4359.38 | 862 | 832 | 183.2 |
| B | 2 | 249 | 517839 | 2822.81 | 862 | 832 | 183.2 |
| C | 1 | 241 | 12472350 | 83499.78 | 546 | 542 | 149.4 |
| C | 15 | 224 | 1461157 | 9778.94 | 546 | 542 | 149.4 |
| C | 15 | 178 | 1131172 | 7569.66 | 546 | 542 | 149.4 |
| D | 2 | 249 | 614969 | 2386.28 | 905 | 865 | 257.3 |
| D | 3 | 12 | 550859 | 2137.16 | 905 | 865 | 257.3 |
| D | 0 | 18 | 259913 | 1006.6 | 905 | 865 | 257.3 |
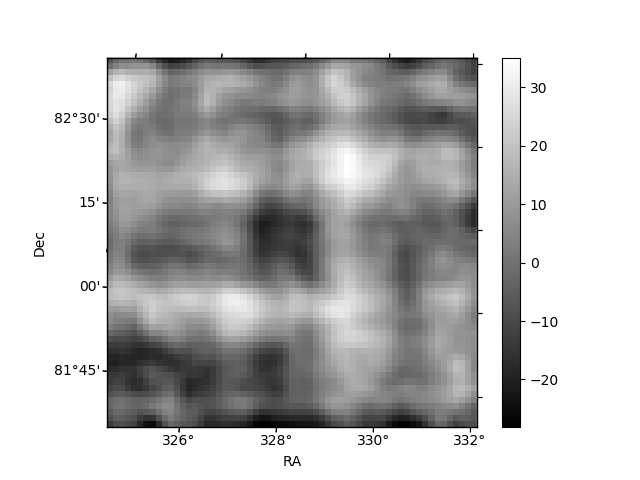
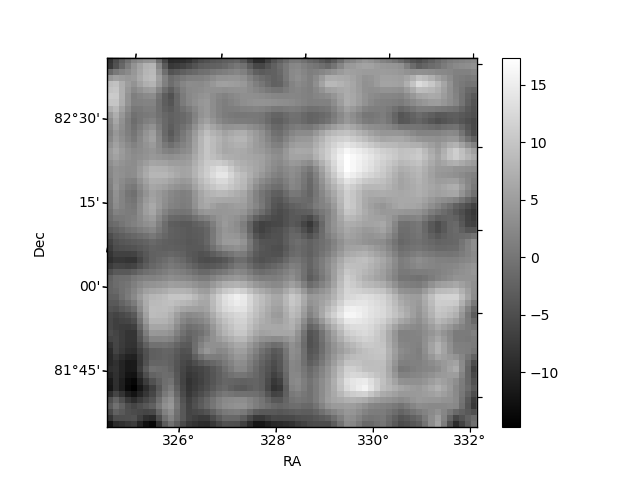
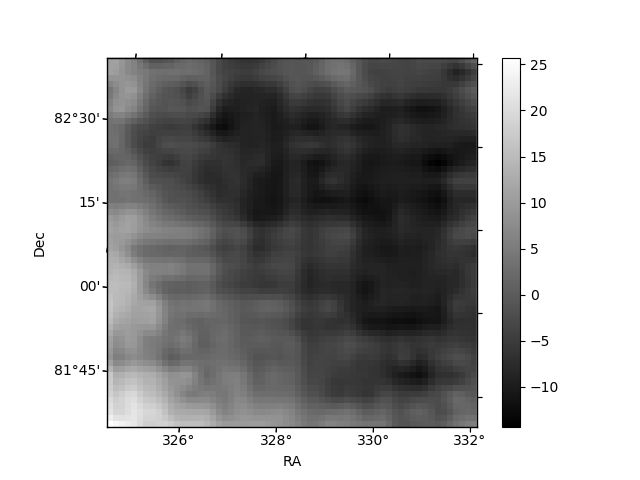
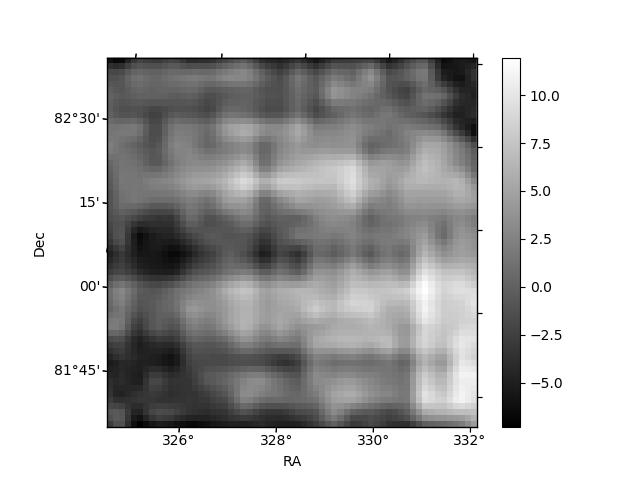
Histogram calculated using DETX and DETY for each event in the final _common_clean file
| Quadrant A | 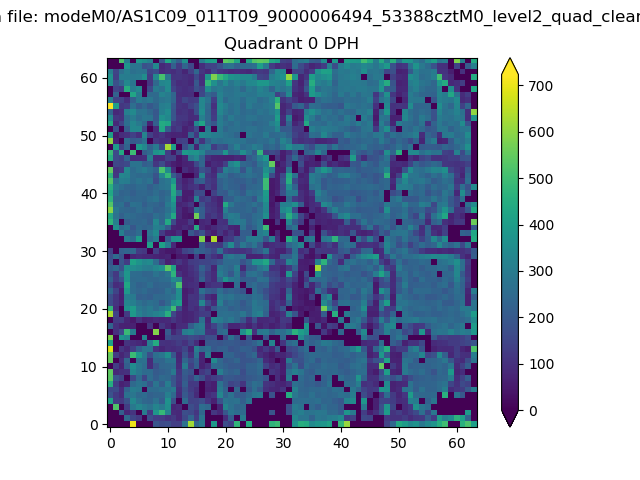 |
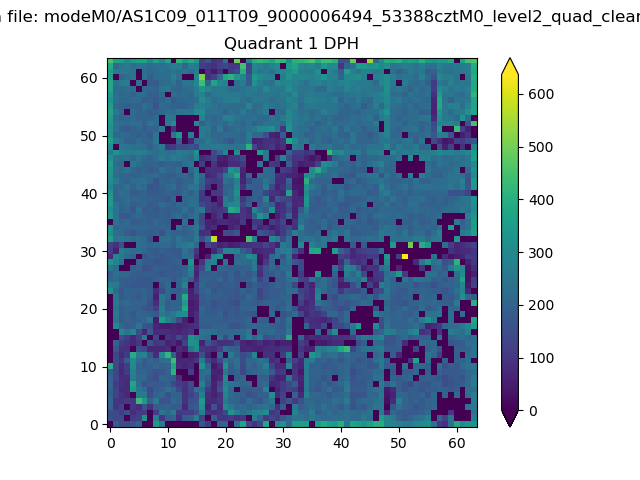 |
Quadrant B |
|---|---|---|---|
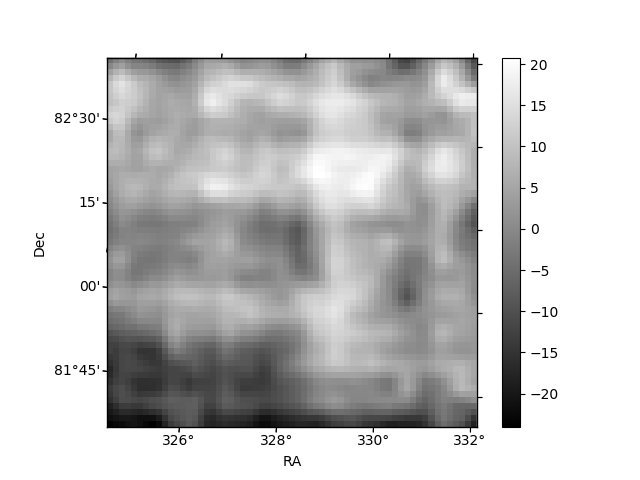
| Quadrant D | 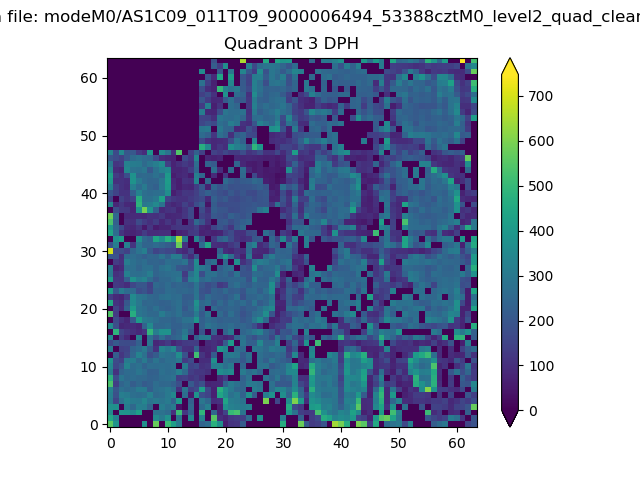 |
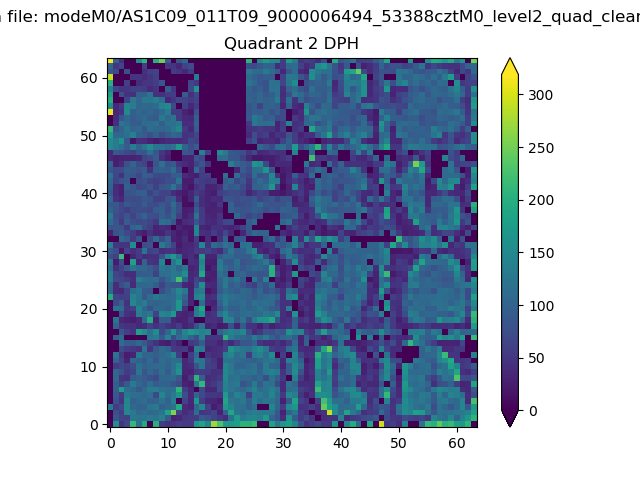 |
Quadrant C |
| Plot type | Count rate plots | Images |
|---|---|---|
| Comparison with Poisson distribution Blue bars denote a histogram of data divided into 1 sec bins. Red curve is a Poisson curve with rate = median count rate of data. |
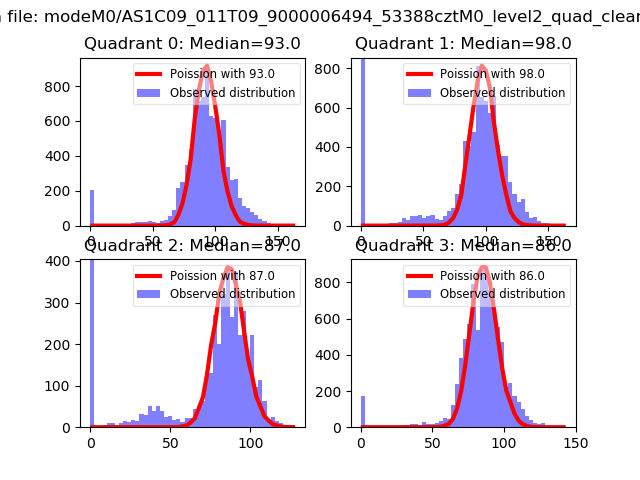 |
 |
| Quadrant-wise count rates Data is divided into 100 sec bins |
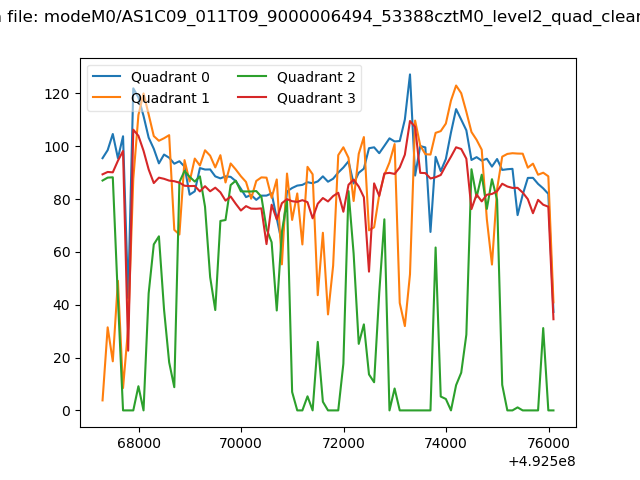 |
|
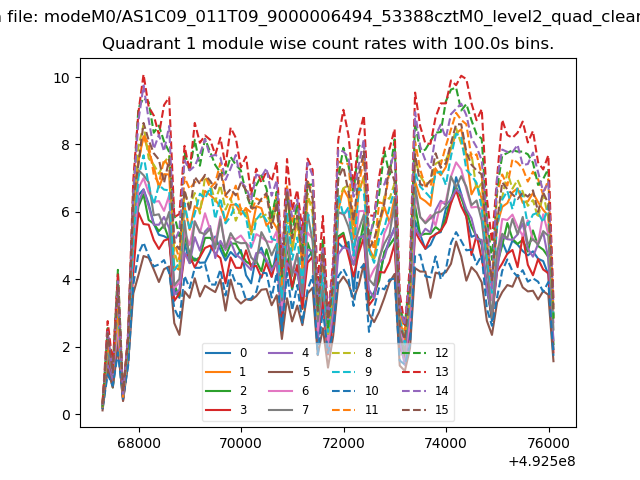
| Module-wise count rates for Quadrant A Data is divided into 100 sec bins |
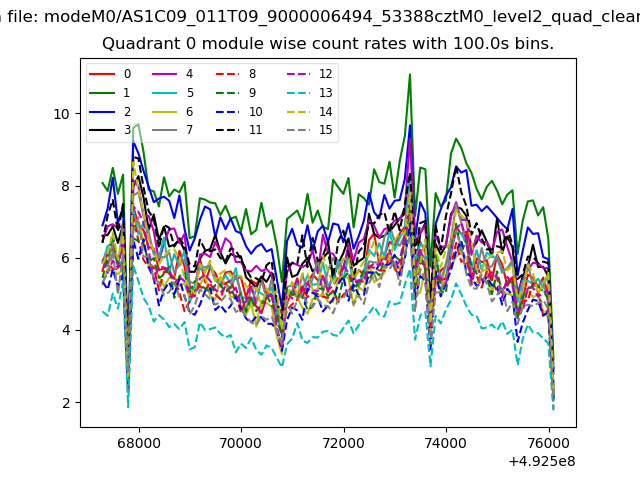 |
 |
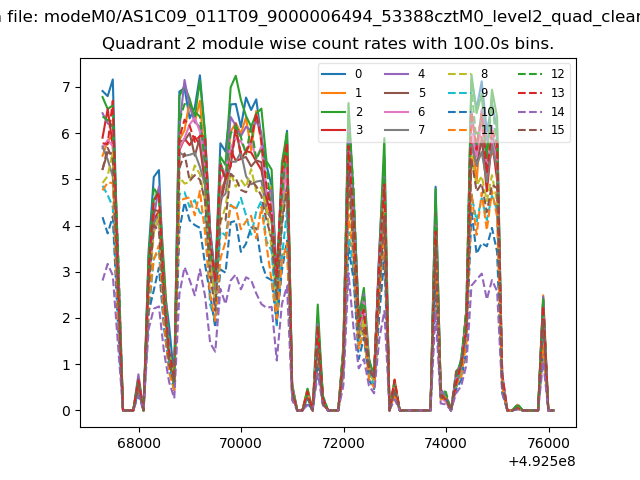
| Module-wise count rates for Quadrant B Data is divided into 100 sec bins |
 |
 |
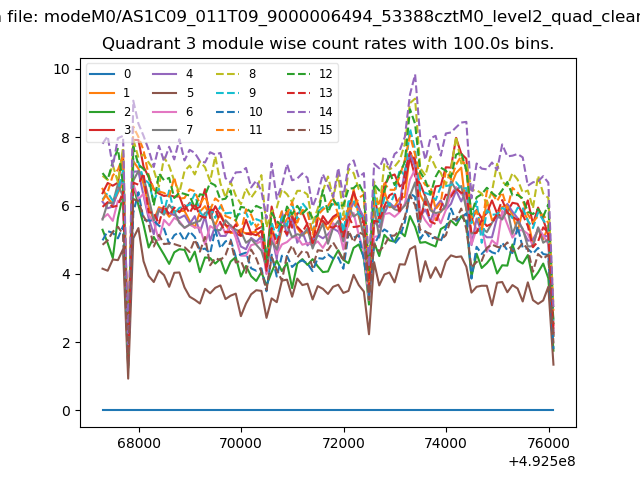
| Module-wise count rates for Quadrant C Data is divided into 100 sec bins |
 |
 |
| Module-wise count rates for Quadrant D Data is divided into 100 sec bins |
 |
 |
| Parameter | Plot |
|---|---|
| CZT HV Monitor | 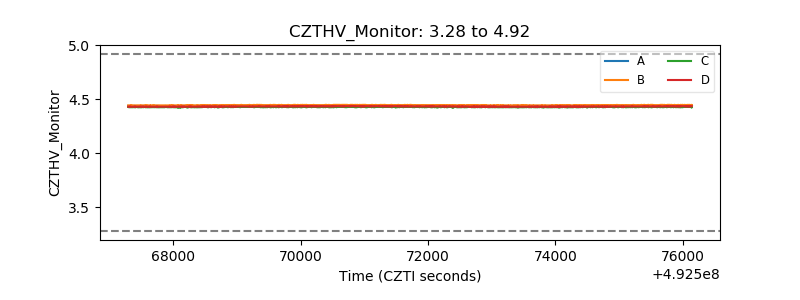 |
| D_VDD | 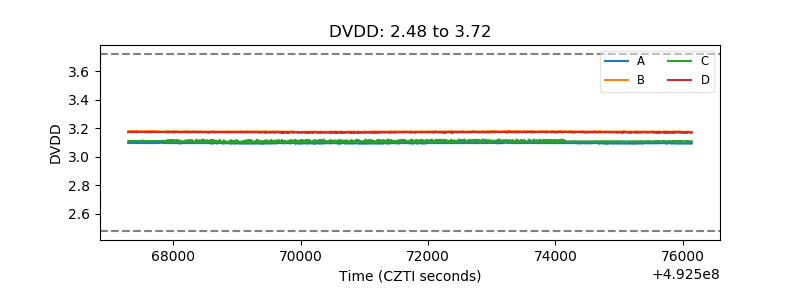 |
| Temperature 1 | 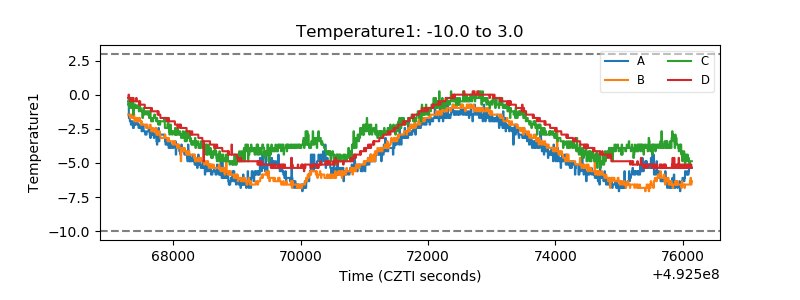 |
| Veto HV Monitor | 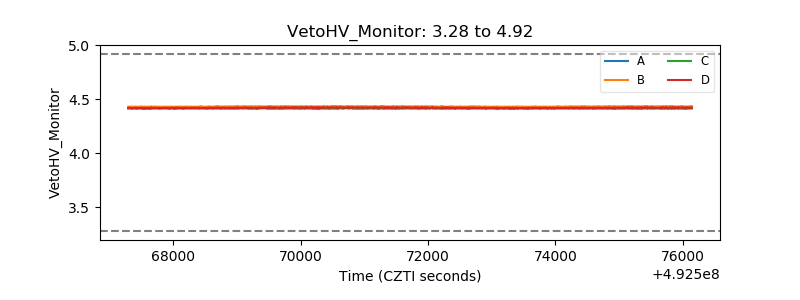 |
| Veto LLD | 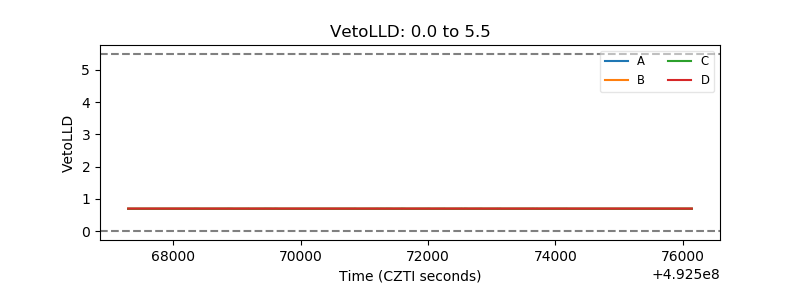 |
| Alpha Counter | 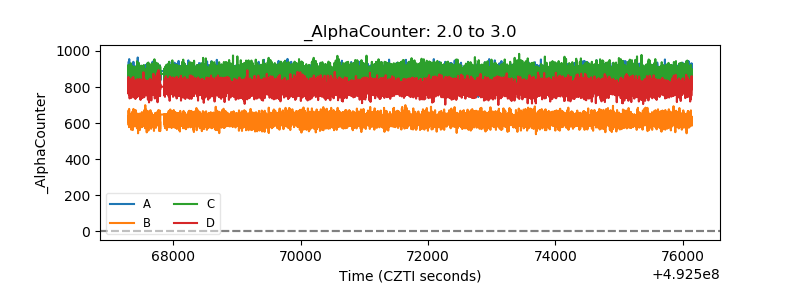 |
| _CPM_Rate | 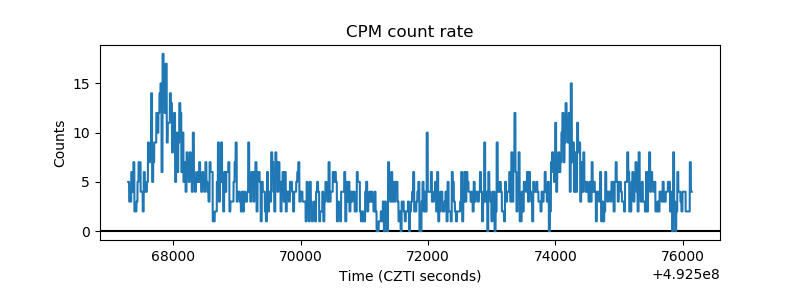 |
| CZT Counter | 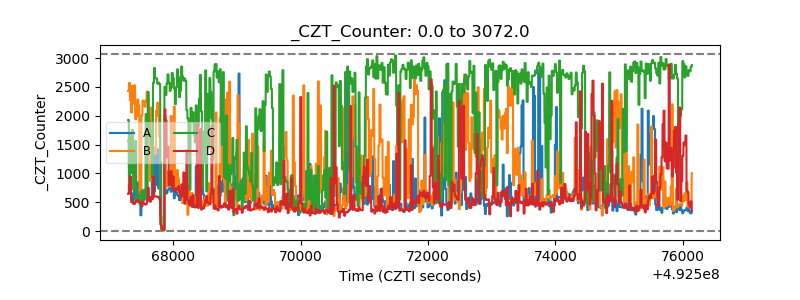 |
| +2.5 Volts monitor |  |
| +5 Volts monitor | 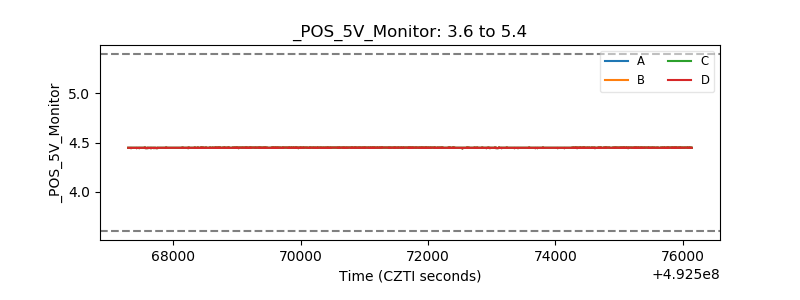 |
| _ROLL_ROT | 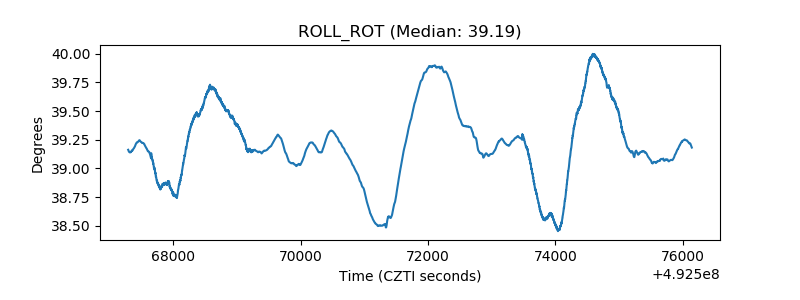 |
| _Roll_DEC | 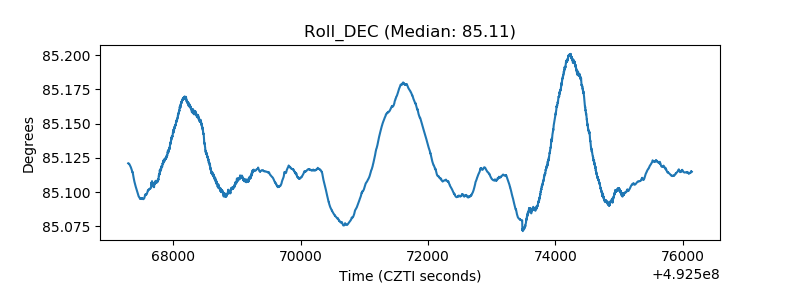 |
| _Roll_RA | 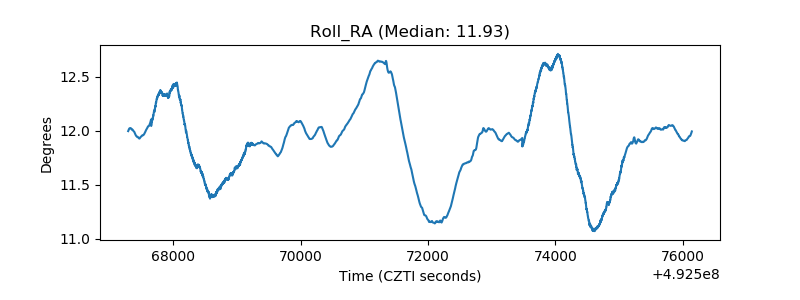 |
| Veto Counter | 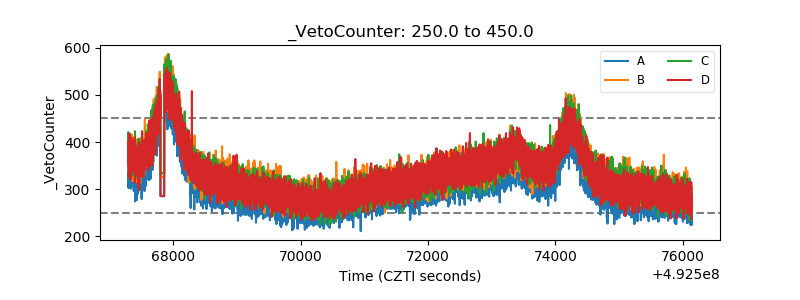 |