| Param | Original file | Final file |
|---|---|---|
| Filename | modeM0/AS1C09_011T09_9000006494_53389cztM0_level2.fits | modeM0/AS1C09_011T09_9000006494_53389cztM0_level2_quad_clean.evt |
| Size (bytes) | 951,716,160 | 94,173,120 |
| Size | 907.6 MB | 89.8 MB |
| Events in quadrant A | 4,490,368 | 707,221 |
| Events in quadrant B | 7,775,744 | 677,796 |
| Events in quadrant C | 16,390,884 | 269,259 |
| Events in quadrant D | 5,970,283 | 655,504 |
| Mode SS | |||
|---|---|---|---|
| Quadrant | BADHDUFLAG | Total packets | Discarded packets |
| A | 0 | 156 | 0 |
| B | 0 | 156 | 0 |
| C | 0 | 156 | 0 |
| D | 0 | 156 | 0 |
| Mode M0 | |||
|---|---|---|---|
| Quadrant | BADHDUFLAG | Total packets | Discarded packets |
| A | 0 | 19263 | 0 |
| B | 0 | 28562 | 0 |
| C | 0 | 53807 | 0 |
| D | 0 | 23268 | 0 |
| Quadrant | Total seconds | Saturated seconds | Saturation percentage |
|---|---|---|---|
| A | 7784 | 285 | 3.661357% |
| B | 7783 | 1384 | 17.782346% |
| C | 7784 | 5021 | 64.504111% |
| D | 7784 | 191 | 2.453751% |
Noise dominated data is calculated using 1-second bins in cleaned event files. If a bin has >2000 counts, and if more than 50% of those come from <1% of pixels, then it is considered to be noise-dominated and hence unusable.
| Quadrant | # 1 sec bins | Bins with >0 counts | Bins with >2000 counts | High rate bins dominated by noise | Noise dominated (total time) | Noise dominated (detector-on time) | Marked lightcurve |
|---|---|---|---|---|---|---|---|
| A | 7784 | 7784 | 202 | 202 | 2.60% | 2.60% | 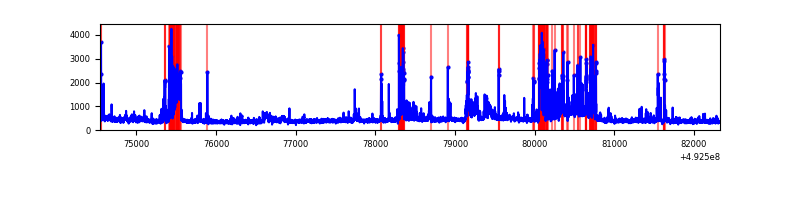 |
| B | 7783 | 7783 | 854 | 854 | 10.97% | 10.97% | 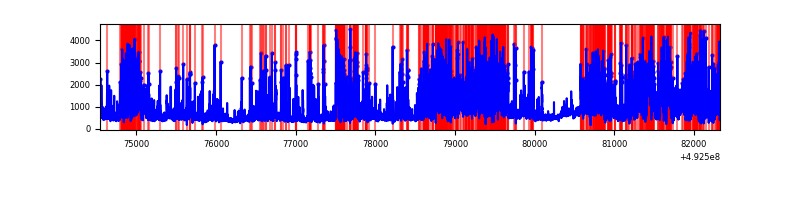 |
| C | 7784 | 7784 | 4805 | 4805 | 61.73% | 61.73% | 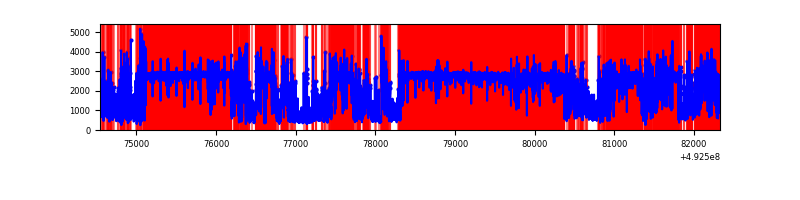 |
| D | 7784 | 7784 | 254 | 254 | 3.26% | 3.26% | 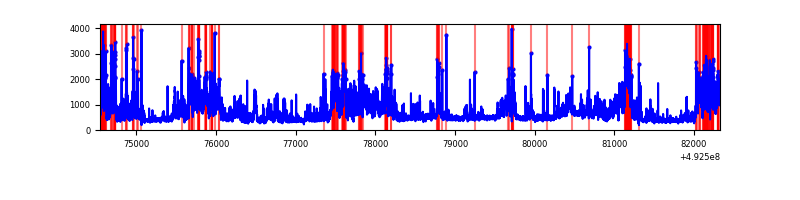 |
Top three noisy pixels from each quadrant. If the there are fewer than three noisy pixels in the level2.evt file, extra rows are filled as -1
| Pixel properties | Quadrant properties | ||||||
|---|---|---|---|---|---|---|---|
| Quadrant | DetID | PixID | Counts | Sigma | Mean | Median | Sigma |
| A | 15 | 174 | 727488 | 3669.97 | 798 | 776 | 198.0 |
| A | 0 | 8 | 368181 | 1855.43 | 798 | 776 | 198.0 |
| A | 3 | 27 | 56971 | 283.79 | 798 | 776 | 198.0 |
| B | 2 | 249 | 3415554 | 21323.32 | 748 | 724 | 160.1 |
| B | 4 | 206 | 545238 | 3400.12 | 748 | 724 | 160.1 |
| B | 4 | 171 | 226277 | 1408.43 | 748 | 724 | 160.1 |
| C | 1 | 241 | 12554385 | 98053.48 | 462 | 457 | 128.0 |
| C | 15 | 224 | 929298 | 7254.79 | 462 | 457 | 128.0 |
| C | 14 | 80 | 242511 | 1890.58 | 462 | 457 | 128.0 |
| D | 0 | 18 | 1640671 | 7326.83 | 780 | 744 | 223.8 |
| D | 2 | 249 | 342404 | 1526.46 | 780 | 744 | 223.8 |
| D | 3 | 12 | 326479 | 1455.31 | 780 | 744 | 223.8 |
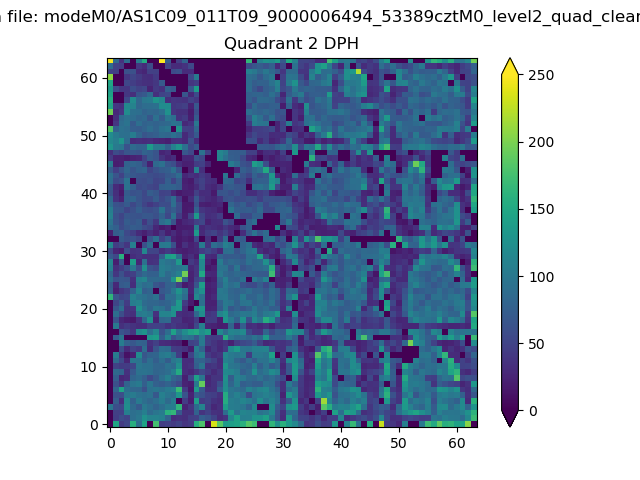
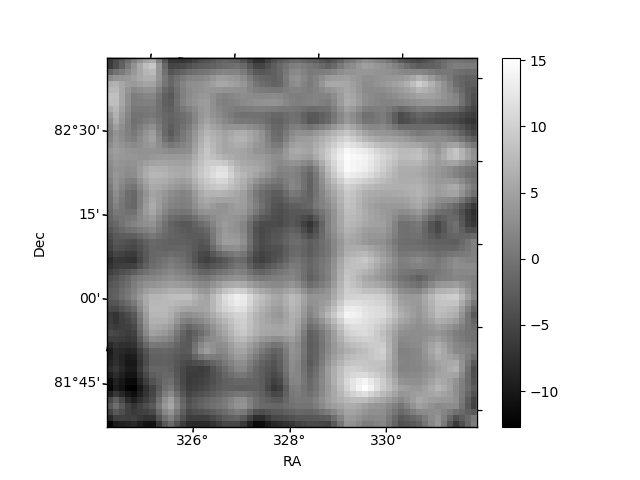
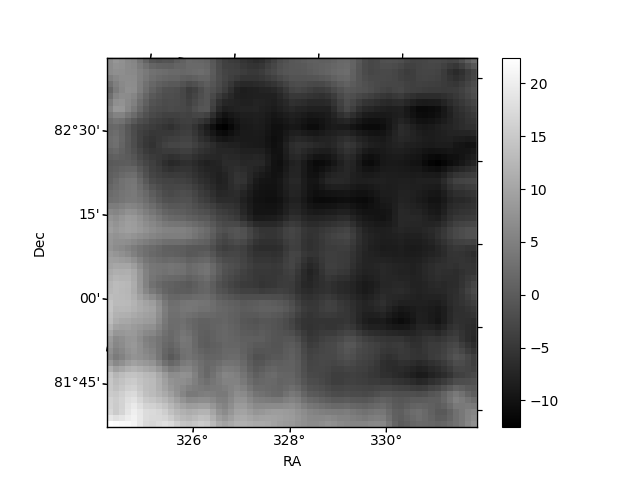
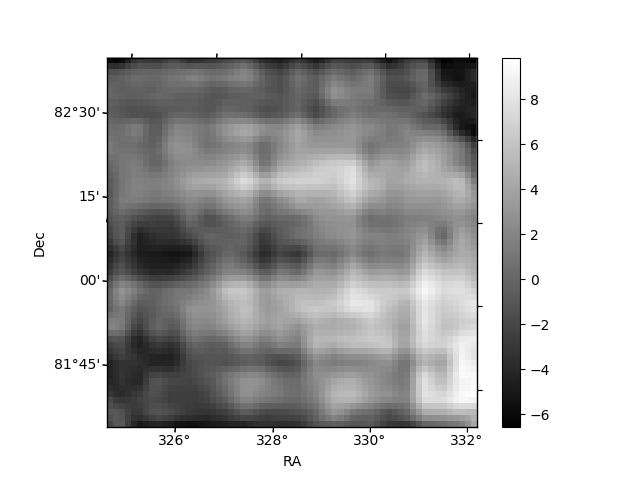
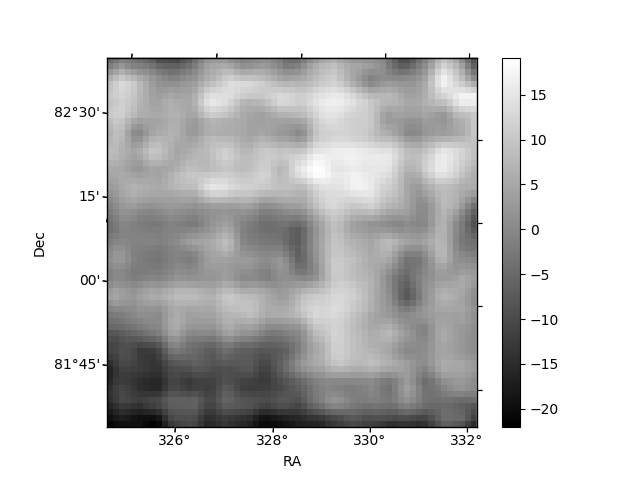
Histogram calculated using DETX and DETY for each event in the final _common_clean file
| Quadrant A | 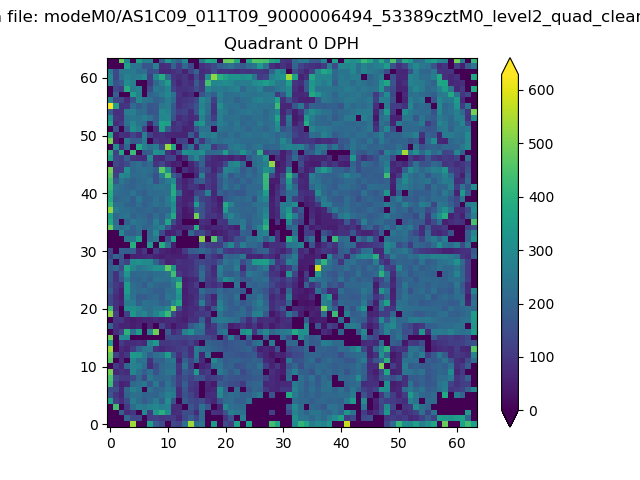 |
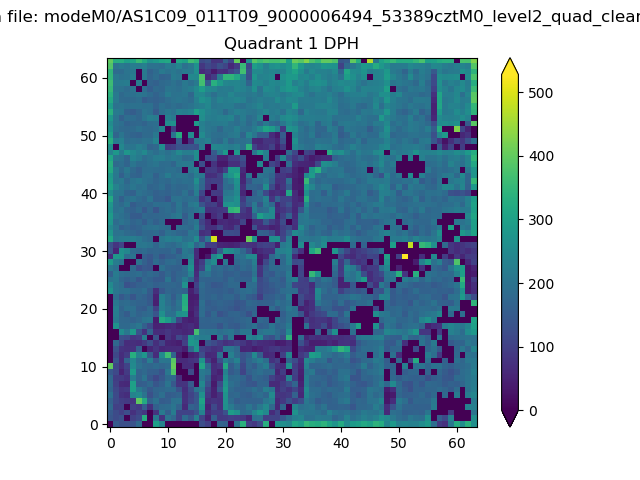 |
Quadrant B |
|---|---|---|---|
| Quadrant D | 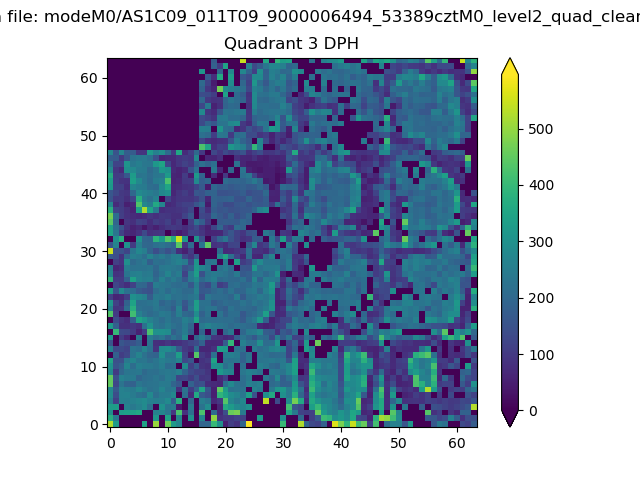 |
 |
Quadrant C |
| Plot type | Count rate plots | Images |
|---|---|---|
| Comparison with Poisson distribution Blue bars denote a histogram of data divided into 1 sec bins. Red curve is a Poisson curve with rate = median count rate of data. |
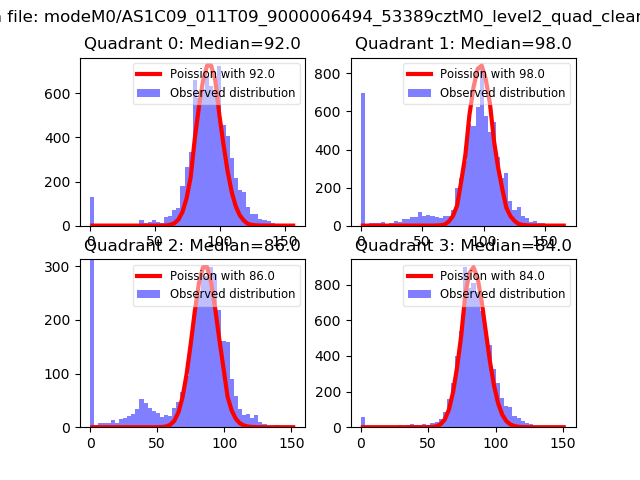 |
 |
| Quadrant-wise count rates Data is divided into 100 sec bins |
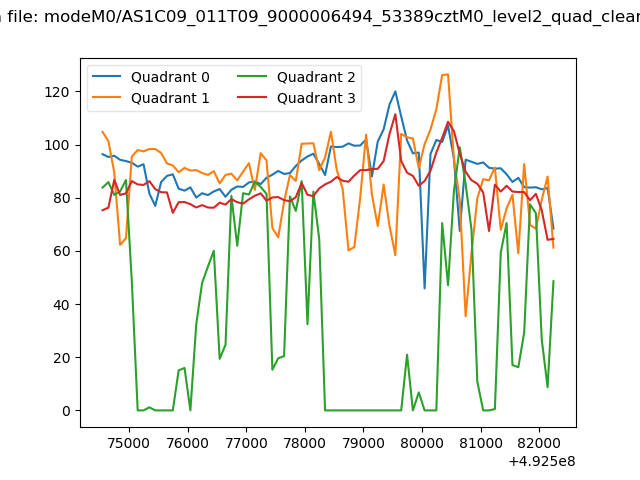 |
|
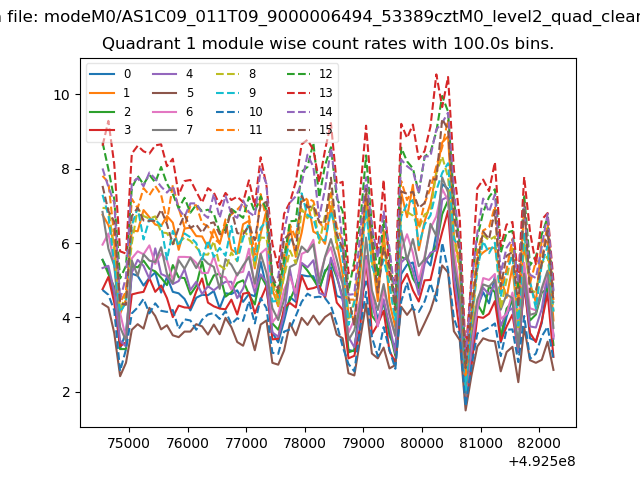
| Module-wise count rates for Quadrant A Data is divided into 100 sec bins |
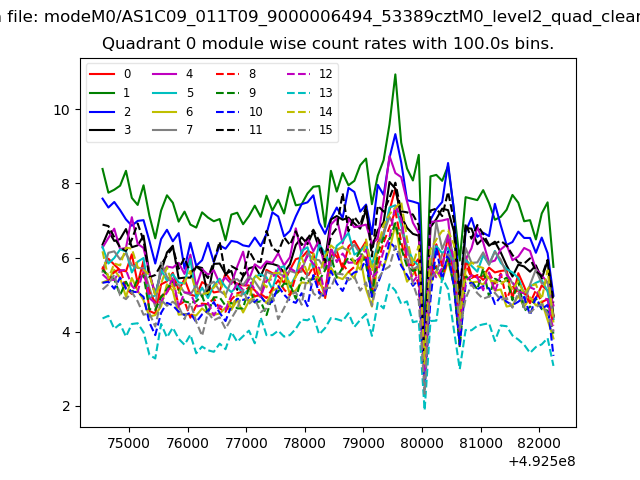 |
 |
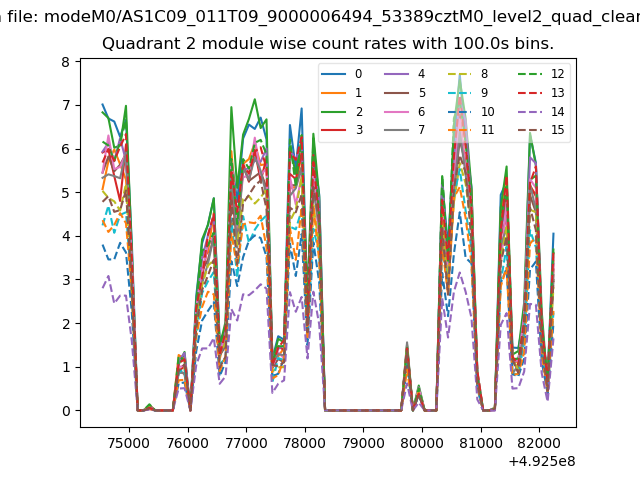
| Module-wise count rates for Quadrant B Data is divided into 100 sec bins |
 |
 |
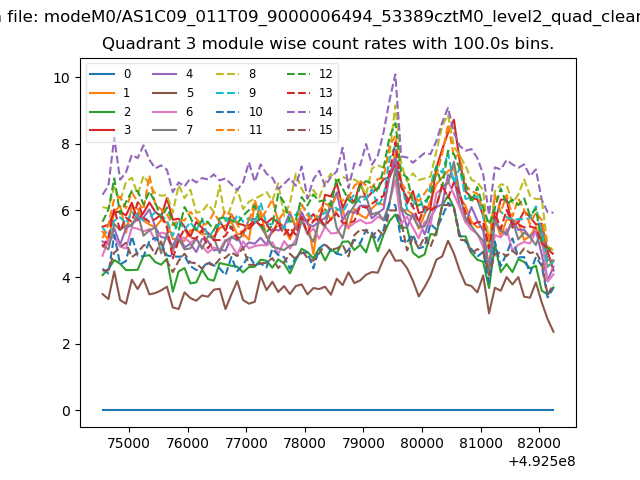
| Module-wise count rates for Quadrant C Data is divided into 100 sec bins |
 |
 |
| Module-wise count rates for Quadrant D Data is divided into 100 sec bins |
 |
 |
| Parameter | Plot |
|---|---|
| CZT HV Monitor | 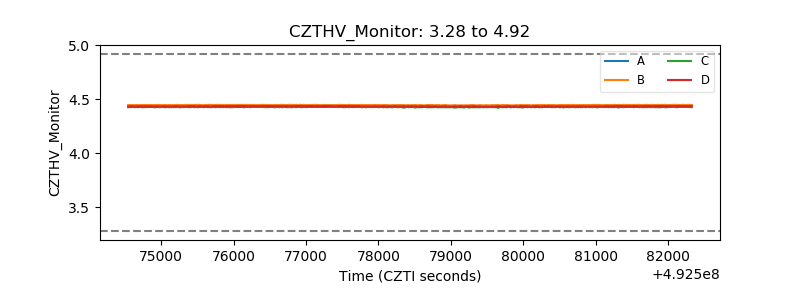 |
| D_VDD | 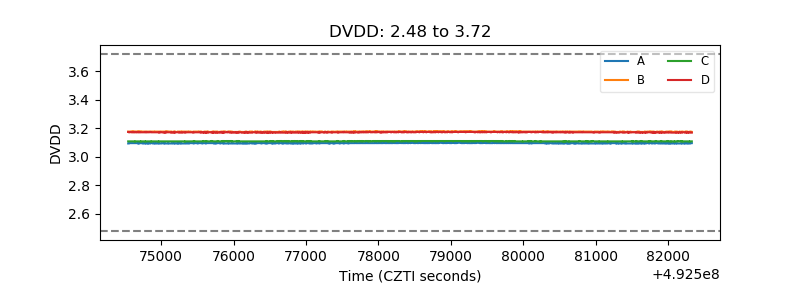 |
| Temperature 1 | 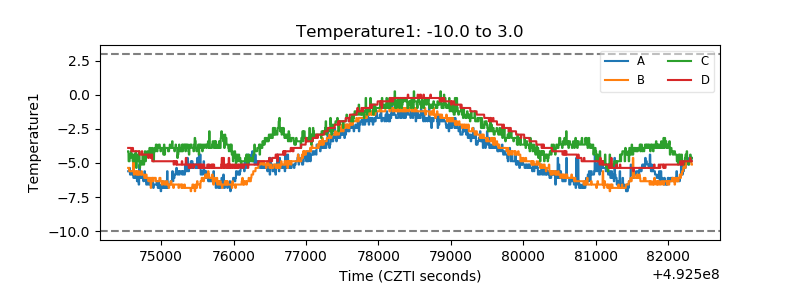 |
| Veto HV Monitor |  |
| Veto LLD | 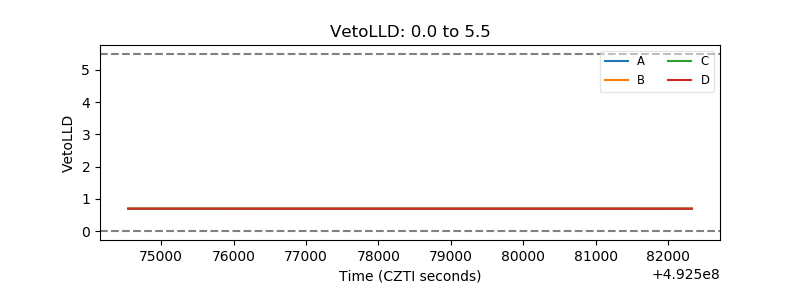 |
| Alpha Counter |  |
| _CPM_Rate | 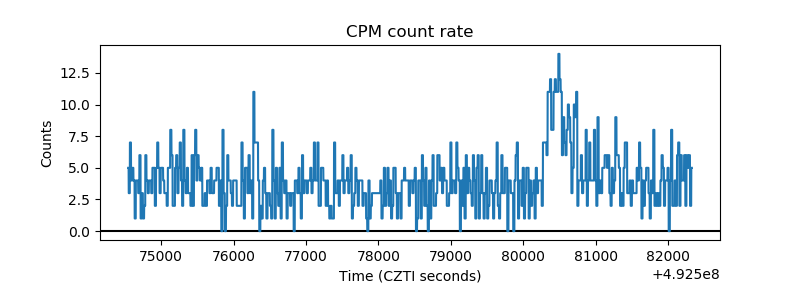 |
| CZT Counter | 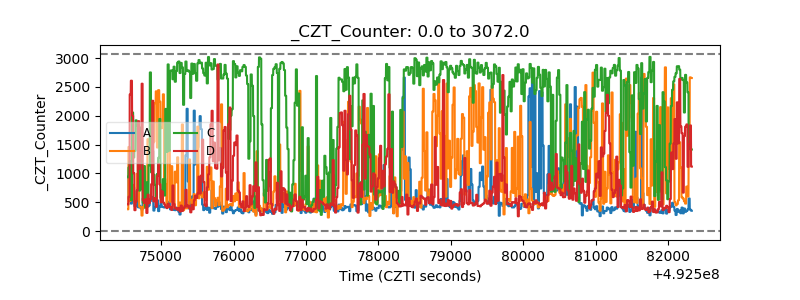 |
| +2.5 Volts monitor | 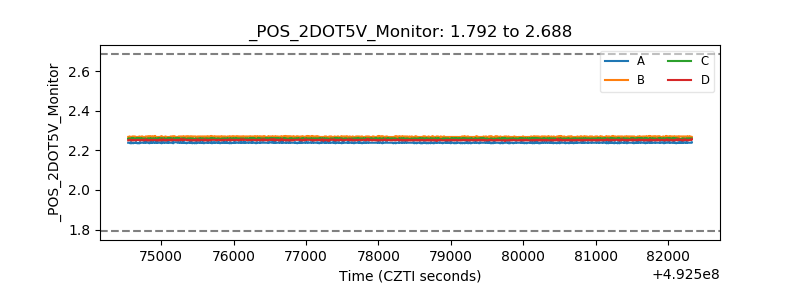 |
| +5 Volts monitor | 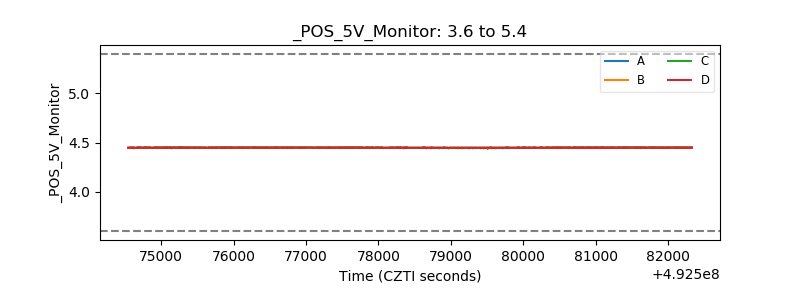 |
| _ROLL_ROT | 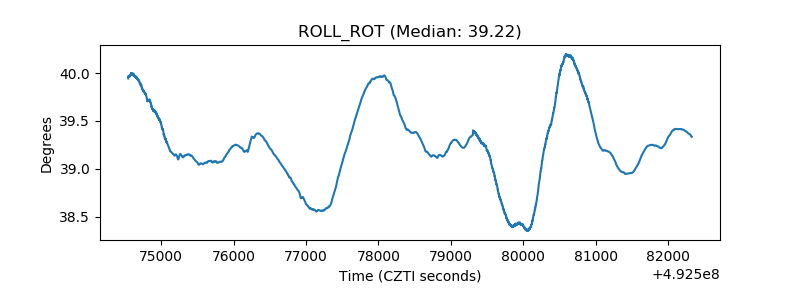 |
| _Roll_DEC | 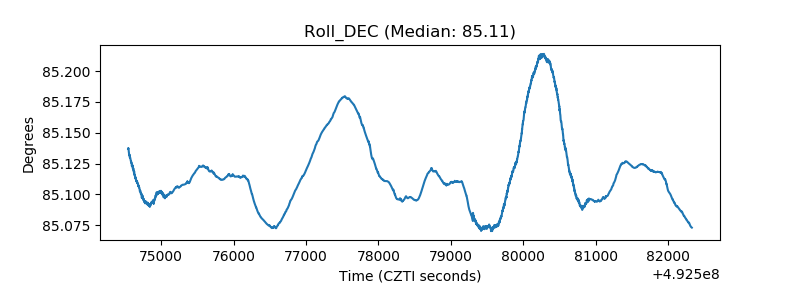 |
| _Roll_RA | 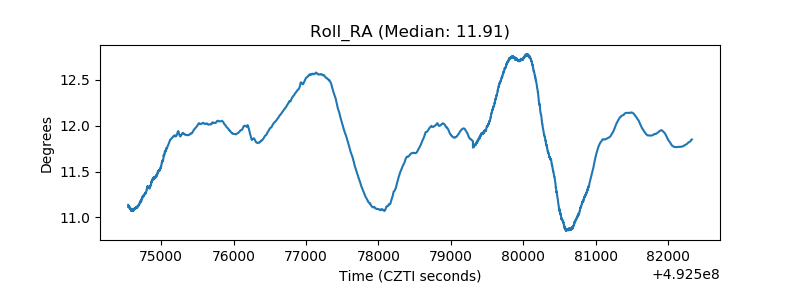 |
| Veto Counter | 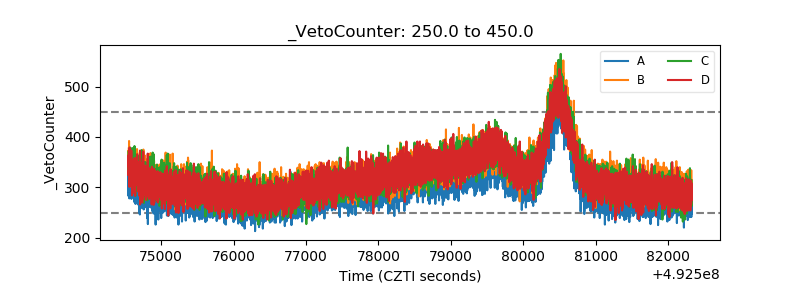 |