| Param | Original file | Final file |
|---|---|---|
| Filename | modeM0/AS1C09_011T09_9000006494_53392cztM0_level2.fits | modeM0/AS1C09_011T09_9000006494_53392cztM0_level2_quad_clean.evt |
| Size (bytes) | 2,269,359,360 | 207,501,120 |
| Size | 2.1 GB | 197.9 MB |
| Events in quadrant A | 11,118,636 | 1,585,995 |
| Events in quadrant B | 18,672,273 | 1,504,818 |
| Events in quadrant C | 40,090,960 | 460,202 |
| Events in quadrant D | 12,734,096 | 1,489,055 |
| Mode SS | |||
|---|---|---|---|
| Quadrant | BADHDUFLAG | Total packets | Discarded packets |
| A | 0 | 368 | 0 |
| B | 0 | 368 | 0 |
| C | 0 | 368 | 0 |
| D | 0 | 368 | 0 |
| Mode M0 | |||
|---|---|---|---|
| Quadrant | BADHDUFLAG | Total packets | Discarded packets |
| A | 0 | 46047 | 3 |
| B | 0 | 67893 | 3 |
| C | 0 | 131283 | 3 |
| D | 0 | 50651 | 4 |
| Mode M9 | |||
|---|---|---|---|
| Quadrant | BADHDUFLAG | Total packets | Discarded packets |
| A | 0 | 15 | 0 |
| B | 0 | 15 | 0 |
| C | 0 | 15 | 0 |
| D | 0 | 15 | 0 |
| Quadrant | Total seconds | Saturated seconds | Saturation percentage |
|---|---|---|---|
| A | 18003 | 935 | 5.193579% |
| B | 18003 | 3155 | 17.524857% |
| C | 18003 | 13332 | 74.054324% |
| D | 18003 | 610 | 3.388324% |
Noise dominated data is calculated using 1-second bins in cleaned event files. If a bin has >2000 counts, and if more than 50% of those come from <1% of pixels, then it is considered to be noise-dominated and hence unusable.
| Quadrant | # 1 sec bins | Bins with >0 counts | Bins with >2000 counts | High rate bins dominated by noise | Noise dominated (total time) | Noise dominated (detector-on time) | Marked lightcurve |
|---|---|---|---|---|---|---|---|
| A | 19563 | 18006 | 648 | 648 | 3.31% | 3.60% | 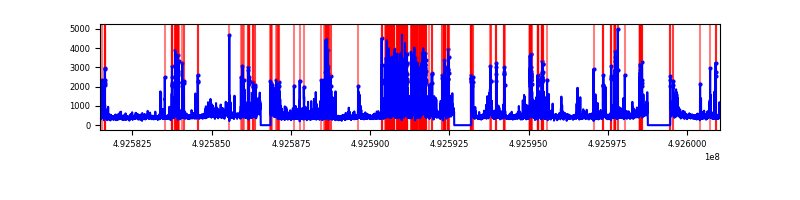 |
| B | 19563 | 18006 | 2021 | 2021 | 10.33% | 11.22% | 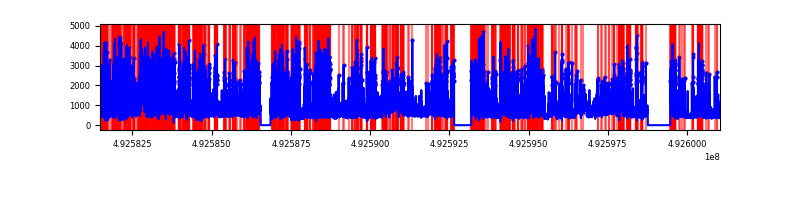 |
| C | 19563 | 18005 | 12583 | 12583 | 64.32% | 69.89% | 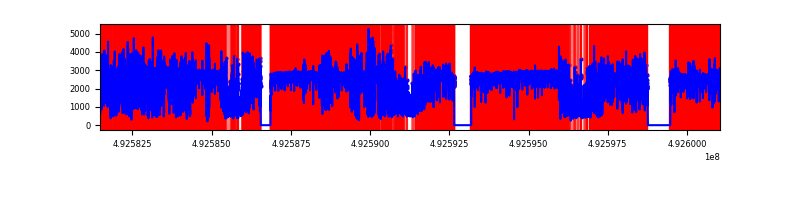 |
| D | 19563 | 18006 | 514 | 514 | 2.63% | 2.85% | 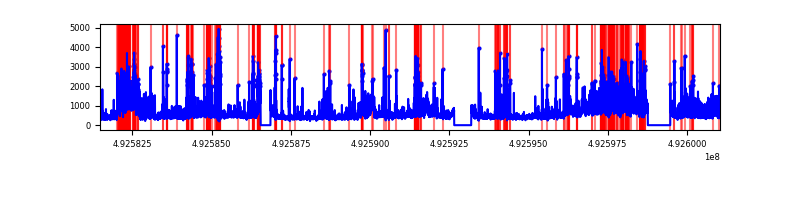 |
Top three noisy pixels from each quadrant. If the there are fewer than three noisy pixels in the level2.evt file, extra rows are filled as -1
| Pixel properties | Quadrant properties | ||||||
|---|---|---|---|---|---|---|---|
| Quadrant | DetID | PixID | Counts | Sigma | Mean | Median | Sigma |
| A | 3 | 63 | 1820667 | 3953.13 | 1857 | 1811 | 460.1 |
| A | 15 | 174 | 922422 | 2000.87 | 1857 | 1811 | 460.1 |
| A | 3 | 27 | 232939 | 502.34 | 1857 | 1811 | 460.1 |
| B | 2 | 249 | 6209051 | 16823.21 | 1745 | 1687 | 369.0 |
| B | 4 | 206 | 2459255 | 6660.5 | 1745 | 1687 | 369.0 |
| B | 4 | 171 | 1406812 | 3808.17 | 1745 | 1687 | 369.0 |
| C | 1 | 241 | 20707129 | 77107.58 | 975 | 965 | 268.5 |
| C | 15 | 178 | 10847689 | 40392.06 | 975 | 965 | 268.5 |
| C | 15 | 224 | 3175312 | 11820.93 | 975 | 965 | 268.5 |
| D | 0 | 18 | 2377808 | 4634.55 | 1819 | 1737 | 512.7 |
| D | 3 | 12 | 668548 | 1300.62 | 1819 | 1737 | 512.7 |
| D | 2 | 249 | 620242 | 1206.4 | 1819 | 1737 | 512.7 |
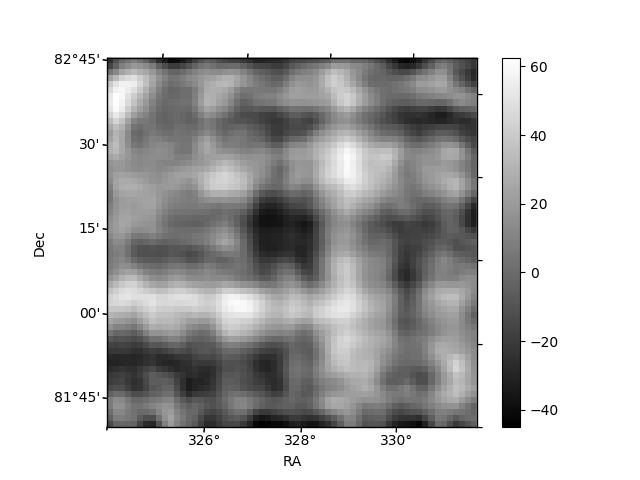
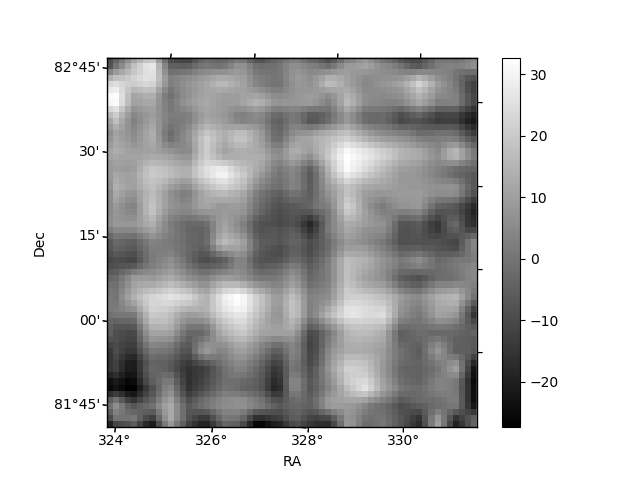
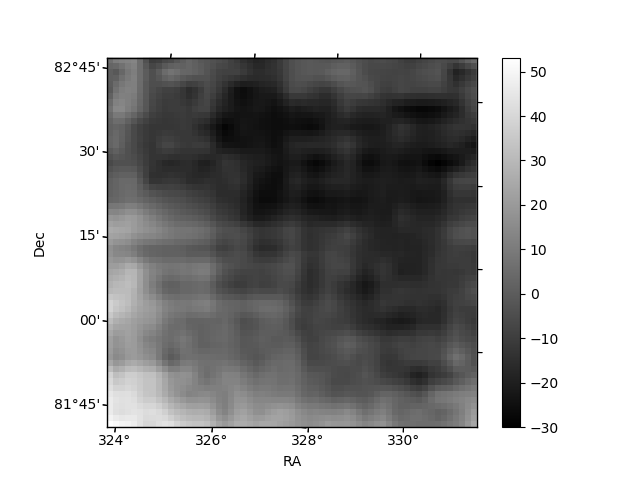
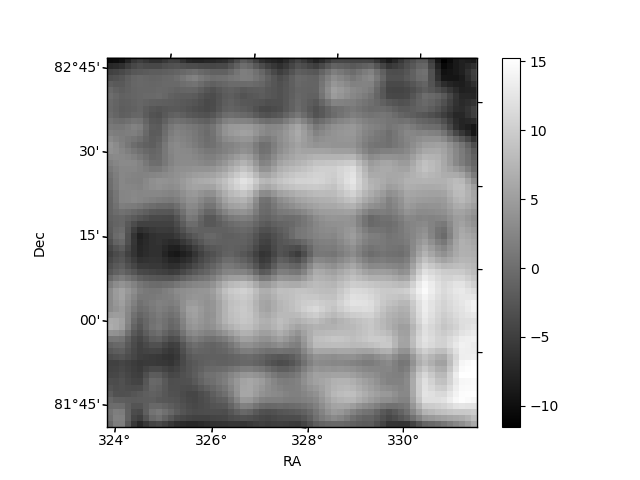
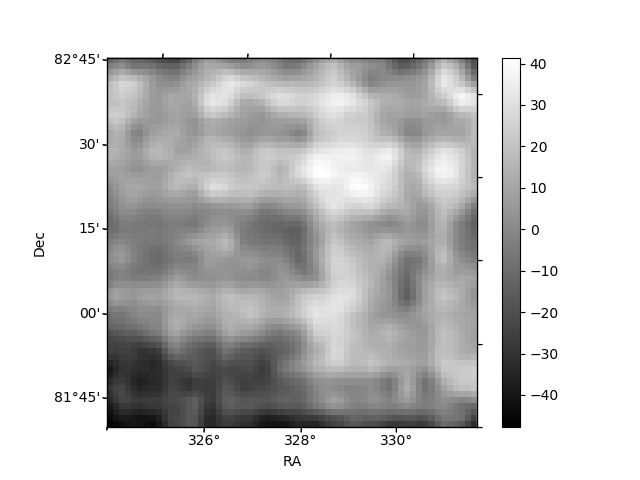
Histogram calculated using DETX and DETY for each event in the final _common_clean file
| Quadrant A | 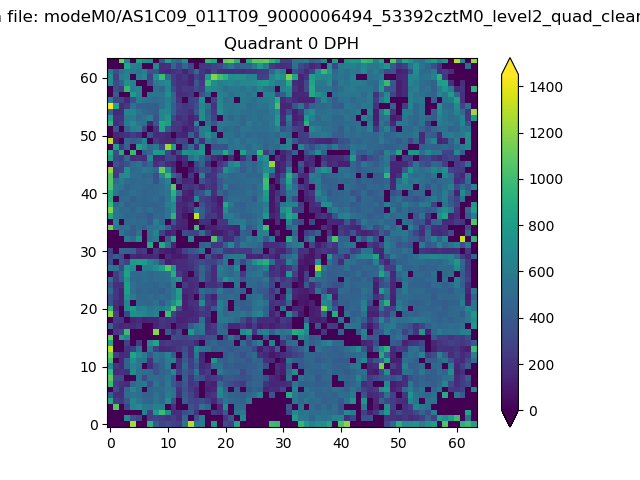 |
 |
Quadrant B |
|---|---|---|---|
| Quadrant D | 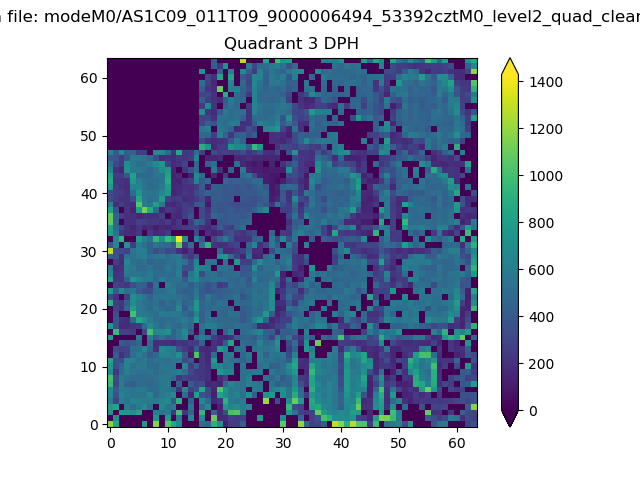 |
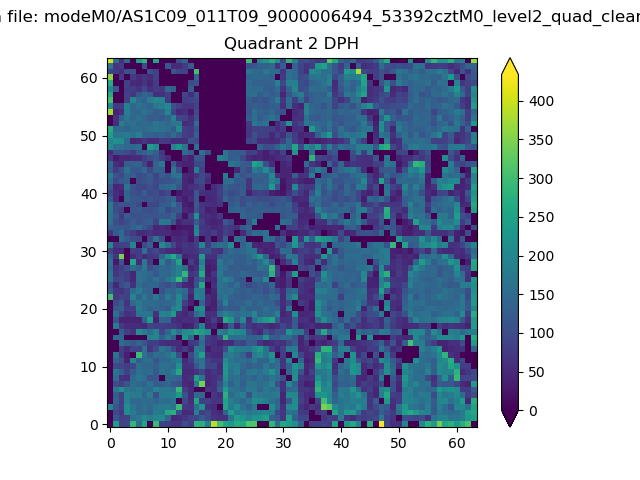 |
Quadrant C |
| Plot type | Count rate plots | Images |
|---|---|---|
| Comparison with Poisson distribution Blue bars denote a histogram of data divided into 1 sec bins. Red curve is a Poisson curve with rate = median count rate of data. |
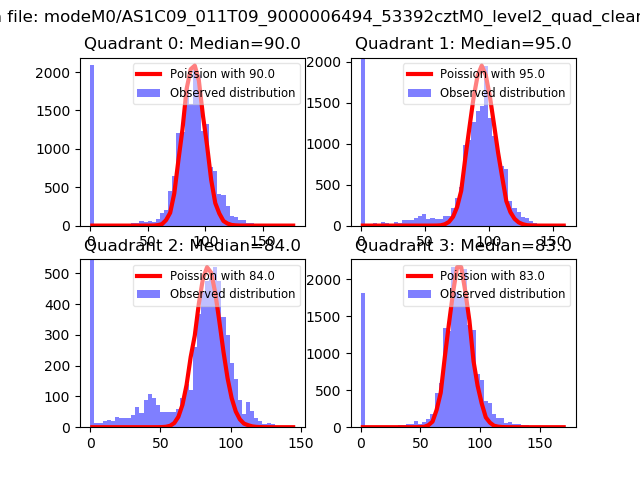 |
 |
| Quadrant-wise count rates Data is divided into 100 sec bins |
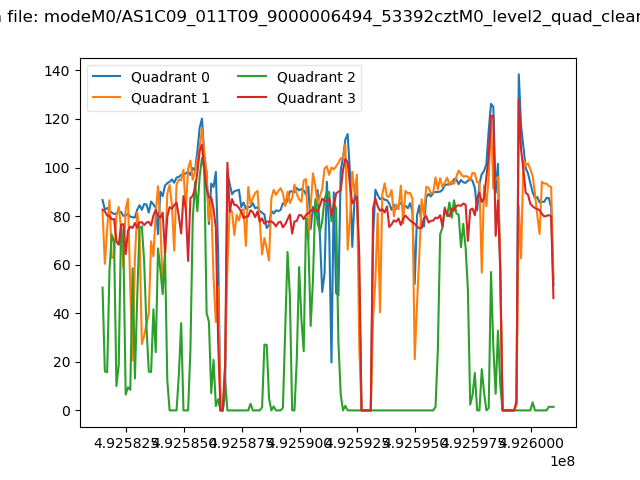 |
|
| Module-wise count rates for Quadrant A Data is divided into 100 sec bins |
 |
 |
| Module-wise count rates for Quadrant B Data is divided into 100 sec bins |
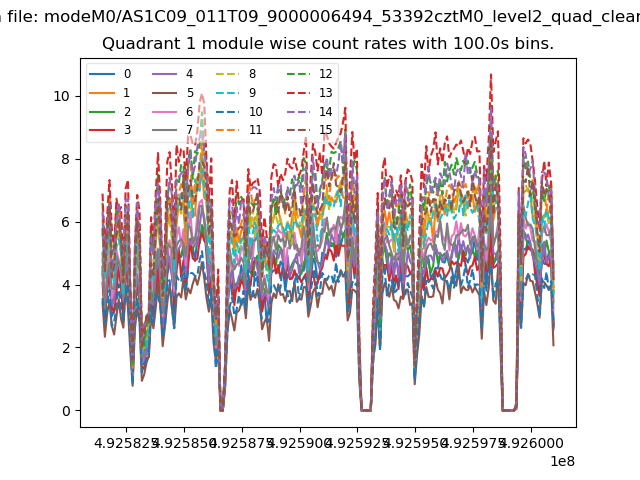 |
 |
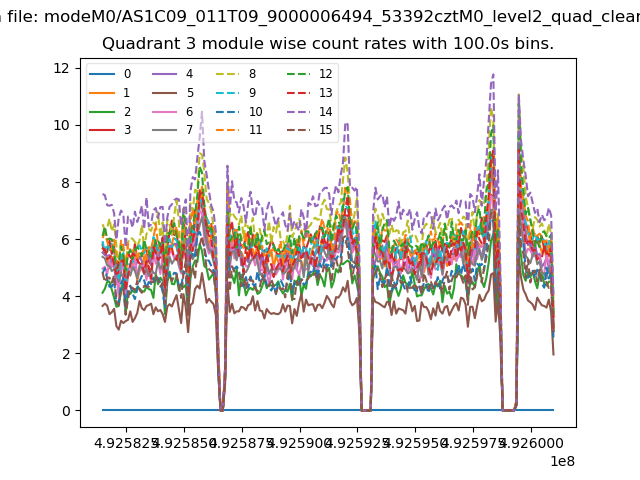
| Module-wise count rates for Quadrant C Data is divided into 100 sec bins |
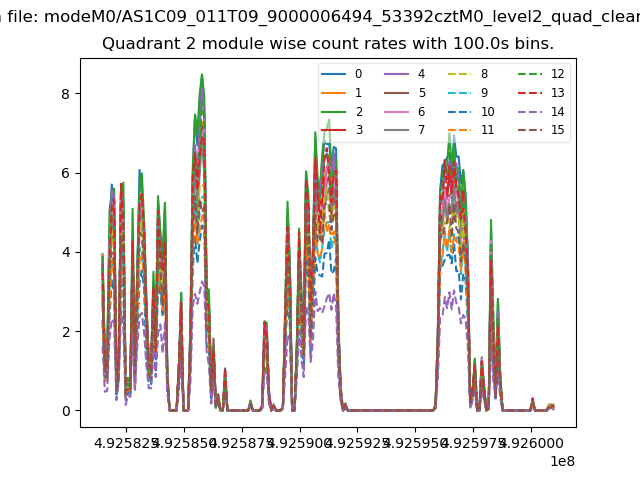 |
 |
| Module-wise count rates for Quadrant D Data is divided into 100 sec bins |
 |
 |
| Parameter | Plot |
|---|---|
| CZT HV Monitor | 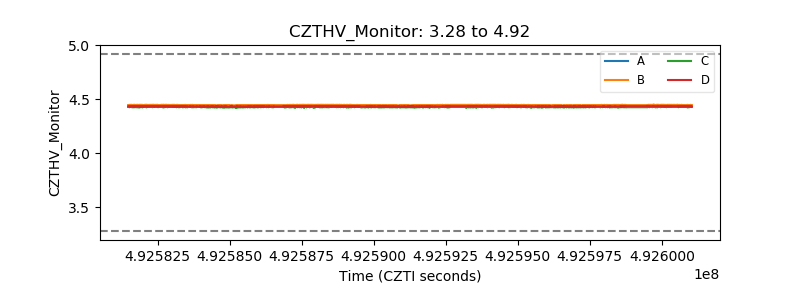 |
| D_VDD | 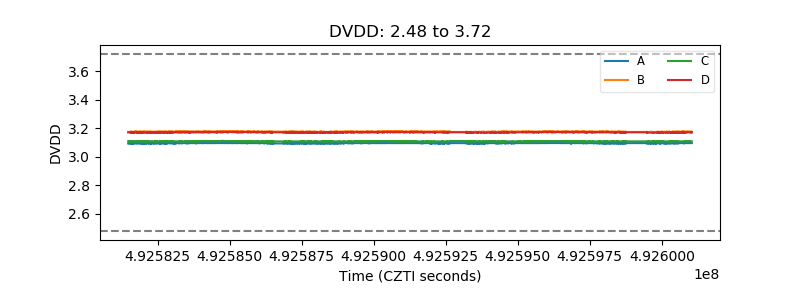 |
| Temperature 1 | 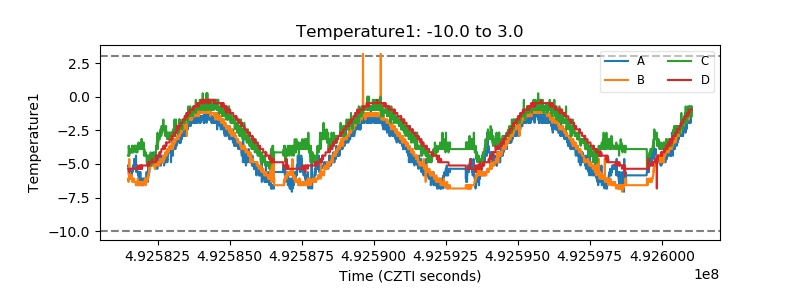 |
| Veto HV Monitor | 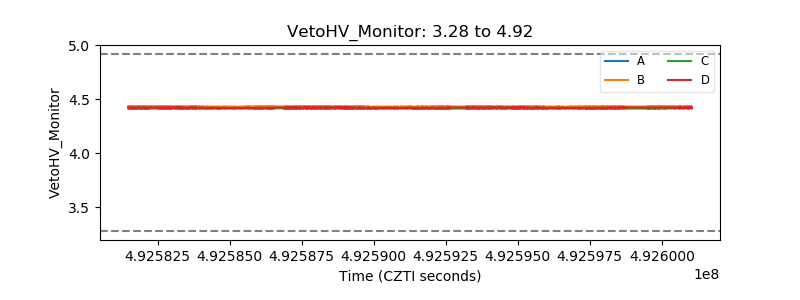 |
| Veto LLD | 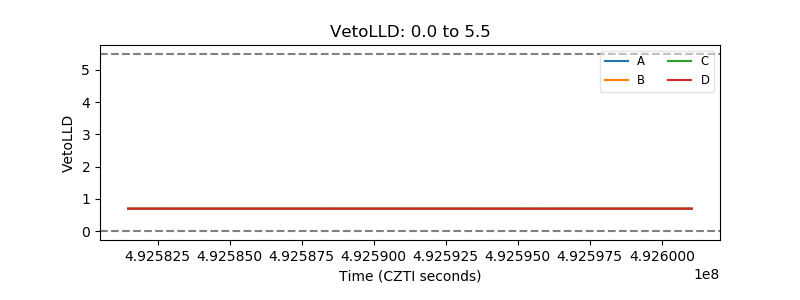 |
| Alpha Counter | 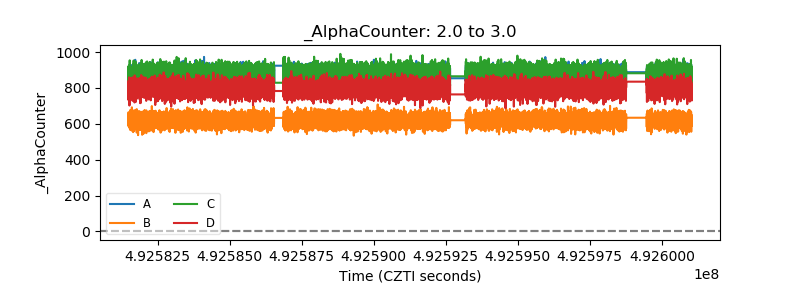 |
| _CPM_Rate | 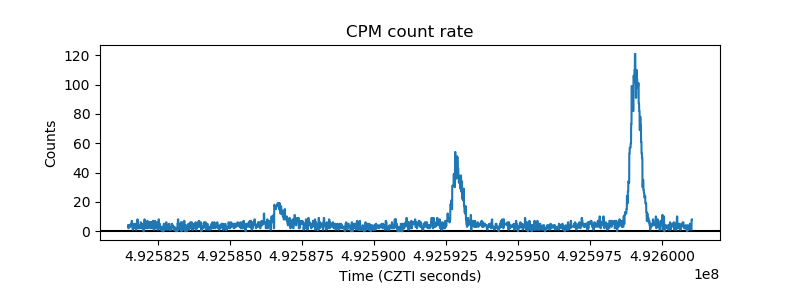 |
| CZT Counter | 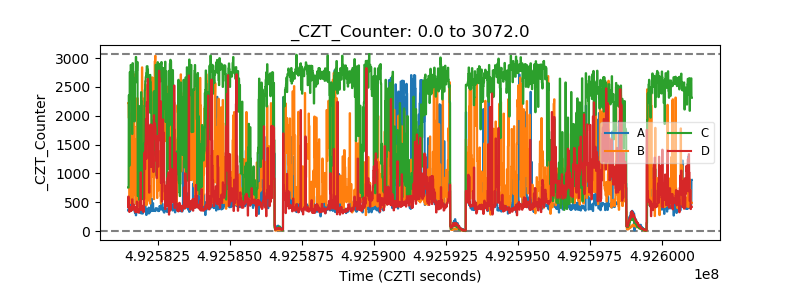 |
| +2.5 Volts monitor |  |
| +5 Volts monitor | 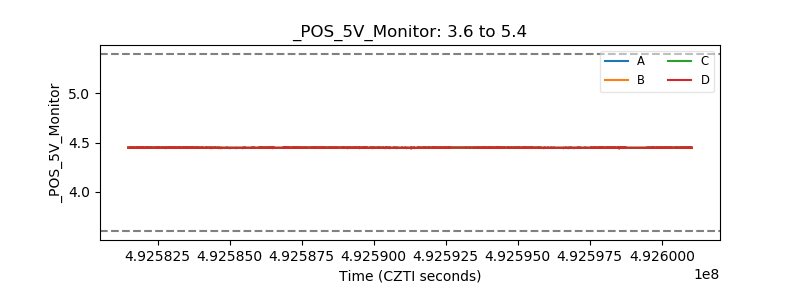 |
| _ROLL_ROT | 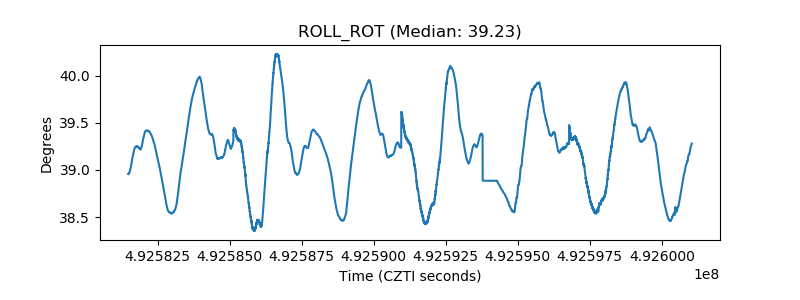 |
| _Roll_DEC | 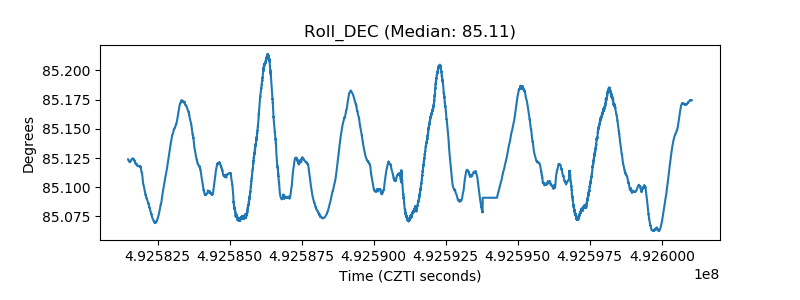 |
| _Roll_RA | 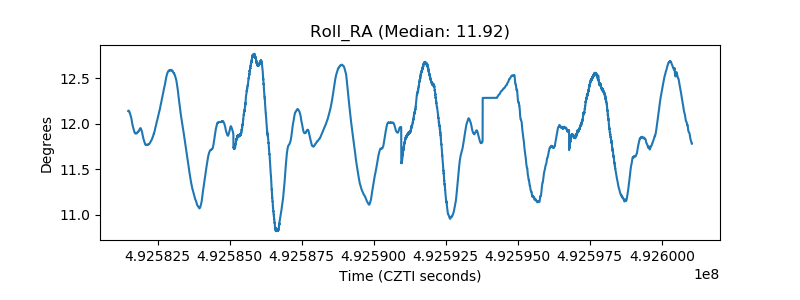 |
| Veto Counter | 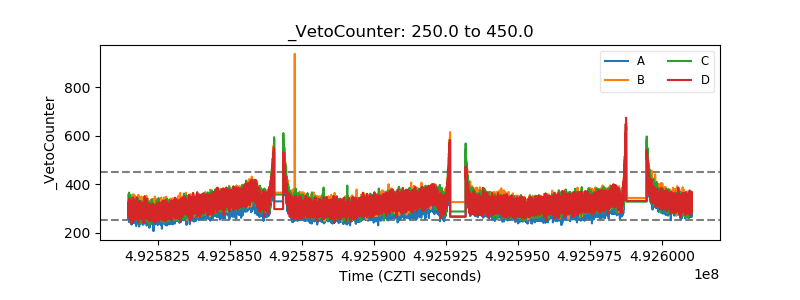 |