| Param | Original file | Final file |
|---|---|---|
| Filename | modeM0/AS1C09_011T09_9000006494_53393cztM0_level2.fits | modeM0/AS1C09_011T09_9000006494_53393cztM0_level2_quad_clean.evt |
| Size (bytes) | 791,720,640 | 73,739,520 |
| Size | 755.0 MB | 70.3 MB |
| Events in quadrant A | 4,204,650 | 585,633 |
| Events in quadrant B | 5,436,221 | 588,765 |
| Events in quadrant C | 14,694,744 | 89,730 |
| Events in quadrant D | 4,483,425 | 529,336 |
| Mode SS | |||
|---|---|---|---|
| Quadrant | BADHDUFLAG | Total packets | Discarded packets |
| A | 0 | 128 | 0 |
| B | 0 | 128 | 0 |
| C | 0 | 128 | 0 |
| D | 0 | 128 | 0 |
| Mode M0 | |||
|---|---|---|---|
| Quadrant | BADHDUFLAG | Total packets | Discarded packets |
| A | 0 | 16886 | 1 |
| B | 0 | 20444 | 1 |
| C | 0 | 47938 | 6 |
| D | 0 | 17745 | 1 |
| Mode M9 | |||
|---|---|---|---|
| Quadrant | BADHDUFLAG | Total packets | Discarded packets |
| A | 0 | 9 | 0 |
| B | 0 | 9 | 0 |
| C | 0 | 9 | 0 |
| D | 0 | 9 | 0 |
| Quadrant | Total seconds | Saturated seconds | Saturation percentage |
|---|---|---|---|
| A | 6288 | 337 | 5.359415% |
| B | 6288 | 732 | 11.641221% |
| C | 6287 | 5402 | 85.923334% |
| D | 6287 | 247 | 3.928742% |
Noise dominated data is calculated using 1-second bins in cleaned event files. If a bin has >2000 counts, and if more than 50% of those come from <1% of pixels, then it is considered to be noise-dominated and hence unusable.
| Quadrant | # 1 sec bins | Bins with >0 counts | Bins with >2000 counts | High rate bins dominated by noise | Noise dominated (total time) | Noise dominated (detector-on time) | Marked lightcurve |
|---|---|---|---|---|---|---|---|
| A | 7163 | 6289 | 233 | 233 | 3.25% | 3.70% | 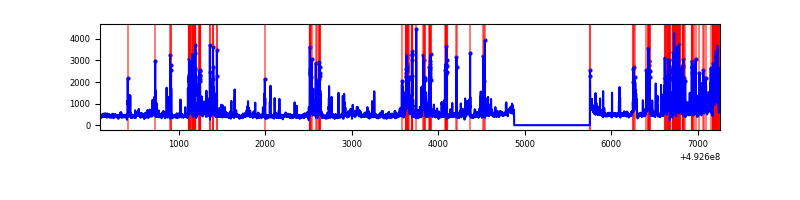 |
| B | 7163 | 6289 | 448 | 448 | 6.25% | 7.12% | 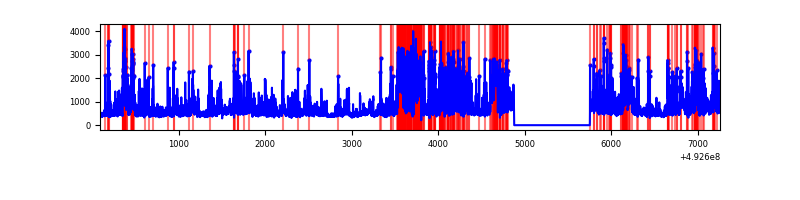 |
| C | 7162 | 6287 | 4950 | 4950 | 69.11% | 78.73% | 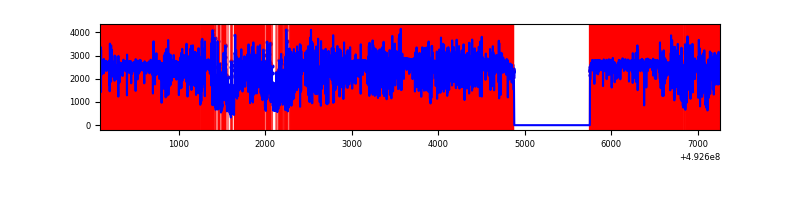 |
| D | 7162 | 6288 | 171 | 171 | 2.39% | 2.72% | 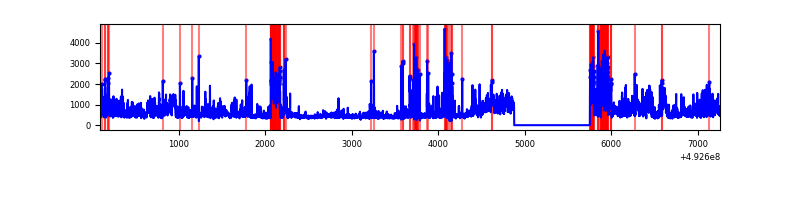 |
Top three noisy pixels from each quadrant. If the there are fewer than three noisy pixels in the level2.evt file, extra rows are filled as -1
| Pixel properties | Quadrant properties | ||||||
|---|---|---|---|---|---|---|---|
| Quadrant | DetID | PixID | Counts | Sigma | Mean | Median | Sigma |
| A | 15 | 174 | 626183 | 3845.61 | 658 | 643 | 162.7 |
| A | 7 | 206 | 385693 | 2367.16 | 658 | 643 | 162.7 |
| A | 12 | 115 | 173911 | 1065.19 | 658 | 643 | 162.7 |
| B | 4 | 206 | 689384 | 5115.46 | 633 | 612 | 134.6 |
| B | 4 | 171 | 654901 | 4859.36 | 633 | 612 | 134.6 |
| B | 2 | 249 | 497436 | 3689.88 | 633 | 612 | 134.6 |
| C | 15 | 178 | 6994906 | 74903.25 | 339 | 335 | 93.4 |
| C | 1 | 241 | 4747636 | 50837.75 | 339 | 335 | 93.4 |
| C | 15 | 224 | 1034117 | 11070.53 | 339 | 335 | 93.4 |
| D | 0 | 18 | 901306 | 4931.08 | 638 | 609 | 182.7 |
| D | 11 | 245 | 355151 | 1941.03 | 638 | 609 | 182.7 |
| D | 2 | 153 | 291724 | 1593.78 | 638 | 609 | 182.7 |
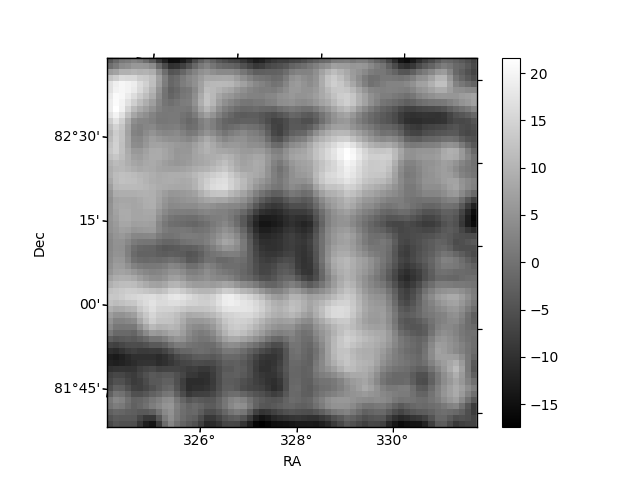
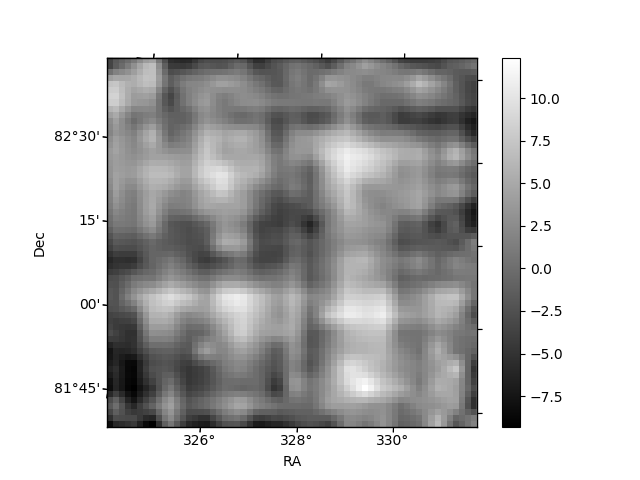
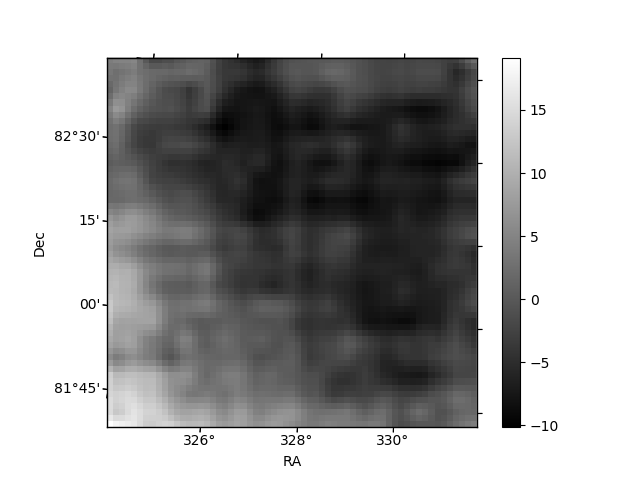
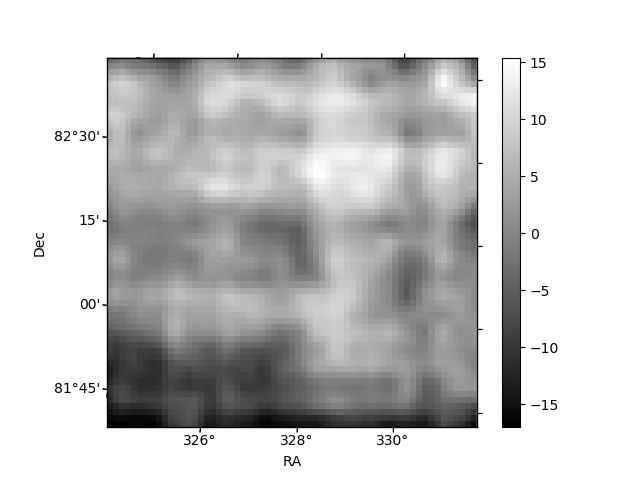
Histogram calculated using DETX and DETY for each event in the final _common_clean file
| Quadrant A | 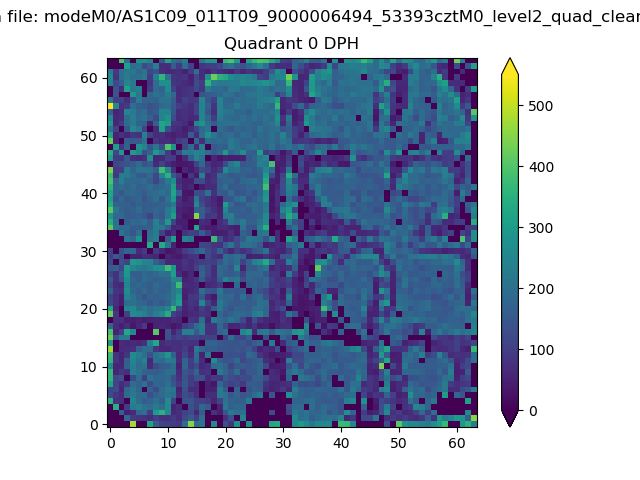 |
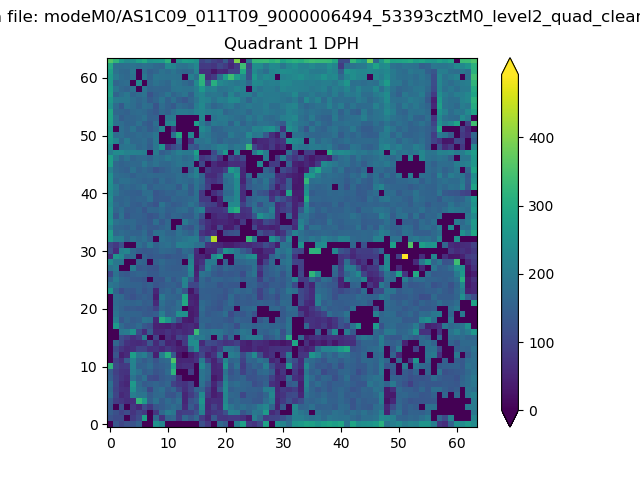 |
Quadrant B |
|---|---|---|---|
| Quadrant D | 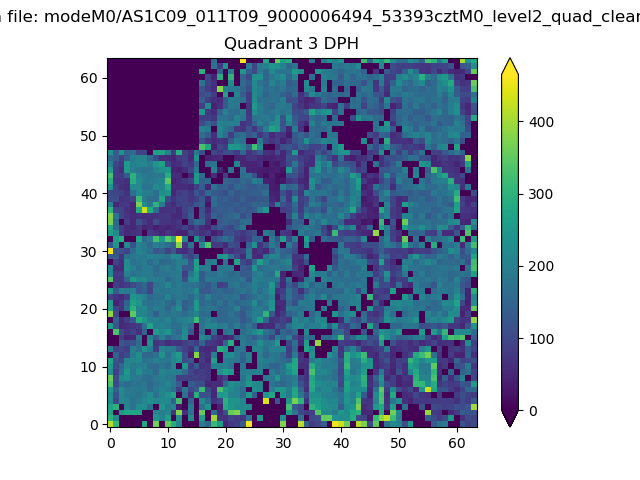 |
 |
Quadrant C |
| Plot type | Count rate plots | Images |
|---|---|---|
| Comparison with Poisson distribution Blue bars denote a histogram of data divided into 1 sec bins. Red curve is a Poisson curve with rate = median count rate of data. |
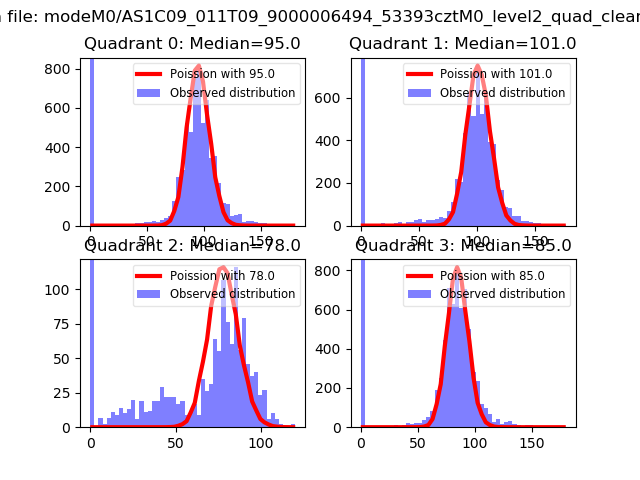 |
 |
| Quadrant-wise count rates Data is divided into 100 sec bins |
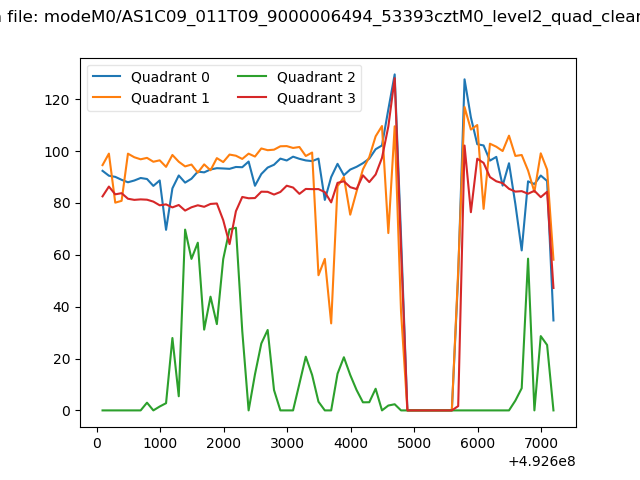 |
|
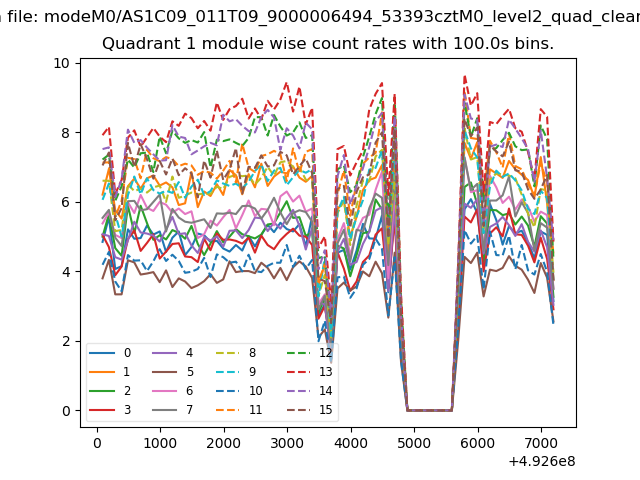
| Module-wise count rates for Quadrant A Data is divided into 100 sec bins |
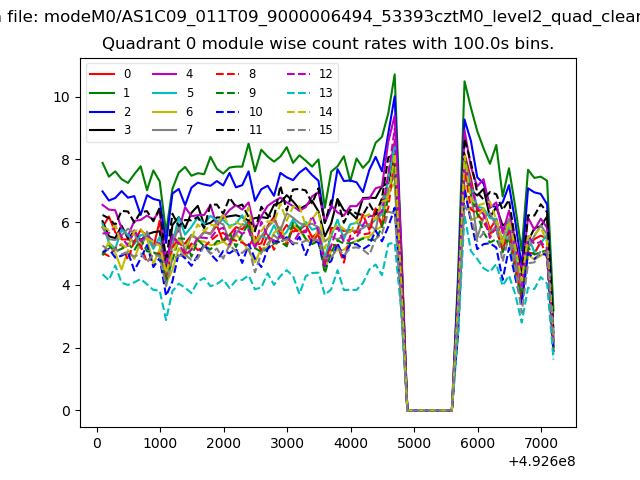 |
 |
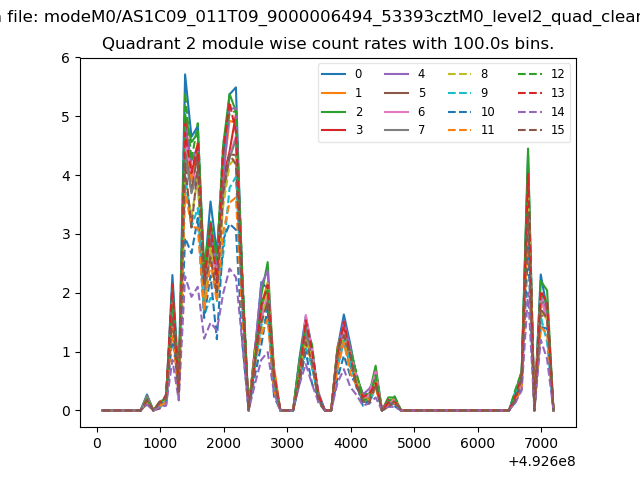
| Module-wise count rates for Quadrant B Data is divided into 100 sec bins |
 |
 |
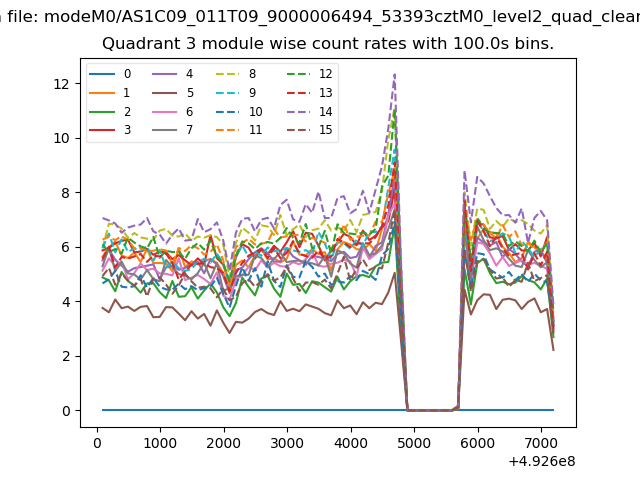
| Module-wise count rates for Quadrant C Data is divided into 100 sec bins |
 |
 |
| Module-wise count rates for Quadrant D Data is divided into 100 sec bins |
 |
 |
| Parameter | Plot |
|---|---|
| CZT HV Monitor | 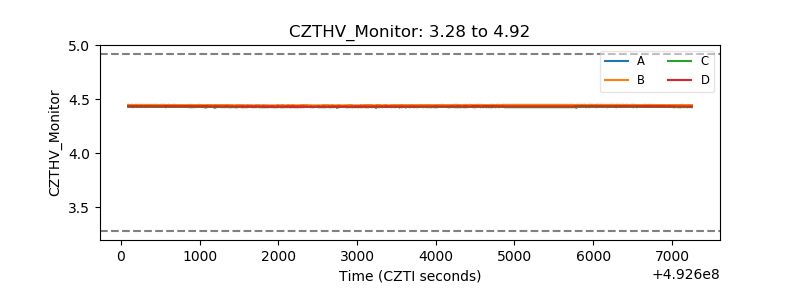 |
| D_VDD | 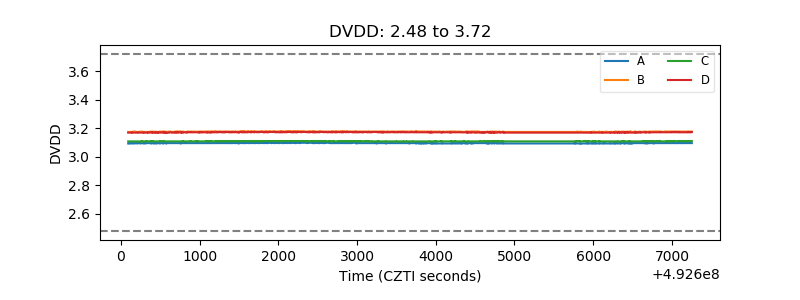 |
| Temperature 1 | 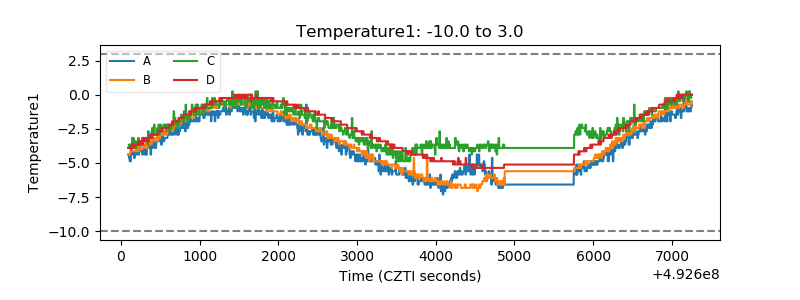 |
| Veto HV Monitor |  |
| Veto LLD | 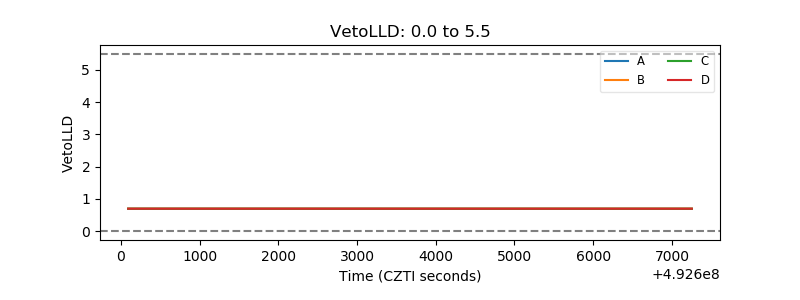 |
| Alpha Counter | 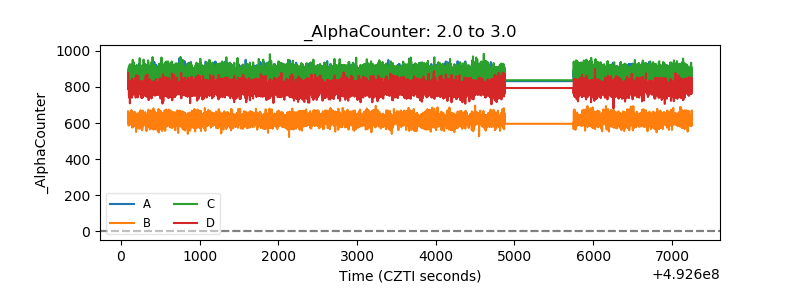 |
| _CPM_Rate | 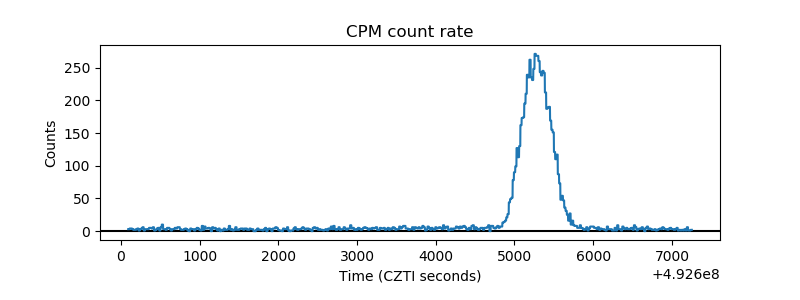 |
| CZT Counter | 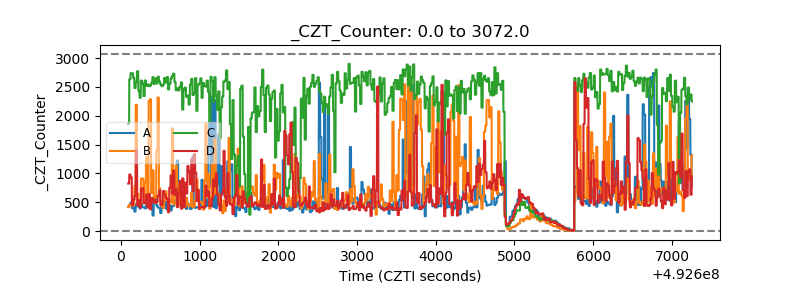 |
| +2.5 Volts monitor |  |
| +5 Volts monitor |  |
| _ROLL_ROT | 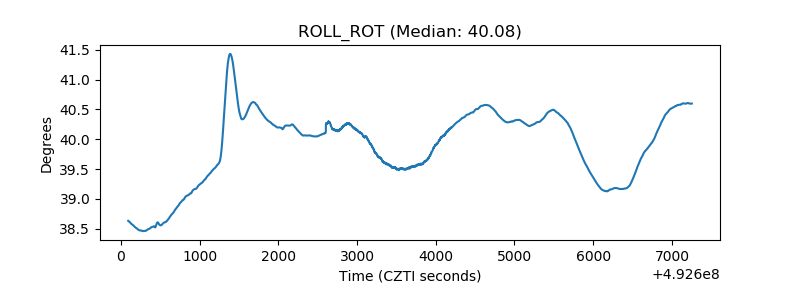 |
| _Roll_DEC | 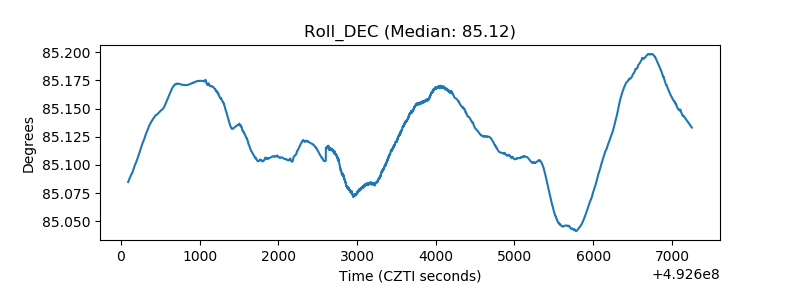 |
| _Roll_RA | 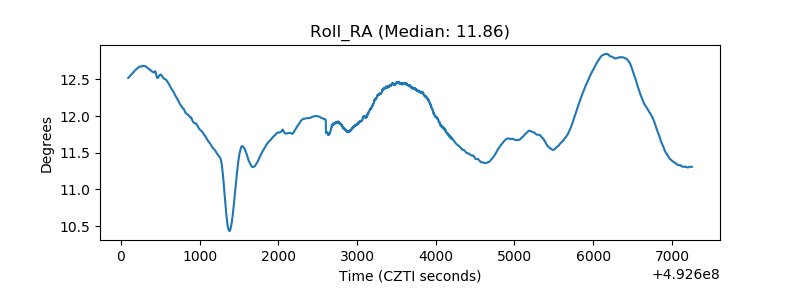 |
| Veto Counter | 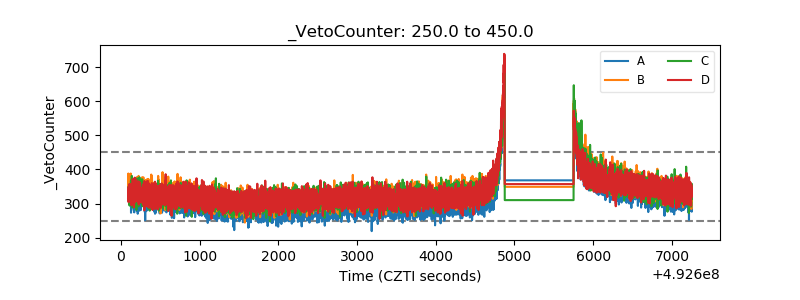 |