| Param | Original file | Final file |
|---|---|---|
| Filename | modeM0/AS1C09_011T09_9000006494_53395cztM0_level2.fits | modeM0/AS1C09_011T09_9000006494_53395cztM0_level2_quad_clean.evt |
| Size (bytes) | 946,088,640 | 73,002,240 |
| Size | 902.3 MB | 69.6 MB |
| Events in quadrant A | 5,112,761 | 594,441 |
| Events in quadrant B | 7,805,486 | 534,590 |
| Events in quadrant C | 15,772,018 | 68,927 |
| Events in quadrant D | 5,836,096 | 565,353 |
| Mode SS | |||
|---|---|---|---|
| Quadrant | BADHDUFLAG | Total packets | Discarded packets |
| A | 0 | 130 | 0 |
| B | 0 | 130 | 0 |
| C | 0 | 130 | 0 |
| D | 0 | 130 | 0 |
| Mode M0 | |||
|---|---|---|---|
| Quadrant | BADHDUFLAG | Total packets | Discarded packets |
| A | 0 | 19594 | 1 |
| B | 0 | 27611 | 1 |
| C | 0 | 51164 | 1 |
| D | 0 | 21866 | 1 |
| Mode M9 | |||
|---|---|---|---|
| Quadrant | BADHDUFLAG | Total packets | Discarded packets |
| A | 0 | 10 | 0 |
| B | 0 | 10 | 0 |
| C | 0 | 10 | 0 |
| D | 0 | 10 | 0 |
| Quadrant | Total seconds | Saturated seconds | Saturation percentage |
|---|---|---|---|
| A | 6403 | 597 | 9.323754% |
| B | 6403 | 1563 | 24.410433% |
| C | 6403 | 5757 | 89.910979% |
| D | 6403 | 183 | 2.858035% |
Noise dominated data is calculated using 1-second bins in cleaned event files. If a bin has >2000 counts, and if more than 50% of those come from <1% of pixels, then it is considered to be noise-dominated and hence unusable.
| Quadrant | # 1 sec bins | Bins with >0 counts | Bins with >2000 counts | High rate bins dominated by noise | Noise dominated (total time) | Noise dominated (detector-on time) | Marked lightcurve |
|---|---|---|---|---|---|---|---|
| A | 7388 | 6403 | 411 | 411 | 5.56% | 6.42% | 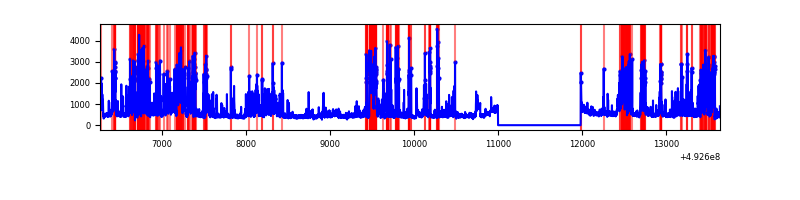 |
| B | 7388 | 6403 | 1087 | 1087 | 14.71% | 16.98% | 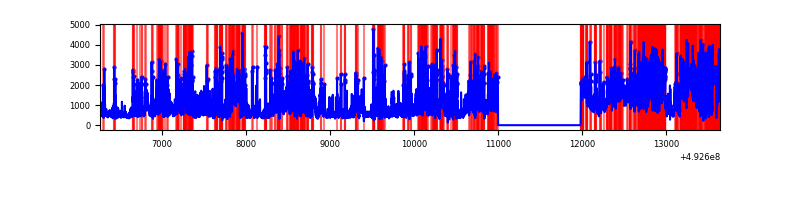 |
| C | 7388 | 6403 | 5382 | 5382 | 72.85% | 84.05% | 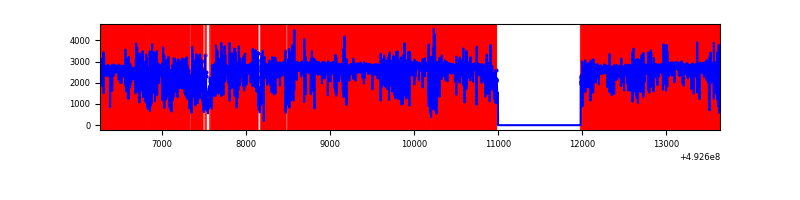 |
| D | 7388 | 6403 | 131 | 131 | 1.77% | 2.05% | 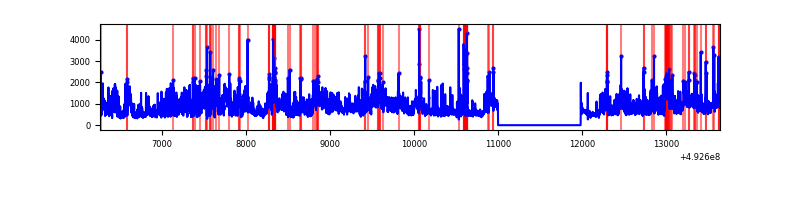 |
Top three noisy pixels from each quadrant. If the there are fewer than three noisy pixels in the level2.evt file, extra rows are filled as -1
| Pixel properties | Quadrant properties | ||||||
|---|---|---|---|---|---|---|---|
| Quadrant | DetID | PixID | Counts | Sigma | Mean | Median | Sigma |
| A | 15 | 174 | 893766 | 5343.25 | 669 | 655 | 167.1 |
| A | 7 | 206 | 610145 | 3646.42 | 669 | 655 | 167.1 |
| A | 12 | 115 | 462033 | 2760.3 | 669 | 655 | 167.1 |
| B | 2 | 249 | 2918510 | 22846.73 | 600 | 580 | 127.7 |
| B | 4 | 206 | 611850 | 4786.11 | 600 | 580 | 127.7 |
| B | 4 | 171 | 586280 | 4585.9 | 600 | 580 | 127.7 |
| C | 1 | 241 | 8938045 | 105695.74 | 303 | 300 | 84.6 |
| C | 15 | 178 | 3883579 | 45922.77 | 303 | 300 | 84.6 |
| C | 15 | 224 | 1005042 | 11881.85 | 303 | 300 | 84.6 |
| D | 0 | 18 | 2198047 | 11519.94 | 665 | 635 | 190.7 |
| D | 2 | 153 | 222635 | 1163.84 | 665 | 635 | 190.7 |
| D | 3 | 12 | 176643 | 922.72 | 665 | 635 | 190.7 |
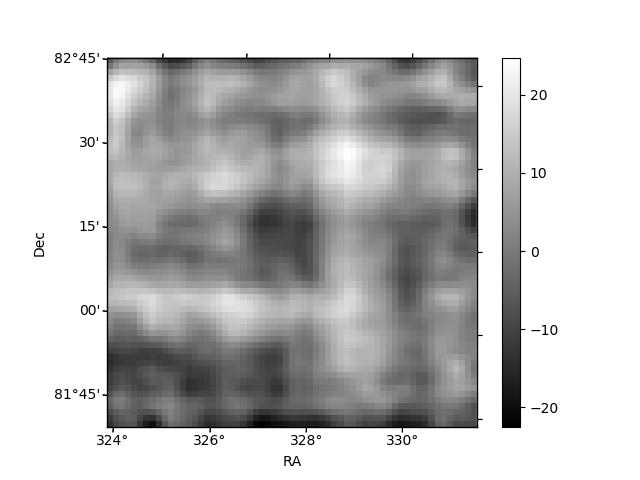
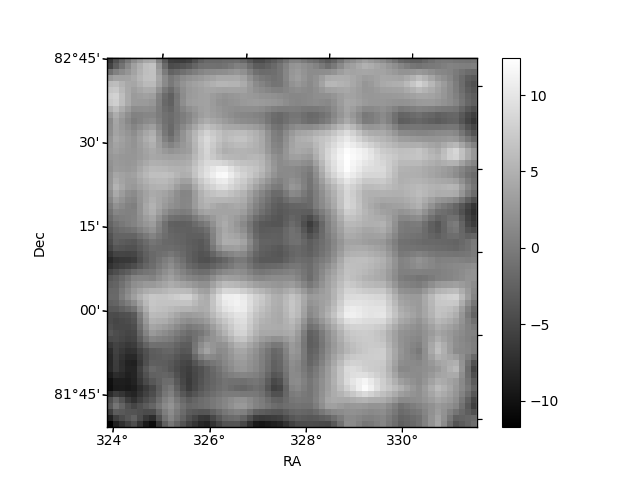
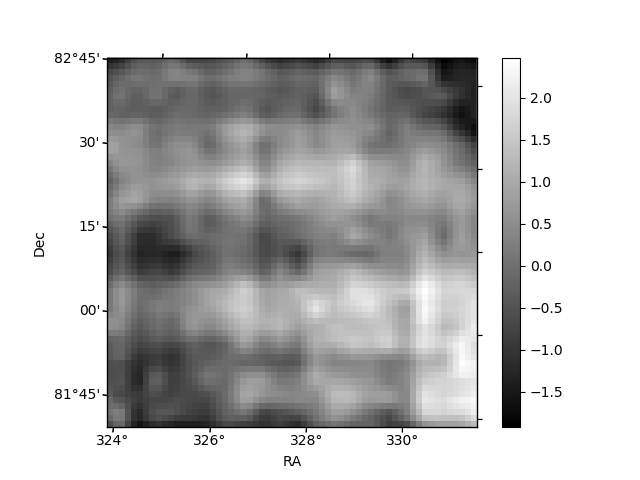
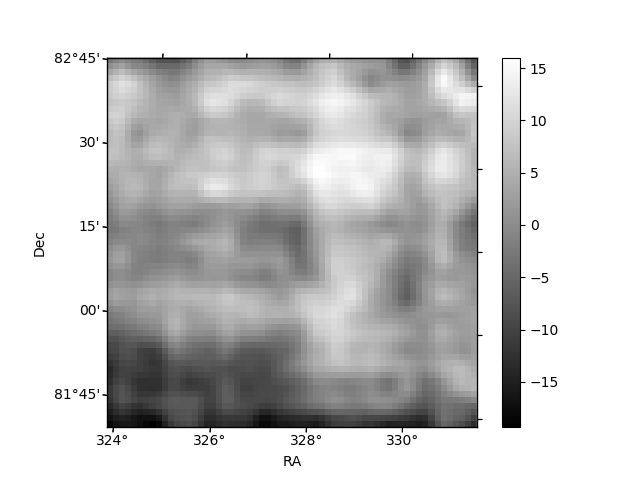
Histogram calculated using DETX and DETY for each event in the final _common_clean file
| Quadrant A | 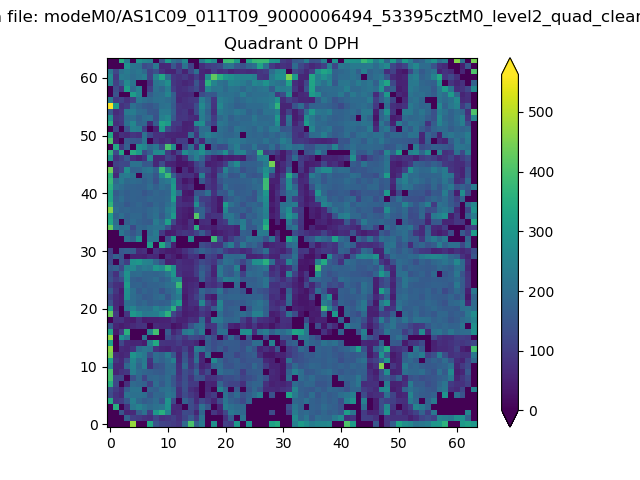 |
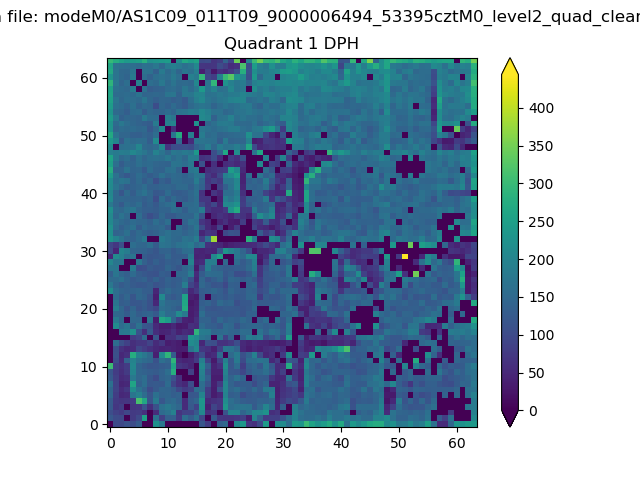 |
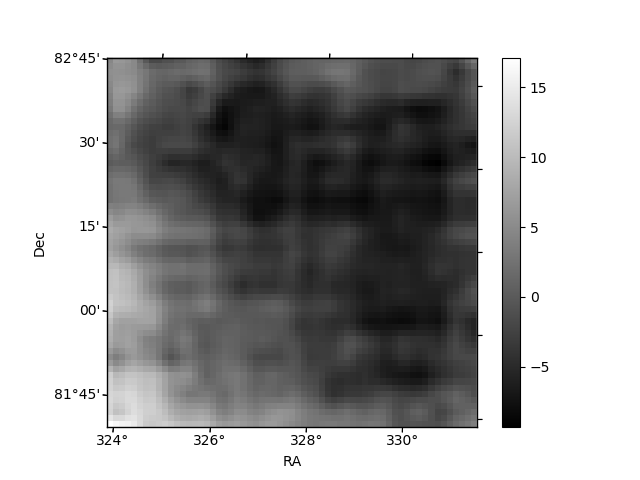
Quadrant B |
|---|---|---|---|
| Quadrant D | 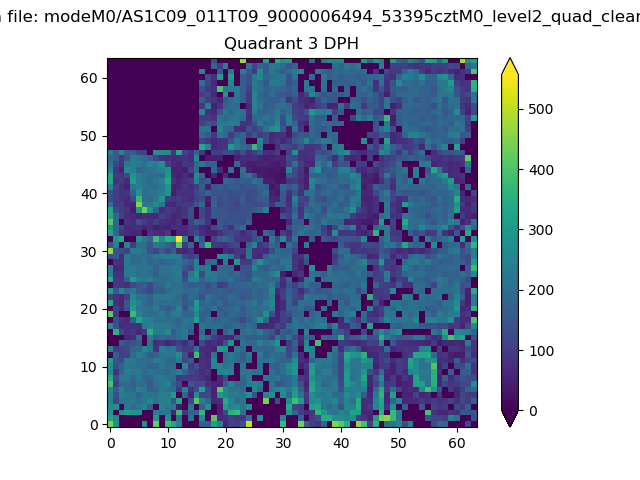 |
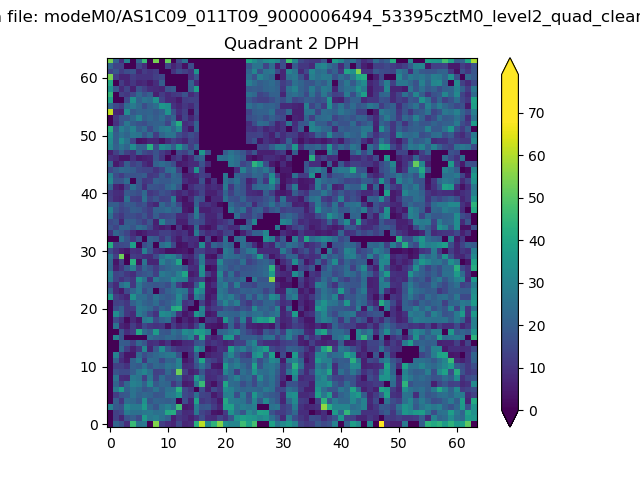 |
Quadrant C |
| Plot type | Count rate plots | Images |
|---|---|---|
| Comparison with Poisson distribution Blue bars denote a histogram of data divided into 1 sec bins. Red curve is a Poisson curve with rate = median count rate of data. |
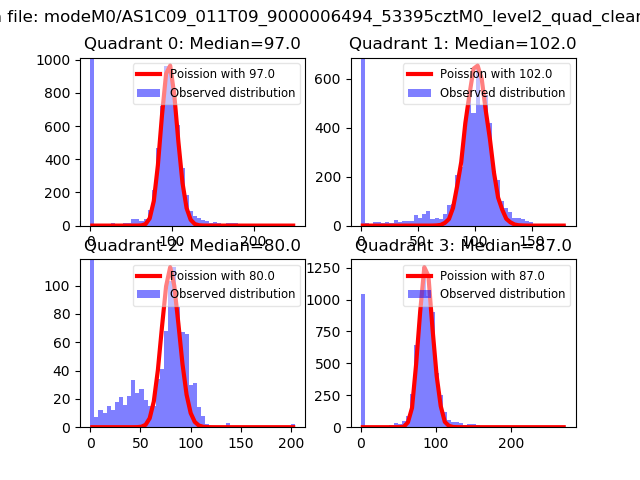 |
 |
| Quadrant-wise count rates Data is divided into 100 sec bins |
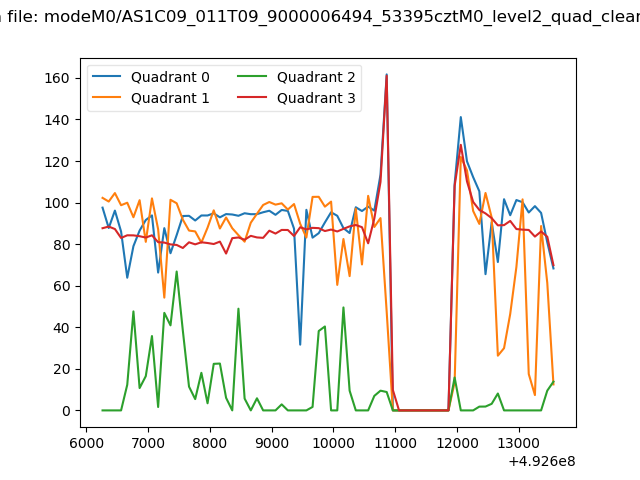 |
|
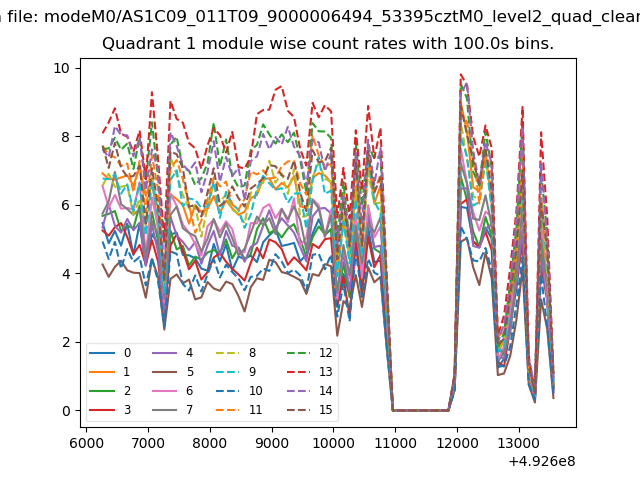
| Module-wise count rates for Quadrant A Data is divided into 100 sec bins |
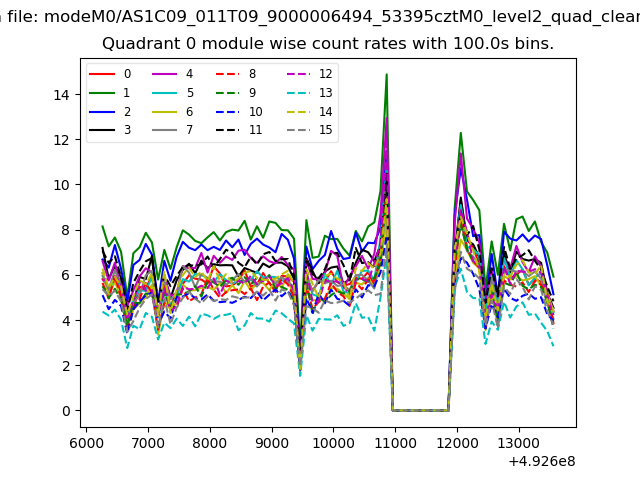 |
 |
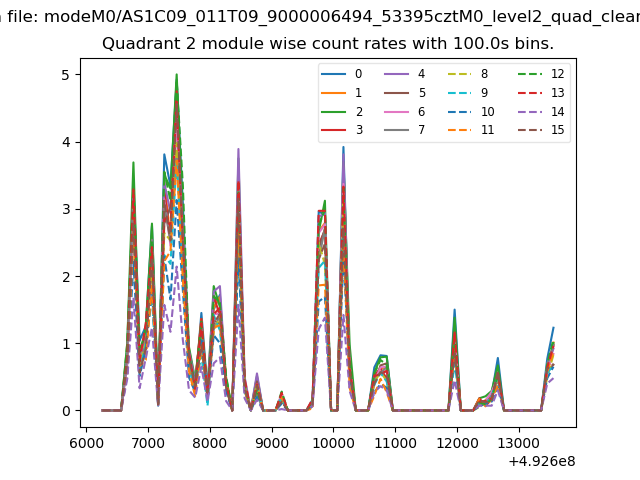
| Module-wise count rates for Quadrant B Data is divided into 100 sec bins |
 |
 |
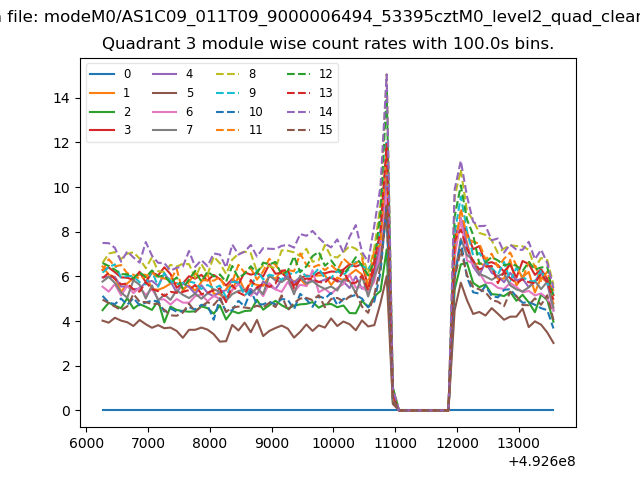
| Module-wise count rates for Quadrant C Data is divided into 100 sec bins |
 |
 |
| Module-wise count rates for Quadrant D Data is divided into 100 sec bins |
 |
 |
| Parameter | Plot |
|---|---|
| CZT HV Monitor | 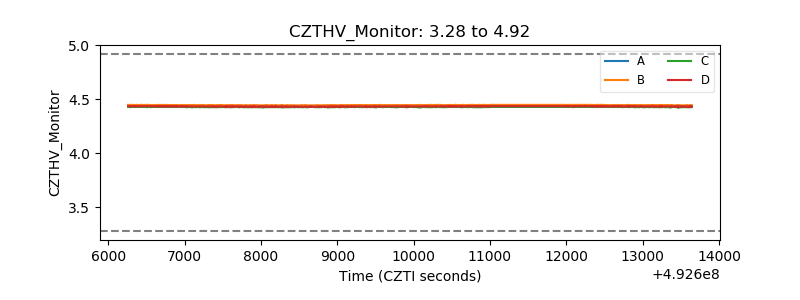 |
| D_VDD | 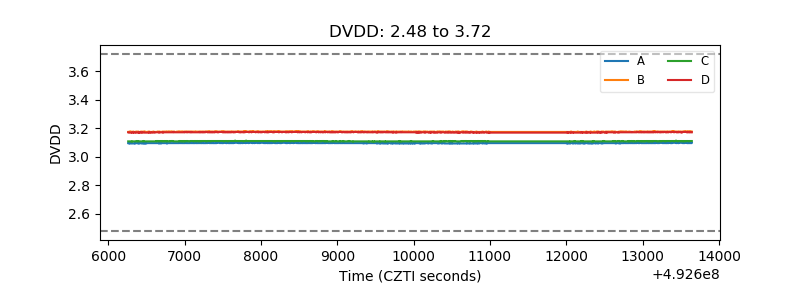 |
| Temperature 1 | 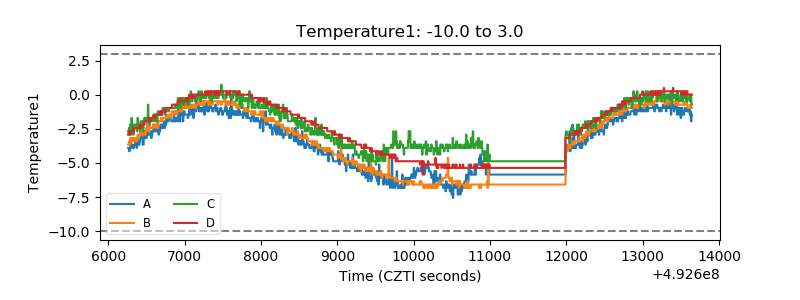 |
| Veto HV Monitor |  |
| Veto LLD | 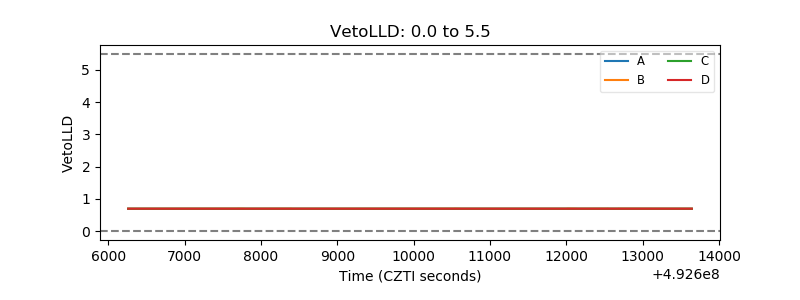 |
| Alpha Counter | 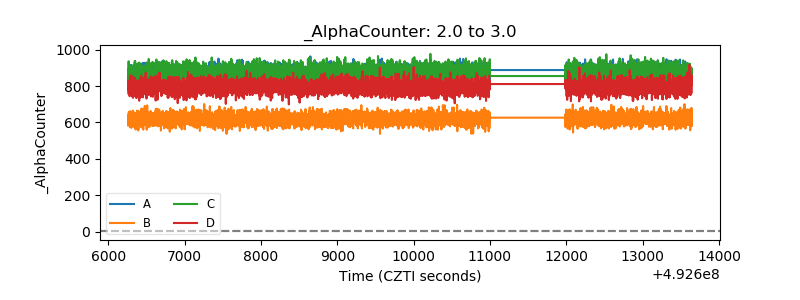 |
| _CPM_Rate | 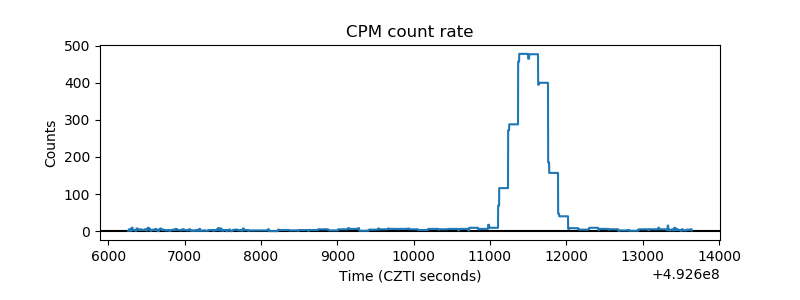 |
| CZT Counter | 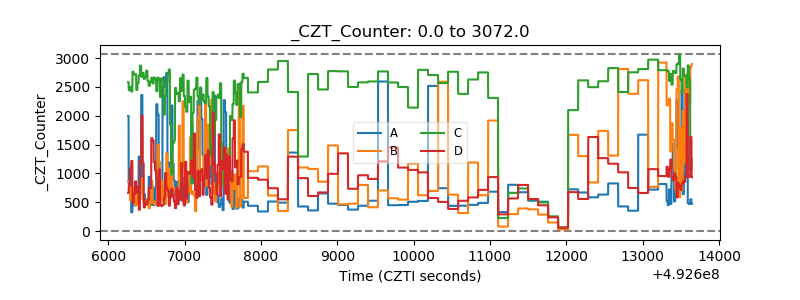 |
| +2.5 Volts monitor | 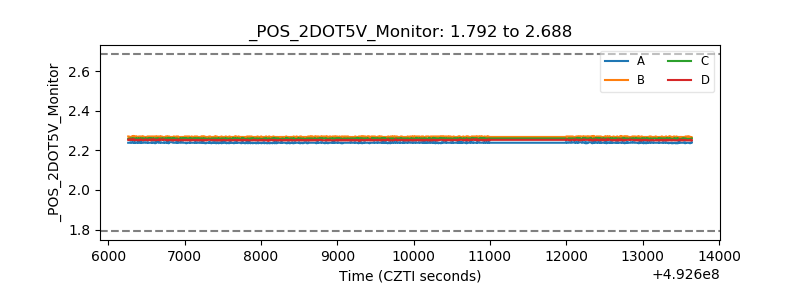 |
| +5 Volts monitor |  |
| _ROLL_ROT | 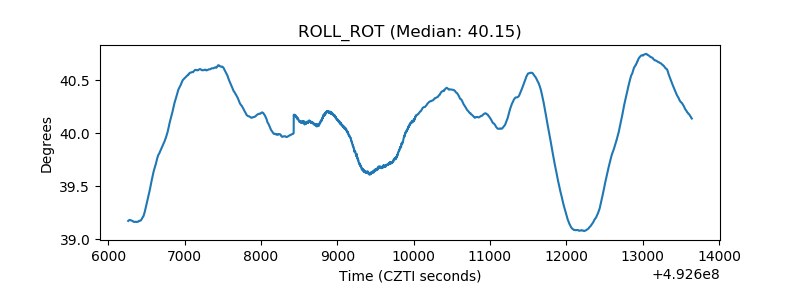 |
| _Roll_DEC | 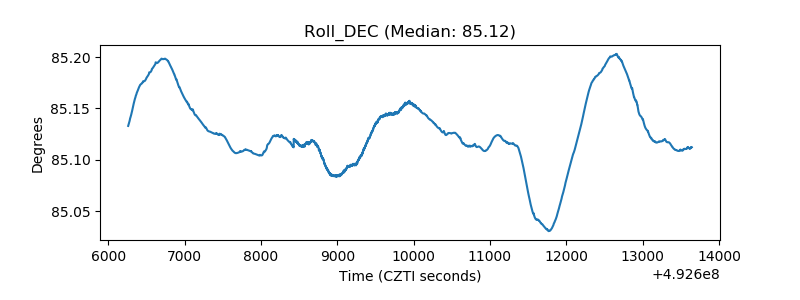 |
| _Roll_RA | 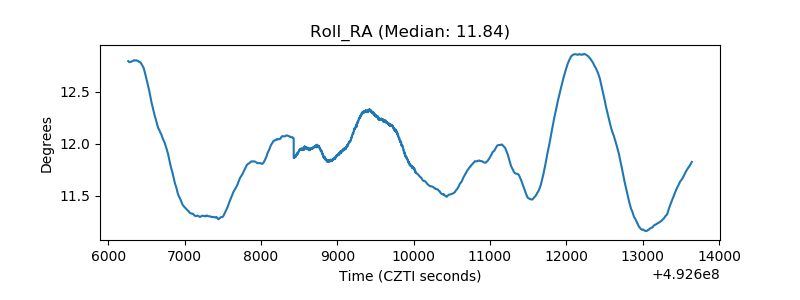 |
| Veto Counter |  |