| Param | Original file | Final file |
|---|---|---|
| Filename | modeM0/AS1C09_011T09_9000006494_53397cztM0_level2.fits | modeM0/AS1C09_011T09_9000006494_53397cztM0_level2_quad_clean.evt |
| Size (bytes) | 696,381,120 | 79,096,320 |
| Size | 664.1 MB | 75.4 MB |
| Events in quadrant A | 4,411,878 | 570,914 |
| Events in quadrant B | 5,202,585 | 584,076 |
| Events in quadrant C | 10,720,693 | 312,128 |
| Events in quadrant D | 4,985,197 | 514,962 |
| Mode SS | |||
|---|---|---|---|
| Quadrant | BADHDUFLAG | Total packets | Discarded packets |
| A | 0 | 120 | 0 |
| B | 0 | 120 | 0 |
| C | 0 | 120 | 0 |
| D | 0 | 120 | 0 |
| Mode M0 | |||
|---|---|---|---|
| Quadrant | BADHDUFLAG | Total packets | Discarded packets |
| A | 0 | 17234 | 1 |
| B | 0 | 19543 | 1 |
| C | 0 | 35935 | 1 |
| D | 0 | 18901 | 1 |
| Mode M9 | |||
|---|---|---|---|
| Quadrant | BADHDUFLAG | Total packets | Discarded packets |
| A | 0 | 11 | 0 |
| B | 0 | 11 | 0 |
| C | 0 | 11 | 0 |
| D | 0 | 11 | 0 |
| Quadrant | Total seconds | Saturated seconds | Saturation percentage |
|---|---|---|---|
| A | 5905 | 383 | 6.486029% |
| B | 5906 | 673 | 11.395191% |
| C | 5906 | 2992 | 50.660345% |
| D | 5906 | 347 | 5.875381% |
Noise dominated data is calculated using 1-second bins in cleaned event files. If a bin has >2000 counts, and if more than 50% of those come from <1% of pixels, then it is considered to be noise-dominated and hence unusable.
| Quadrant | # 1 sec bins | Bins with >0 counts | Bins with >2000 counts | High rate bins dominated by noise | Noise dominated (total time) | Noise dominated (detector-on time) | Marked lightcurve |
|---|---|---|---|---|---|---|---|
| A | 7065 | 5906 | 295 | 295 | 4.18% | 4.99% | 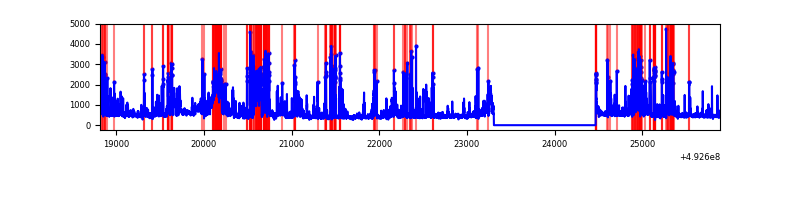 |
| B | 7066 | 5906 | 401 | 401 | 5.68% | 6.79% | 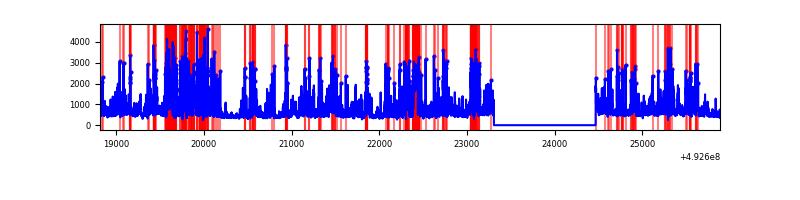 |
| C | 7066 | 5907 | 2595 | 2595 | 36.73% | 43.93% | 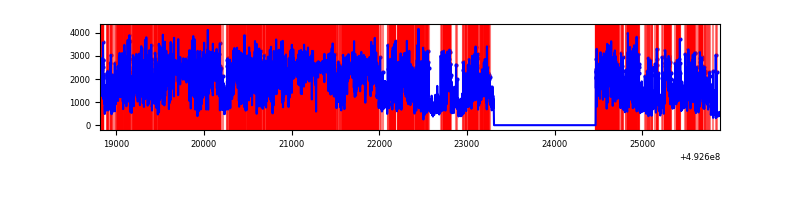 |
| D | 7066 | 5906 | 278 | 278 | 3.93% | 4.71% |  |
Top three noisy pixels from each quadrant. If the there are fewer than three noisy pixels in the level2.evt file, extra rows are filled as -1
| Pixel properties | Quadrant properties | ||||||
|---|---|---|---|---|---|---|---|
| Quadrant | DetID | PixID | Counts | Sigma | Mean | Median | Sigma |
| A | 15 | 174 | 1089179 | 7150.54 | 620 | 605 | 152.2 |
| A | 3 | 63 | 242833 | 1591.13 | 620 | 605 | 152.2 |
| A | 4 | 249 | 153967 | 1007.39 | 620 | 605 | 152.2 |
| B | 4 | 171 | 1176823 | 9340.6 | 602 | 583 | 125.9 |
| B | 2 | 249 | 923039 | 7325.28 | 602 | 583 | 125.9 |
| B | 4 | 206 | 120144 | 949.44 | 602 | 583 | 125.9 |
| C | 15 | 178 | 5665090 | 41953.07 | 492 | 487 | 135.0 |
| C | 15 | 224 | 1347360 | 9975.19 | 492 | 487 | 135.0 |
| C | 1 | 241 | 308564 | 2281.67 | 492 | 487 | 135.0 |
| D | 0 | 18 | 1284070 | 7444.76 | 608 | 582 | 172.4 |
| D | 3 | 12 | 351468 | 2035.28 | 608 | 582 | 172.4 |
| D | 8 | 176 | 298750 | 1729.5 | 608 | 582 | 172.4 |
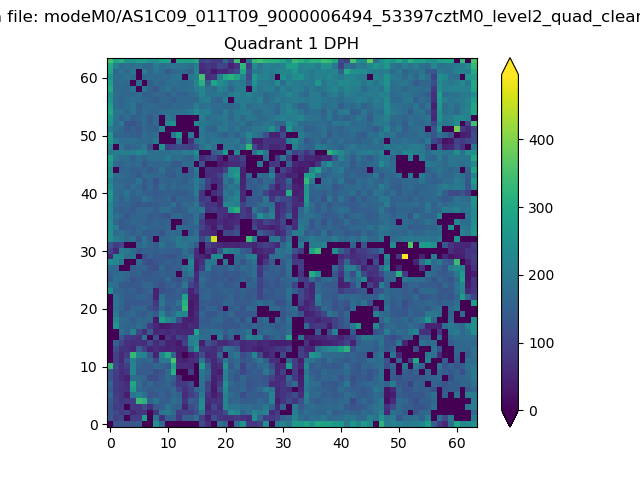
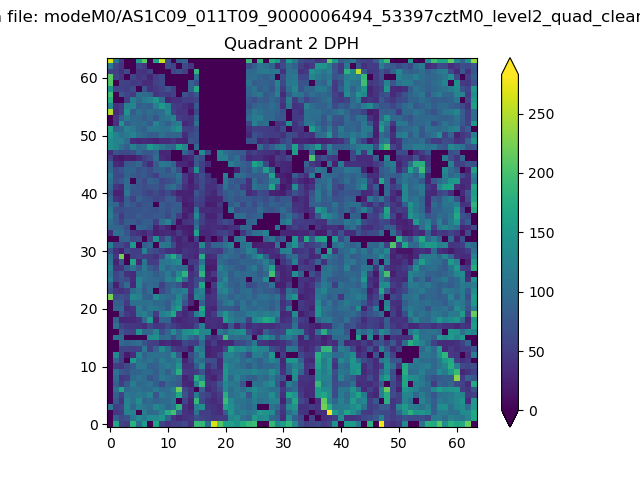
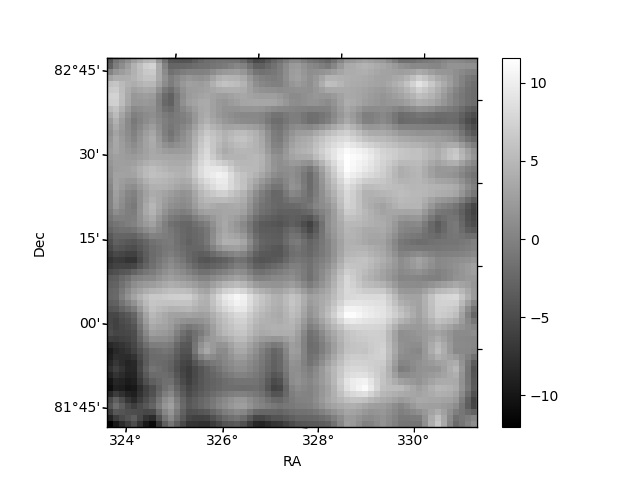
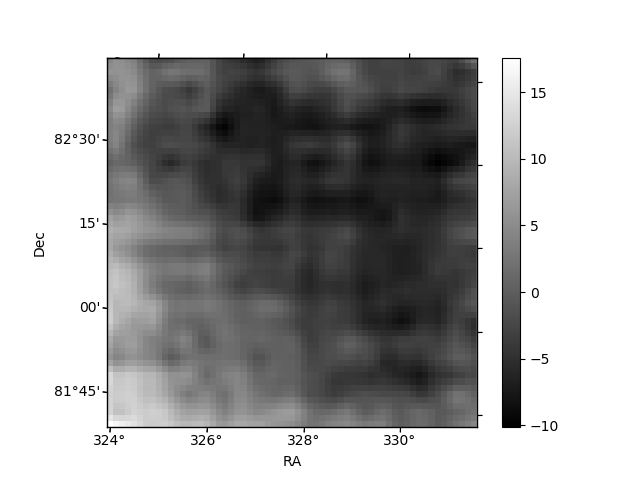
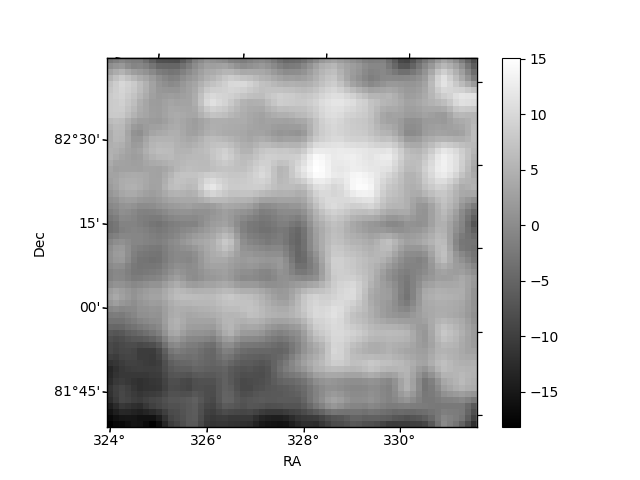
Histogram calculated using DETX and DETY for each event in the final _common_clean file
| Quadrant A | 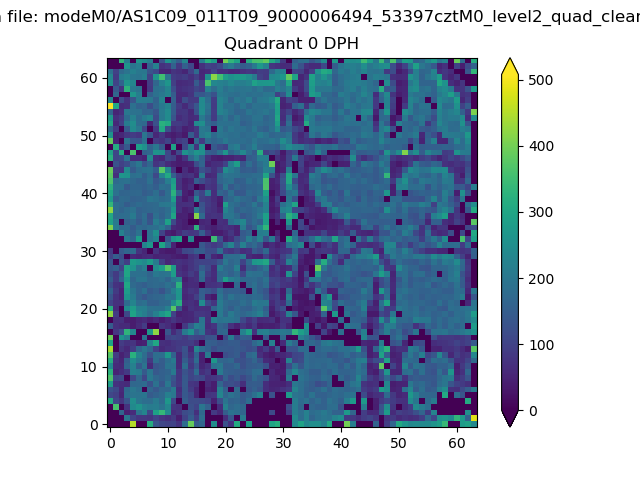 |
 |
Quadrant B |
|---|---|---|---|
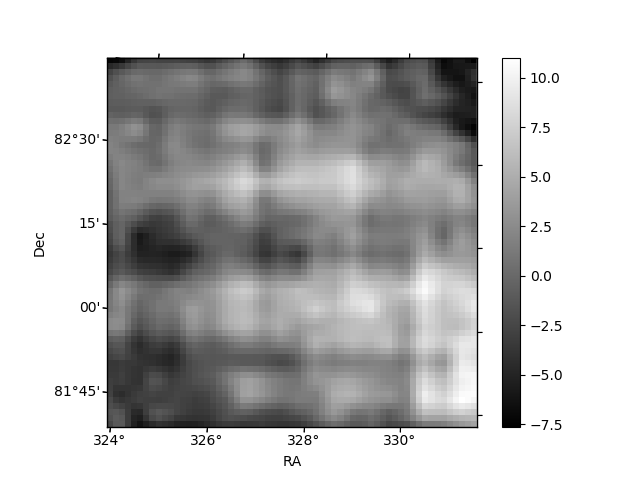
| Quadrant D | 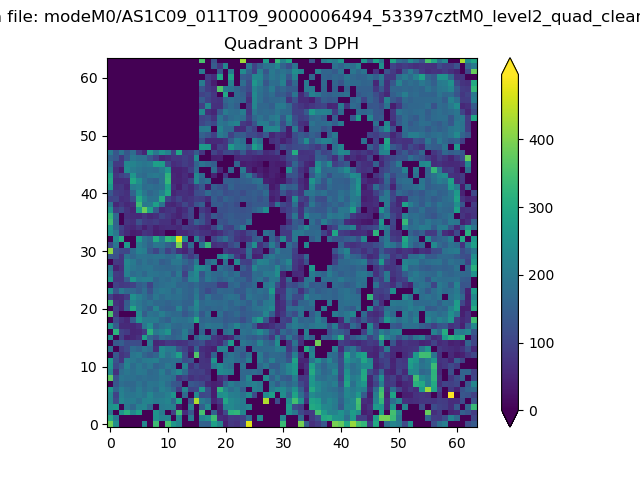 |
 |
Quadrant C |
| Plot type | Count rate plots | Images |
|---|---|---|
| Comparison with Poisson distribution Blue bars denote a histogram of data divided into 1 sec bins. Red curve is a Poisson curve with rate = median count rate of data. |
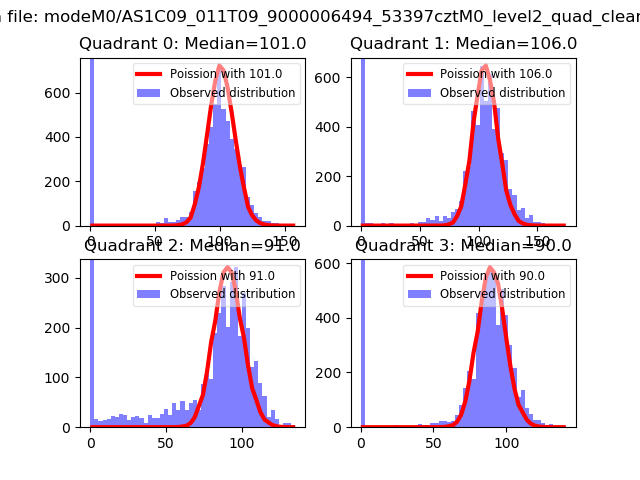 |
 |
| Quadrant-wise count rates Data is divided into 100 sec bins |
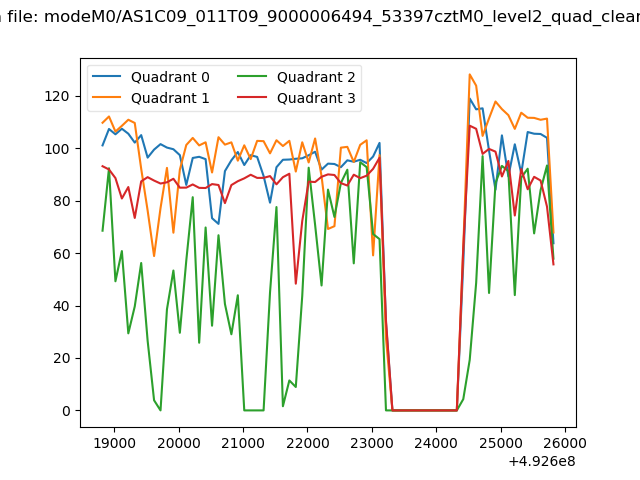 |
|
| Module-wise count rates for Quadrant A Data is divided into 100 sec bins |
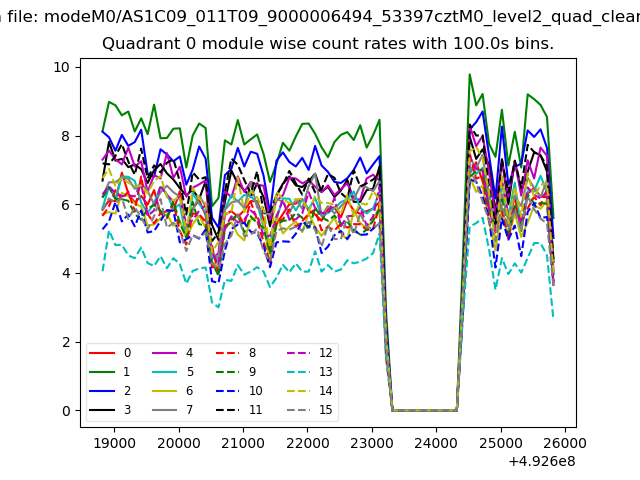 |
 |
| Module-wise count rates for Quadrant B Data is divided into 100 sec bins |
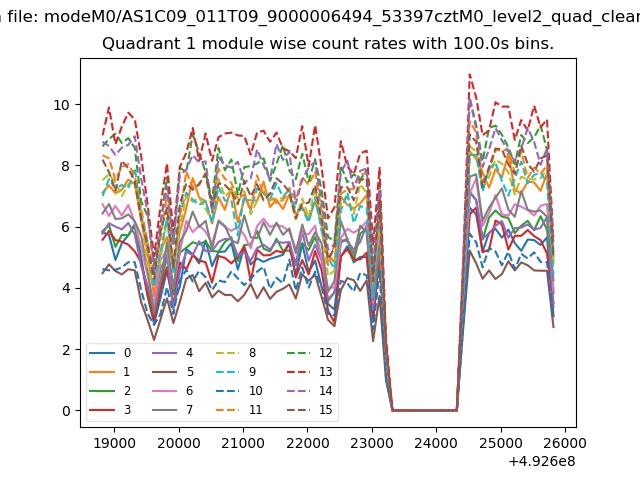 |
 |
| Module-wise count rates for Quadrant C Data is divided into 100 sec bins |
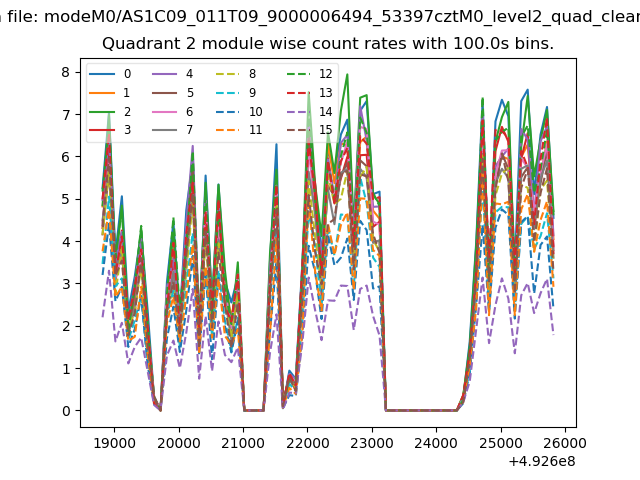 |
 |
| Module-wise count rates for Quadrant D Data is divided into 100 sec bins |
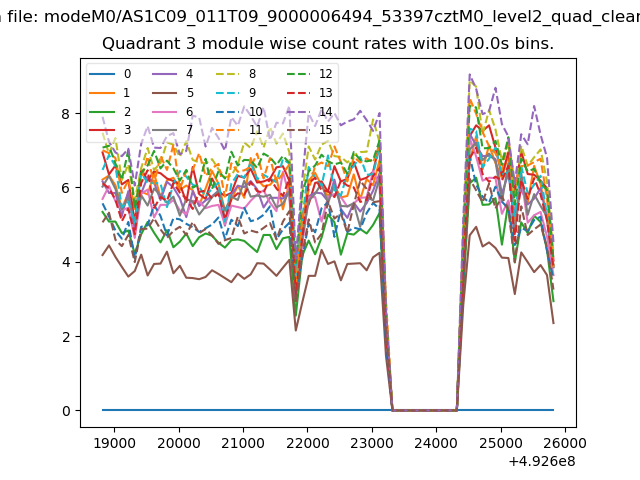 |
 |
| Parameter | Plot |
|---|---|
| CZT HV Monitor | 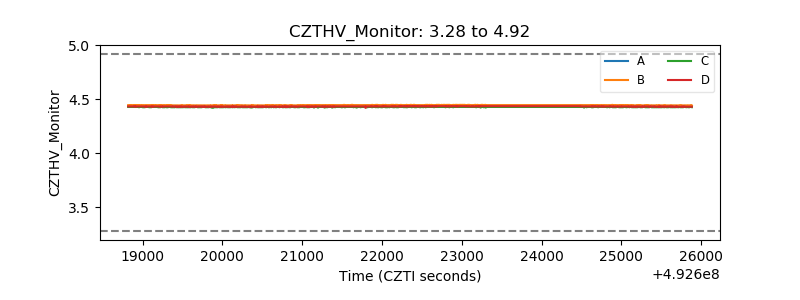 |
| D_VDD | 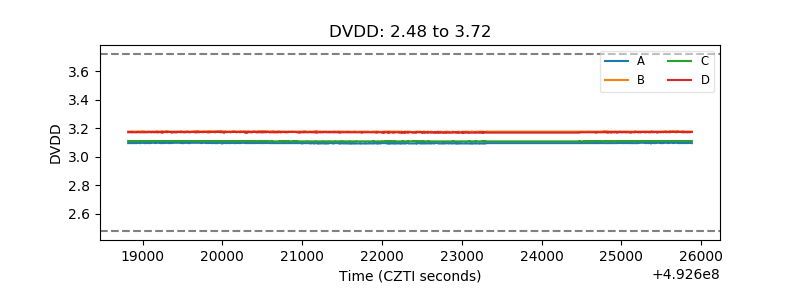 |
| Temperature 1 | 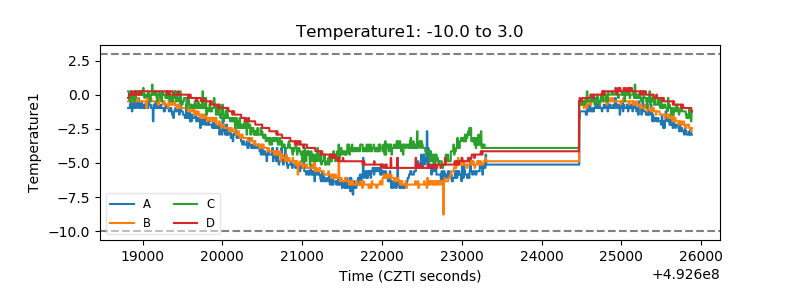 |
| Veto HV Monitor | 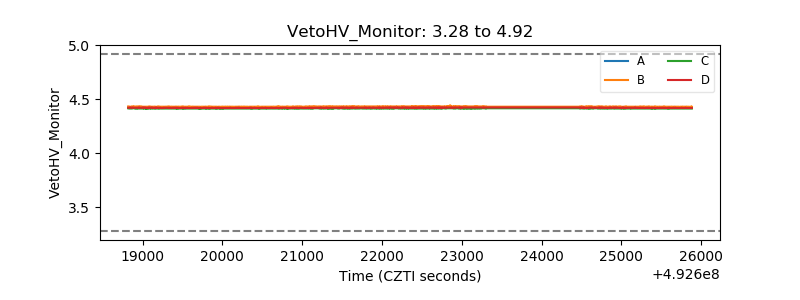 |
| Veto LLD | 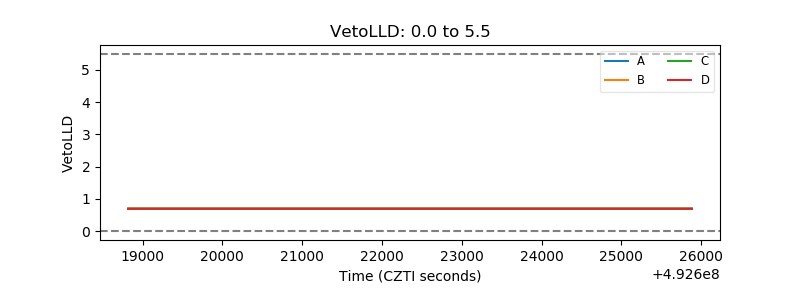 |
| Alpha Counter |  |
| _CPM_Rate | 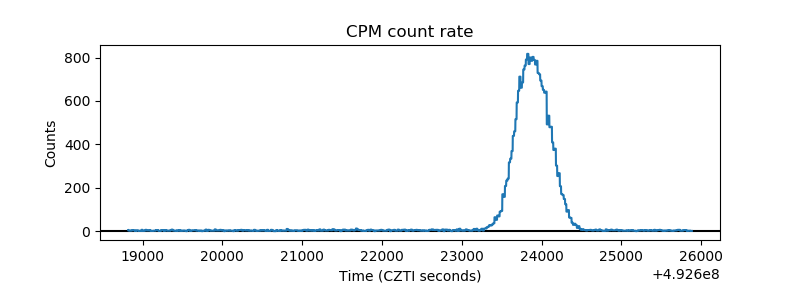 |
| CZT Counter | 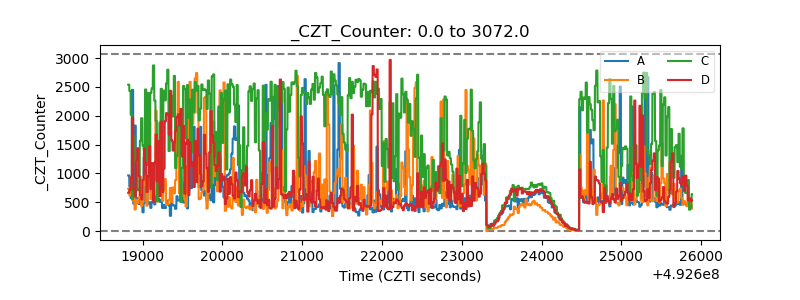 |
| +2.5 Volts monitor | 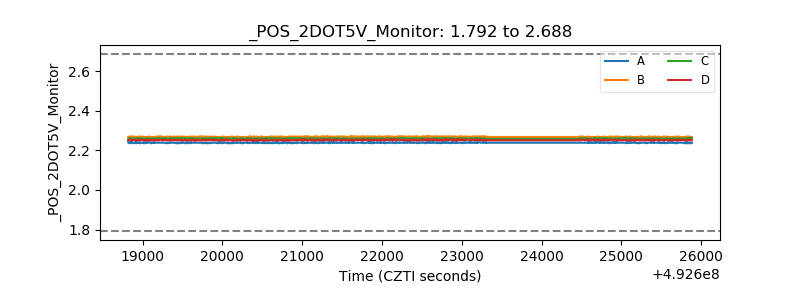 |
| +5 Volts monitor | 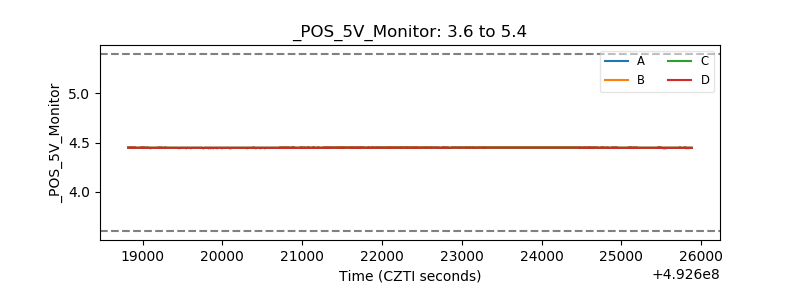 |
| _ROLL_ROT | 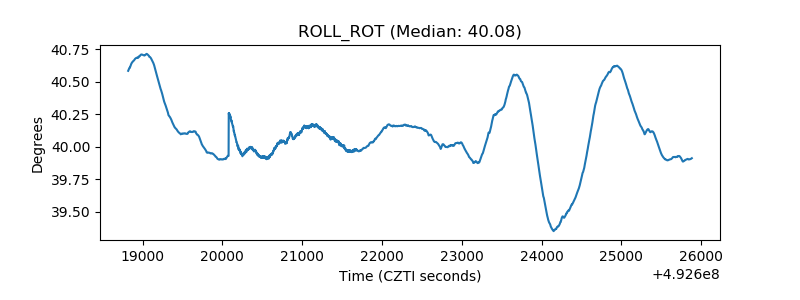 |
| _Roll_DEC | 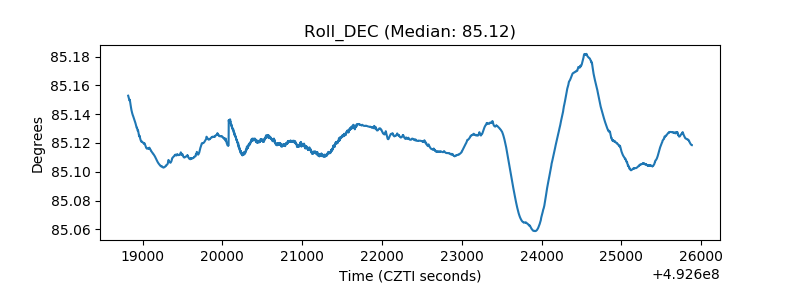 |
| _Roll_RA | 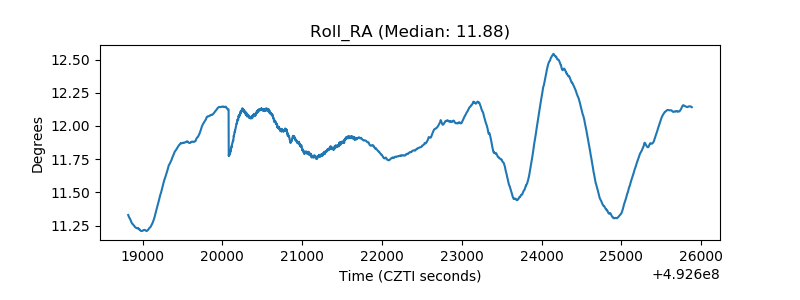 |
| Veto Counter | 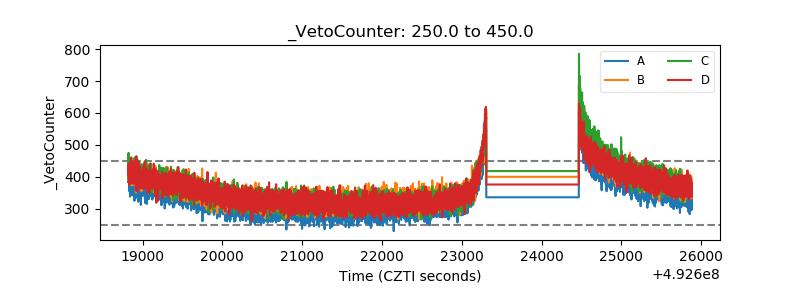 |