| Param | Original file | Final file |
|---|---|---|
| Filename | modeM0/AS1C09_011T09_9000006494_53398cztM0_level2.fits | modeM0/AS1C09_011T09_9000006494_53398cztM0_level2_quad_clean.evt |
| Size (bytes) | 710,614,080 | 89,187,840 |
| Size | 677.7 MB | 85.1 MB |
| Events in quadrant A | 4,938,482 | 601,307 |
| Events in quadrant B | 5,847,754 | 644,571 |
| Events in quadrant C | 8,874,300 | 477,109 |
| Events in quadrant D | 6,151,547 | 532,478 |
| Mode SS | |||
|---|---|---|---|
| Quadrant | BADHDUFLAG | Total packets | Discarded packets |
| A | 0 | 130 | 0 |
| B | 0 | 130 | 0 |
| C | 0 | 130 | 0 |
| D | 0 | 130 | 0 |
| Mode M0 | |||
|---|---|---|---|
| Quadrant | BADHDUFLAG | Total packets | Discarded packets |
| A | 0 | 19057 | 2 |
| B | 0 | 21793 | 2 |
| C | 0 | 30844 | 2 |
| D | 0 | 22651 | 2 |
| Mode M9 | |||
|---|---|---|---|
| Quadrant | BADHDUFLAG | Total packets | Discarded packets |
| A | 0 | 12 | 0 |
| B | 0 | 13 | 0 |
| C | 0 | 13 | 0 |
| D | 0 | 13 | 0 |
| Quadrant | Total seconds | Saturated seconds | Saturation percentage |
|---|---|---|---|
| A | 6371 | 603 | 9.464762% |
| B | 6371 | 714 | 11.207032% |
| C | 6371 | 1739 | 27.295558% |
| D | 6371 | 659 | 10.343745% |
Noise dominated data is calculated using 1-second bins in cleaned event files. If a bin has >2000 counts, and if more than 50% of those come from <1% of pixels, then it is considered to be noise-dominated and hence unusable.
| Quadrant | # 1 sec bins | Bins with >0 counts | Bins with >2000 counts | High rate bins dominated by noise | Noise dominated (total time) | Noise dominated (detector-on time) | Marked lightcurve |
|---|---|---|---|---|---|---|---|
| A | 7551 | 6372 | 484 | 484 | 6.41% | 7.60% | 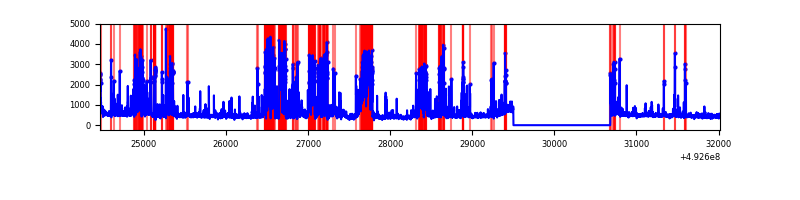 |
| B | 7551 | 6372 | 451 | 451 | 5.97% | 7.08% | 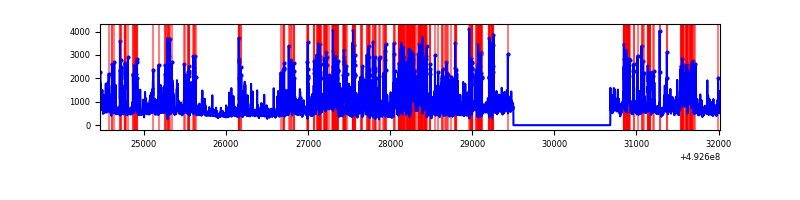 |
| C | 7550 | 6371 | 1457 | 1457 | 19.30% | 22.87% | 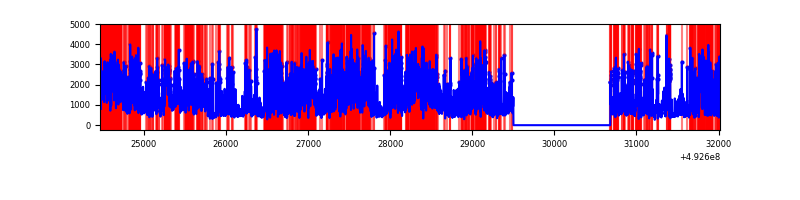 |
| D | 7551 | 6372 | 601 | 601 | 7.96% | 9.43% | 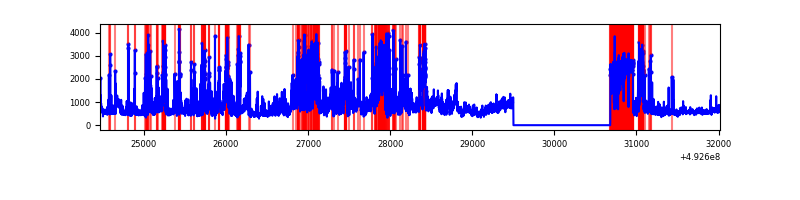 |
Top three noisy pixels from each quadrant. If the there are fewer than three noisy pixels in the level2.evt file, extra rows are filled as -1
| Pixel properties | Quadrant properties | ||||||
|---|---|---|---|---|---|---|---|
| Quadrant | DetID | PixID | Counts | Sigma | Mean | Median | Sigma |
| A | 8 | 249 | 1046503 | 6386.43 | 665 | 650 | 163.8 |
| A | 15 | 174 | 353293 | 2153.39 | 665 | 650 | 163.8 |
| A | 3 | 62 | 275260 | 1676.89 | 665 | 650 | 163.8 |
| B | 2 | 249 | 1231520 | 8789.44 | 664 | 640 | 140.0 |
| B | 4 | 171 | 783460 | 5589.94 | 664 | 640 | 140.0 |
| B | 4 | 206 | 242784 | 1729.1 | 664 | 640 | 140.0 |
| C | 15 | 224 | 2280931 | 13843.48 | 604 | 599 | 164.7 |
| C | 15 | 178 | 1659016 | 10067.95 | 604 | 599 | 164.7 |
| C | 14 | 80 | 535992 | 3250.27 | 604 | 599 | 164.7 |
| D | 8 | 176 | 1664796 | 9205.3 | 639 | 611 | 180.8 |
| D | 0 | 18 | 906638 | 5011.61 | 639 | 611 | 180.8 |
| D | 3 | 12 | 354202 | 1955.86 | 639 | 611 | 180.8 |
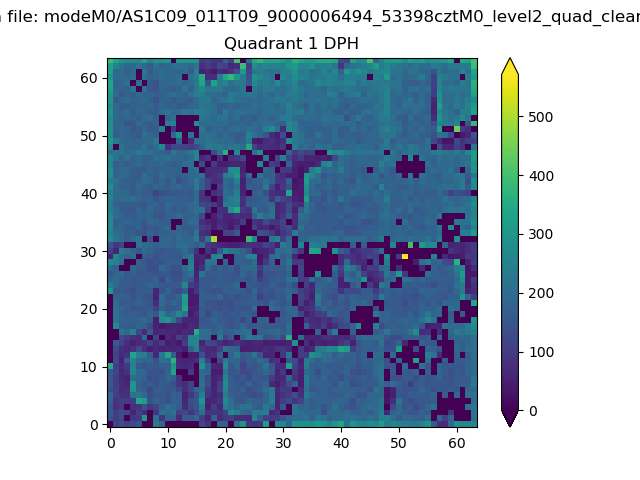
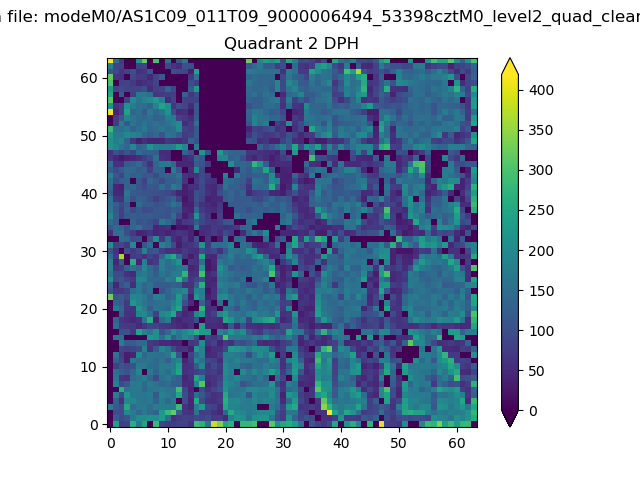
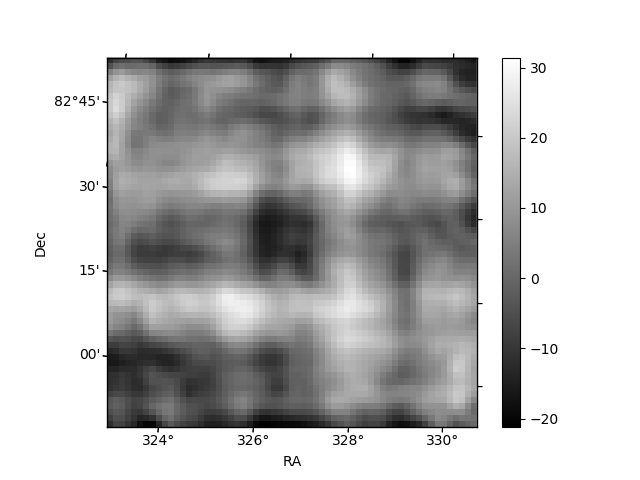
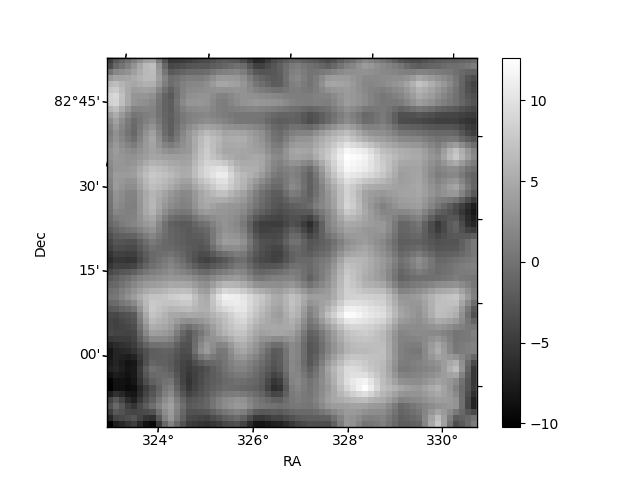
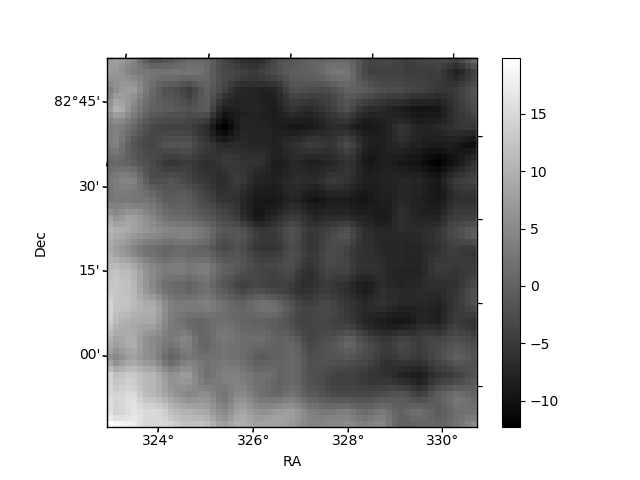
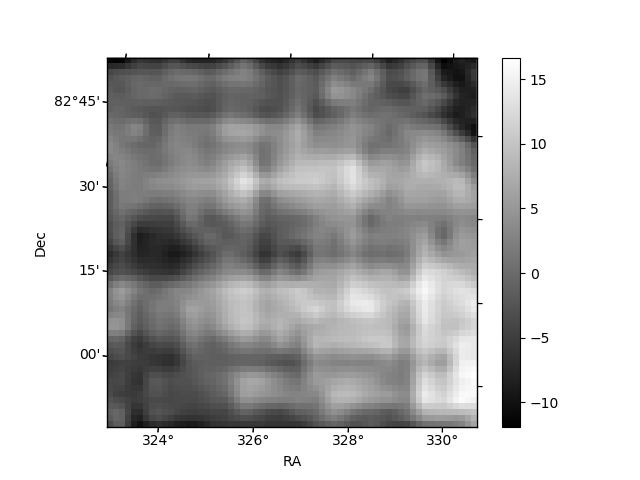
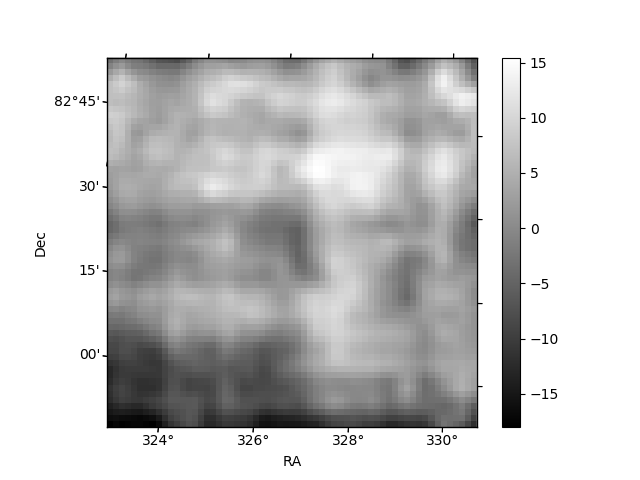
Histogram calculated using DETX and DETY for each event in the final _common_clean file
| Quadrant A |  |
 |
Quadrant B |
|---|---|---|---|
| Quadrant D | 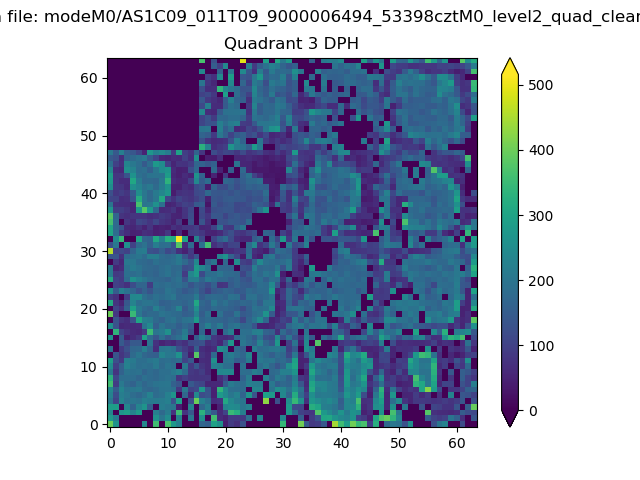 |
 |
Quadrant C |
| Plot type | Count rate plots | Images |
|---|---|---|
| Comparison with Poisson distribution Blue bars denote a histogram of data divided into 1 sec bins. Red curve is a Poisson curve with rate = median count rate of data. |
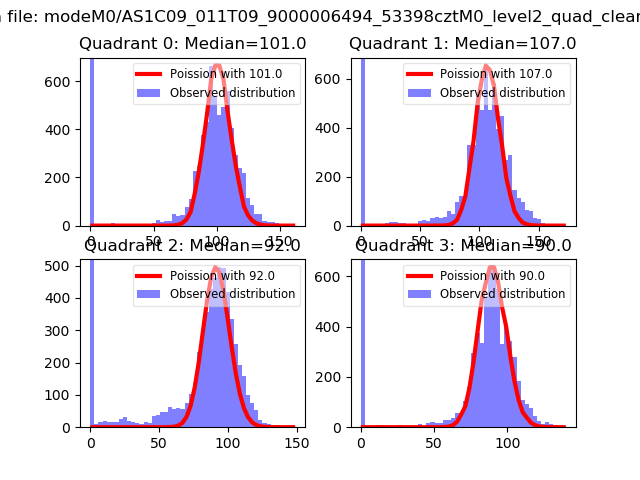 |
 |
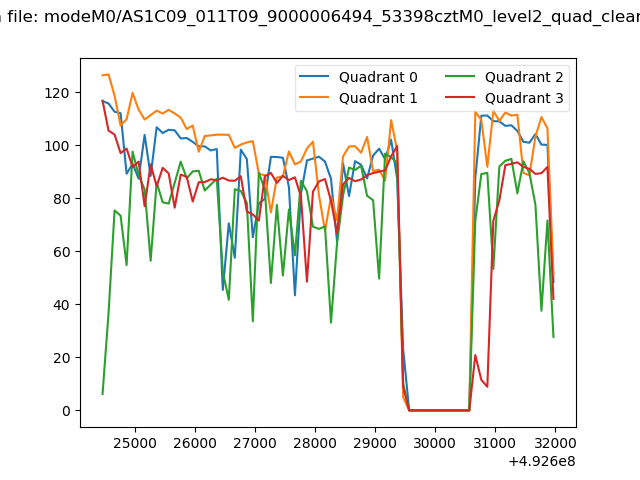
| Quadrant-wise count rates Data is divided into 100 sec bins |
 |
|
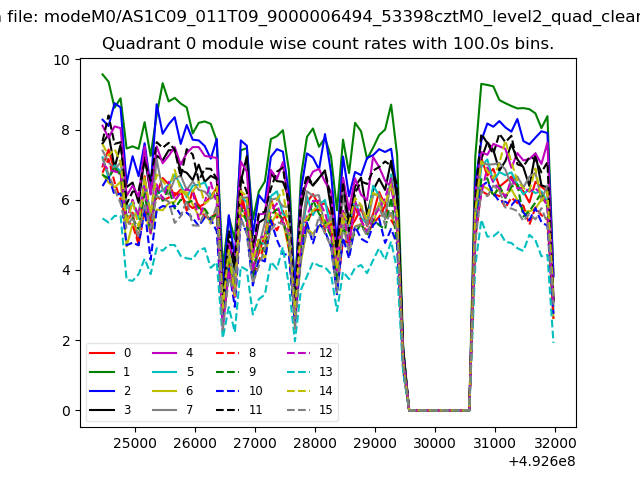
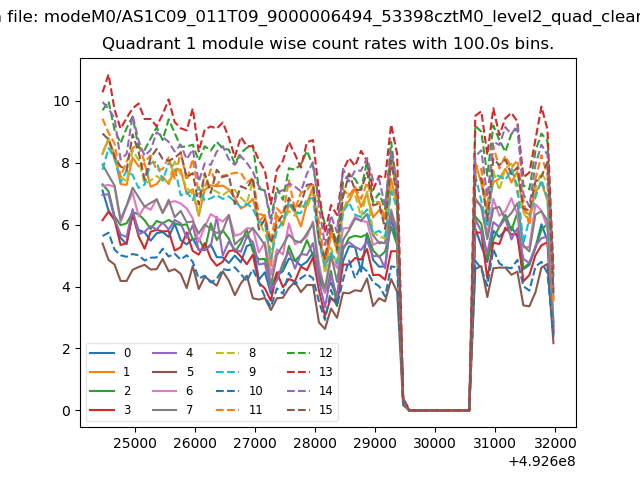
| Module-wise count rates for Quadrant A Data is divided into 100 sec bins |
 |
 |
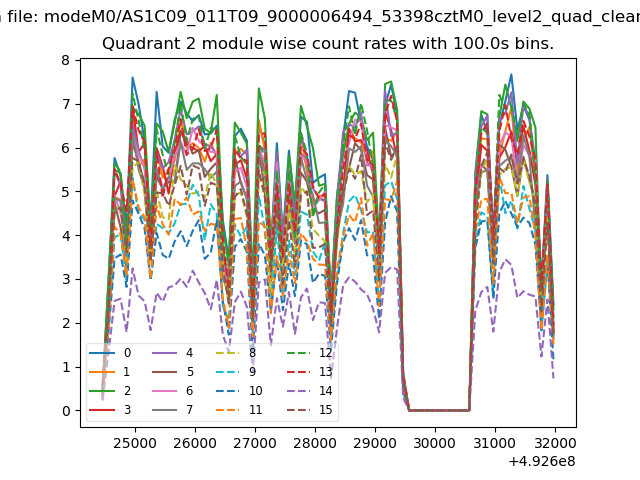
| Module-wise count rates for Quadrant B Data is divided into 100 sec bins |
 |
 |
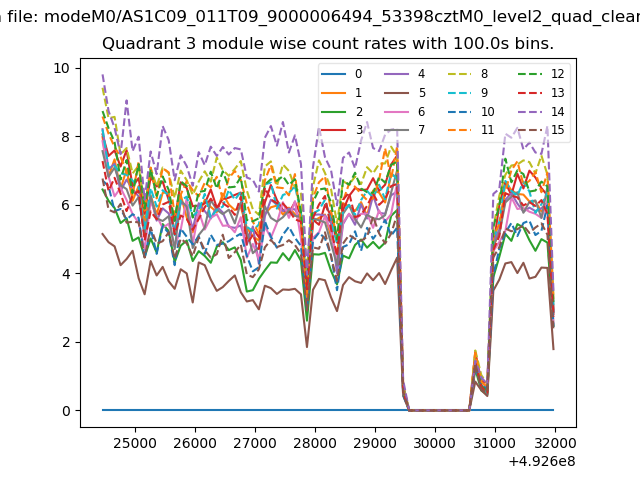
| Module-wise count rates for Quadrant C Data is divided into 100 sec bins |
 |
 |
| Module-wise count rates for Quadrant D Data is divided into 100 sec bins |
 |
 |
| Parameter | Plot |
|---|---|
| CZT HV Monitor | 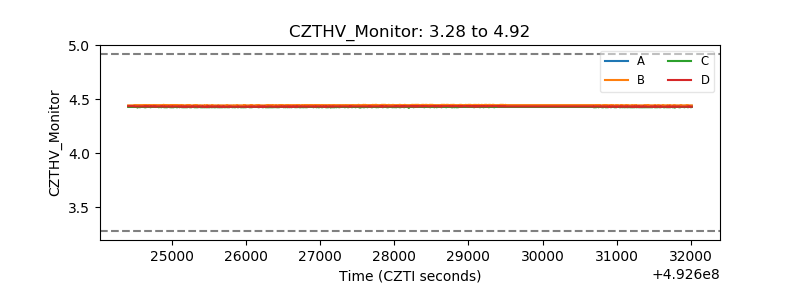 |
| D_VDD | 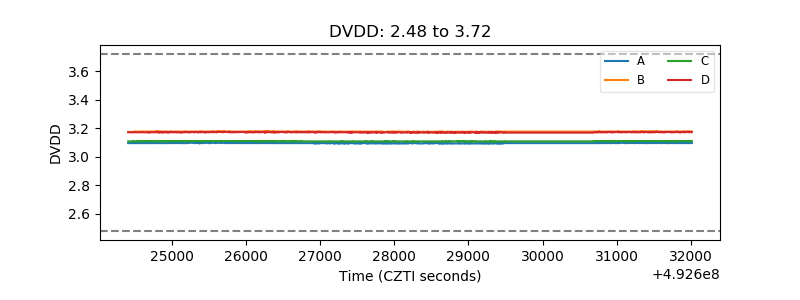 |
| Temperature 1 | 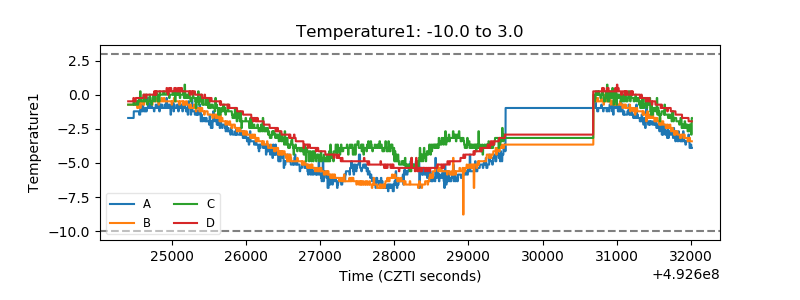 |
| Veto HV Monitor | 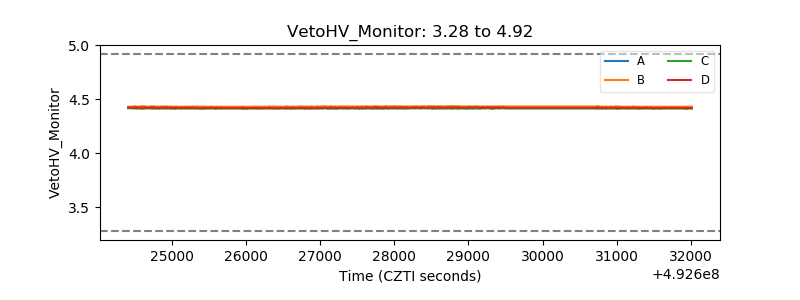 |
| Veto LLD | 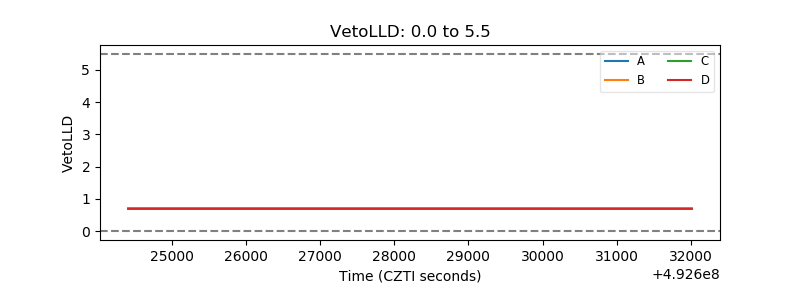 |
| Alpha Counter | 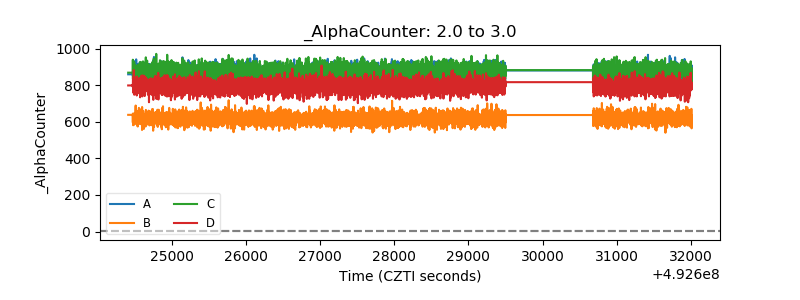 |
| _CPM_Rate | 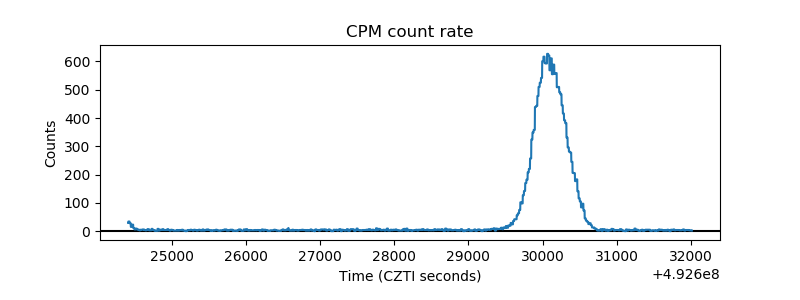 |
| CZT Counter | 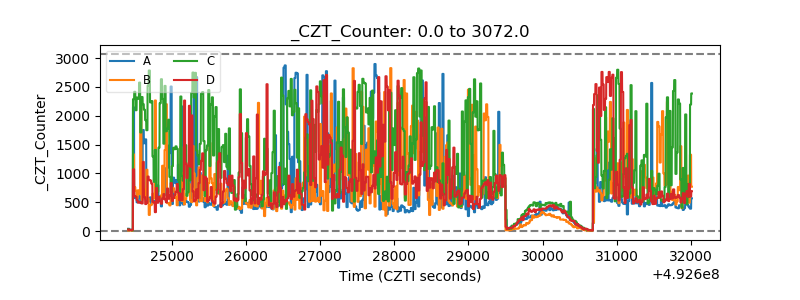 |
| +2.5 Volts monitor | 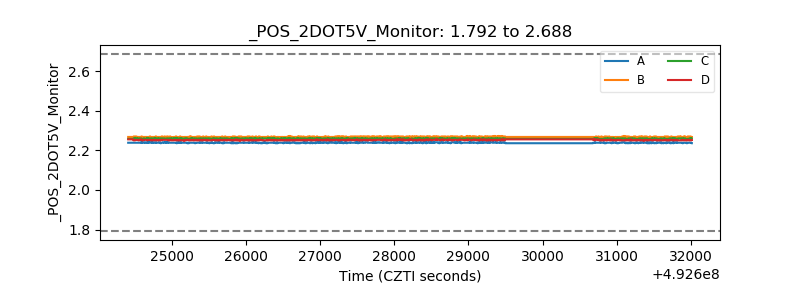 |
| +5 Volts monitor |  |
| _ROLL_ROT | 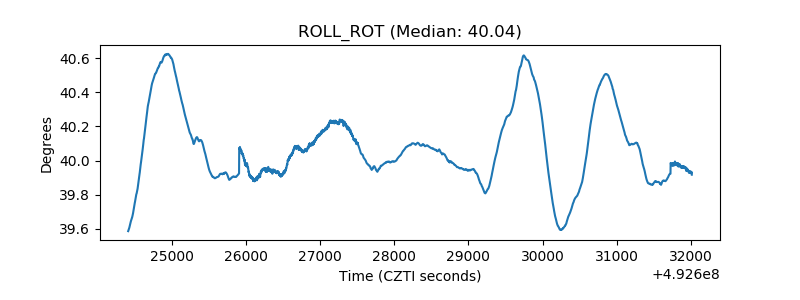 |
| _Roll_DEC | 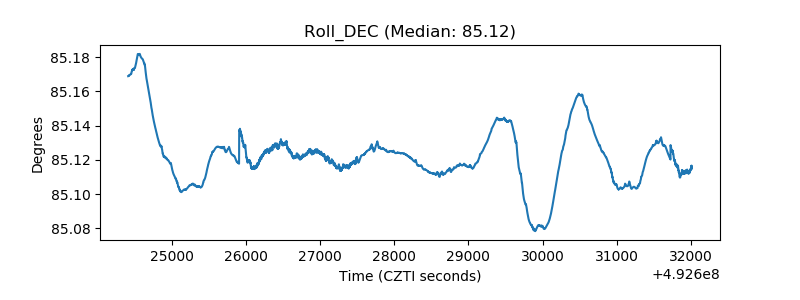 |
| _Roll_RA | 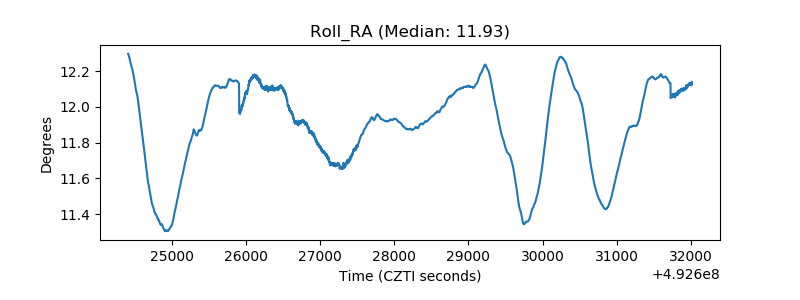 |
| Veto Counter |  |