| Param | Original file | Final file |
|---|---|---|
| Filename | modeM0/AS1C09_011T09_9000006494_53399cztM0_level2.fits | modeM0/AS1C09_011T09_9000006494_53399cztM0_level2_quad_clean.evt |
| Size (bytes) | 686,629,440 | 87,586,560 |
| Size | 654.8 MB | 83.5 MB |
| Events in quadrant A | 3,867,861 | 611,565 |
| Events in quadrant B | 6,847,084 | 594,655 |
| Events in quadrant C | 8,910,344 | 447,677 |
| Events in quadrant D | 5,292,666 | 548,117 |
| Mode SS | |||
|---|---|---|---|
| Quadrant | BADHDUFLAG | Total packets | Discarded packets |
| A | 0 | 132 | 0 |
| B | 0 | 132 | 0 |
| C | 0 | 132 | 0 |
| D | 0 | 132 | 0 |
| Mode M0 | |||
|---|---|---|---|
| Quadrant | BADHDUFLAG | Total packets | Discarded packets |
| A | 0 | 16232 | 1 |
| B | 0 | 24904 | 1 |
| C | 0 | 30904 | 1 |
| D | 0 | 20225 | 1 |
| Mode M9 | |||
|---|---|---|---|
| Quadrant | BADHDUFLAG | Total packets | Discarded packets |
| A | 0 | 10 | 0 |
| B | 0 | 10 | 0 |
| C | 0 | 10 | 0 |
| D | 0 | 10 | 0 |
| Quadrant | Total seconds | Saturated seconds | Saturation percentage |
|---|---|---|---|
| A | 6442 | 311 | 4.827693% |
| B | 6442 | 1049 | 16.283763% |
| C | 6443 | 1983 | 30.777588% |
| D | 6443 | 360 | 5.587459% |
Noise dominated data is calculated using 1-second bins in cleaned event files. If a bin has >2000 counts, and if more than 50% of those come from <1% of pixels, then it is considered to be noise-dominated and hence unusable.
| Quadrant | # 1 sec bins | Bins with >0 counts | Bins with >2000 counts | High rate bins dominated by noise | Noise dominated (total time) | Noise dominated (detector-on time) | Marked lightcurve |
|---|---|---|---|---|---|---|---|
| A | 7502 | 6443 | 203 | 203 | 2.71% | 3.15% | 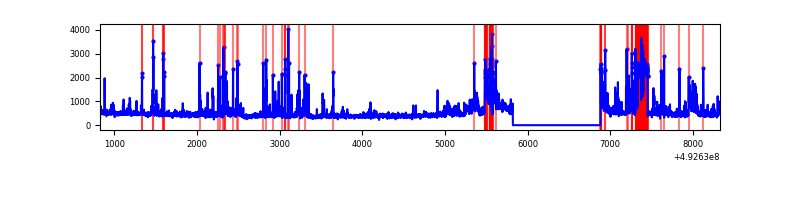 |
| B | 7502 | 6442 | 623 | 623 | 8.30% | 9.67% | 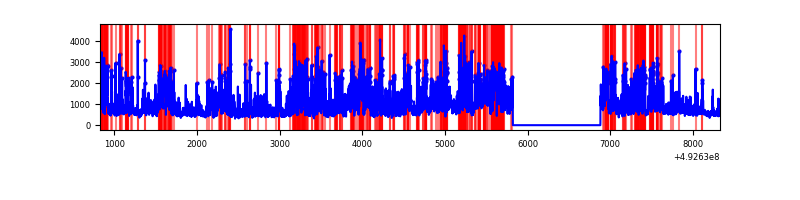 |
| C | 7502 | 6443 | 1639 | 1639 | 21.85% | 25.44% | 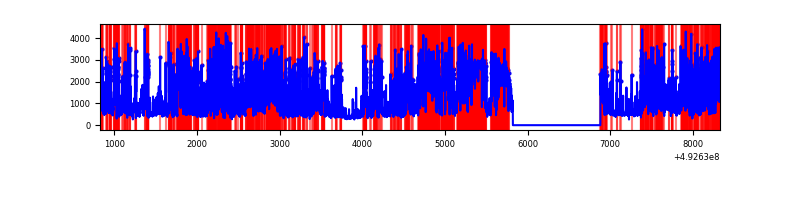 |
| D | 7503 | 6444 | 322 | 322 | 4.29% | 5.00% |  |
Top three noisy pixels from each quadrant. If the there are fewer than three noisy pixels in the level2.evt file, extra rows are filled as -1
| Pixel properties | Quadrant properties | ||||||
|---|---|---|---|---|---|---|---|
| Quadrant | DetID | PixID | Counts | Sigma | Mean | Median | Sigma |
| A | 15 | 174 | 704178 | 4287.97 | 665 | 649 | 164.1 |
| A | 3 | 27 | 116539 | 706.34 | 665 | 649 | 164.1 |
| A | 7 | 191 | 100793 | 610.37 | 665 | 649 | 164.1 |
| B | 2 | 249 | 1319065 | 9833.79 | 639 | 618 | 134.1 |
| B | 4 | 171 | 1166949 | 8699.21 | 639 | 618 | 134.1 |
| B | 10 | 28 | 556596 | 4146.82 | 639 | 618 | 134.1 |
| C | 15 | 224 | 2814155 | 17934.6 | 575 | 570 | 156.9 |
| C | 1 | 241 | 1582650 | 10084.64 | 575 | 570 | 156.9 |
| C | 14 | 80 | 970344 | 6181.62 | 575 | 570 | 156.9 |
| D | 0 | 18 | 1273873 | 6866.38 | 647 | 617 | 185.4 |
| D | 8 | 176 | 617209 | 3325.14 | 647 | 617 | 185.4 |
| D | 2 | 153 | 215227 | 1157.34 | 647 | 617 | 185.4 |
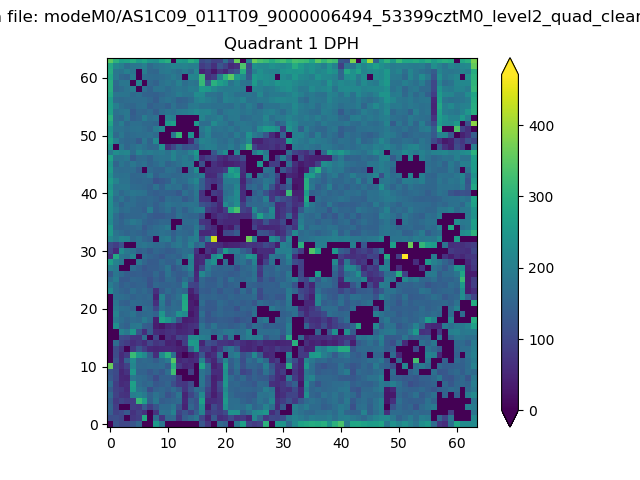
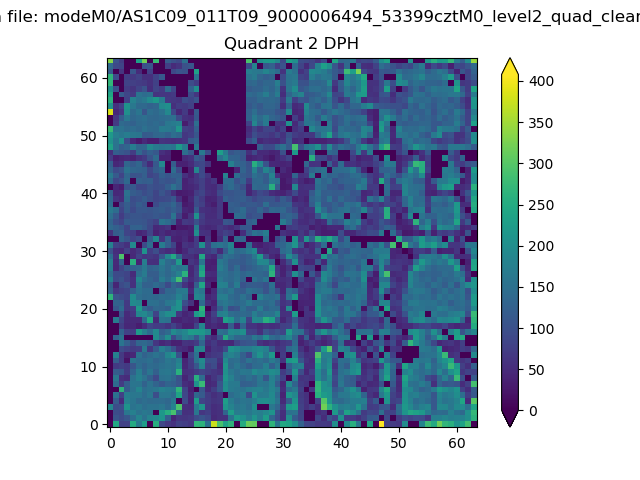
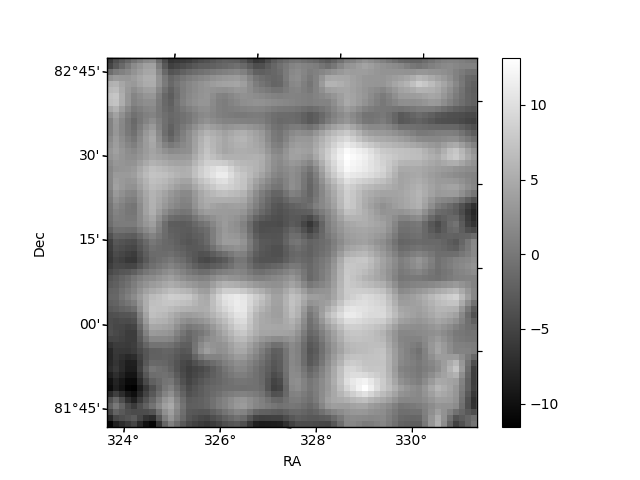
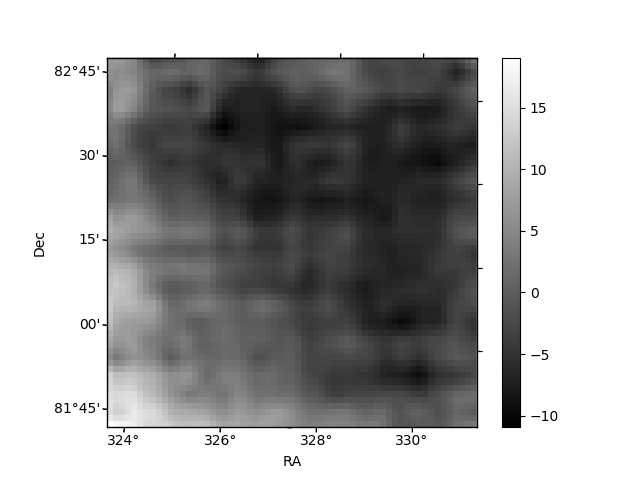
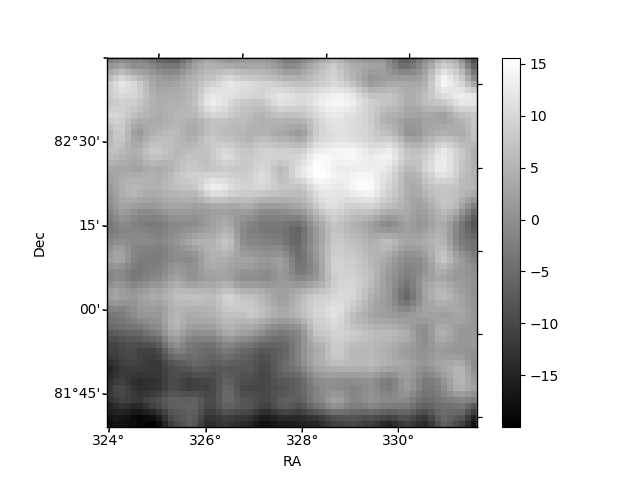
Histogram calculated using DETX and DETY for each event in the final _common_clean file
| Quadrant A | 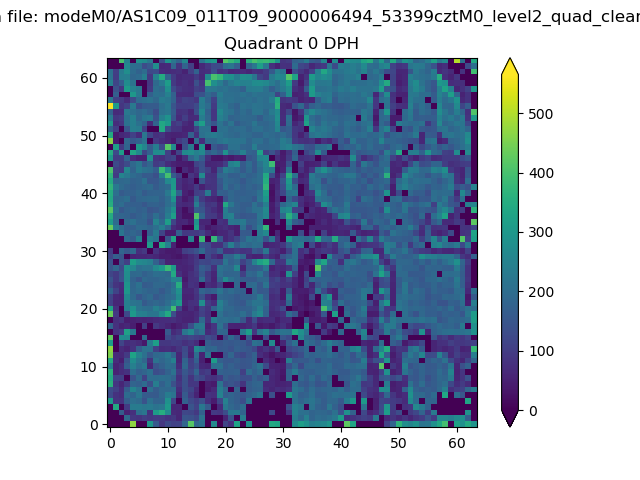 |
 |
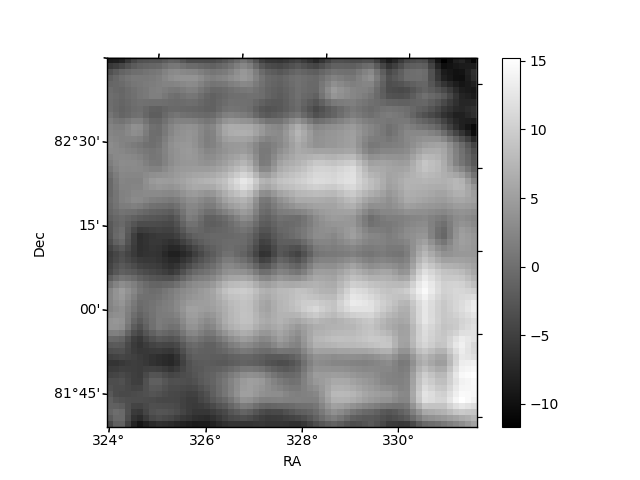
Quadrant B |
|---|---|---|---|
| Quadrant D | 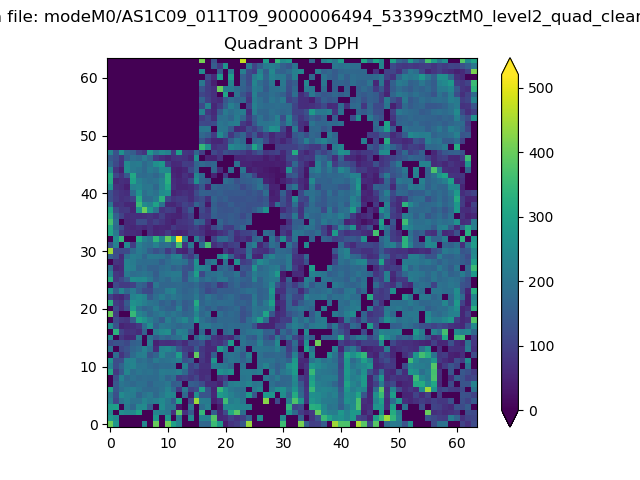 |
 |
Quadrant C |
| Plot type | Count rate plots | Images |
|---|---|---|
| Comparison with Poisson distribution Blue bars denote a histogram of data divided into 1 sec bins. Red curve is a Poisson curve with rate = median count rate of data. |
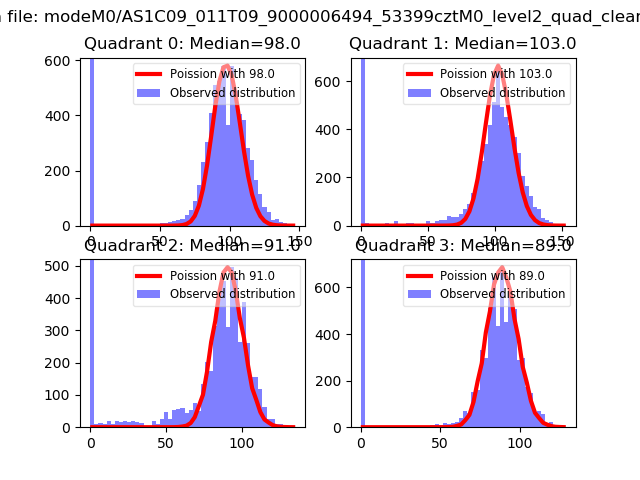 |
 |
| Quadrant-wise count rates Data is divided into 100 sec bins |
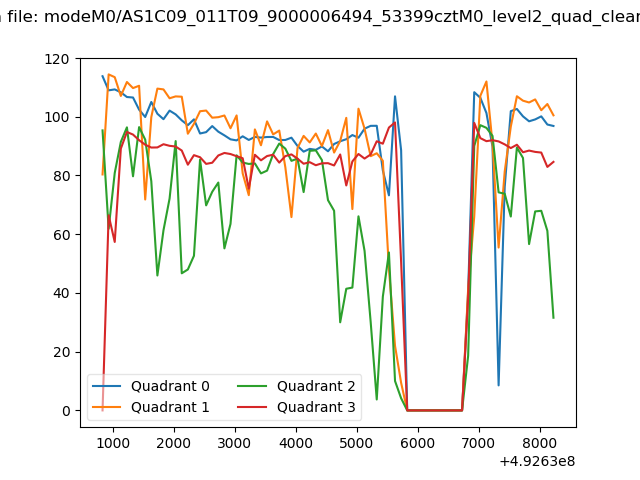 |
|
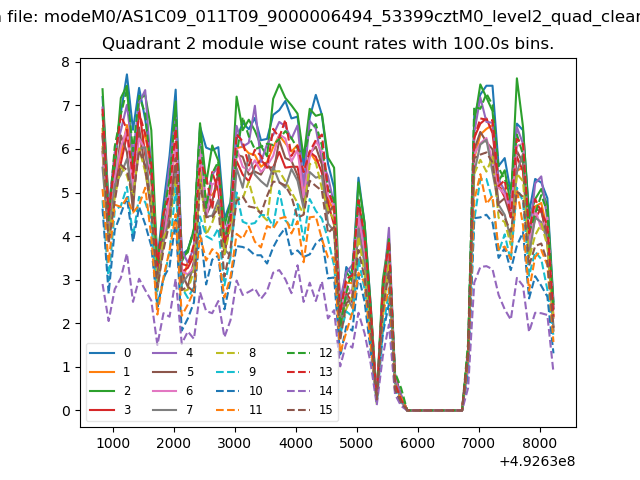
| Module-wise count rates for Quadrant A Data is divided into 100 sec bins |
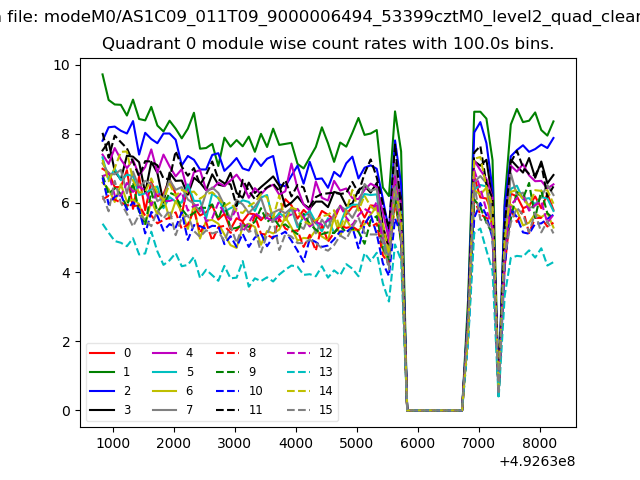 |
 |
| Module-wise count rates for Quadrant B Data is divided into 100 sec bins |
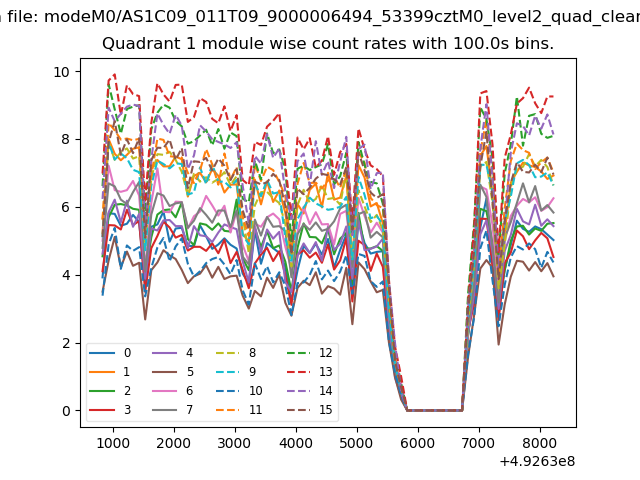 |
 |
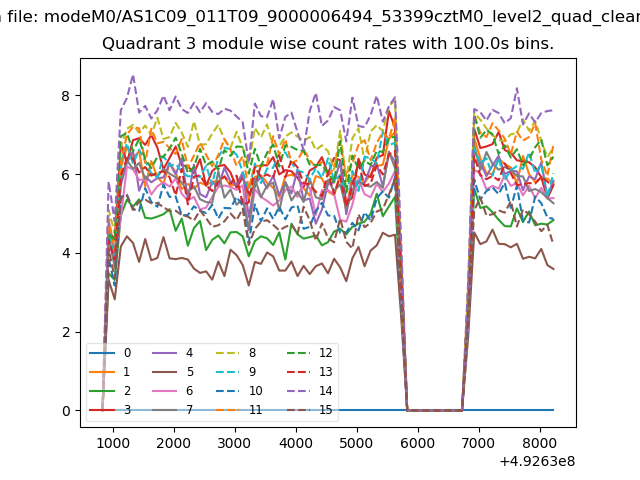
| Module-wise count rates for Quadrant C Data is divided into 100 sec bins |
 |
 |
| Module-wise count rates for Quadrant D Data is divided into 100 sec bins |
 |
 |
| Parameter | Plot |
|---|---|
| CZT HV Monitor | 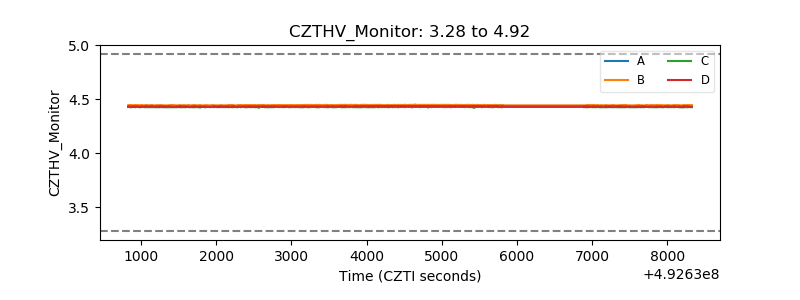 |
| D_VDD | 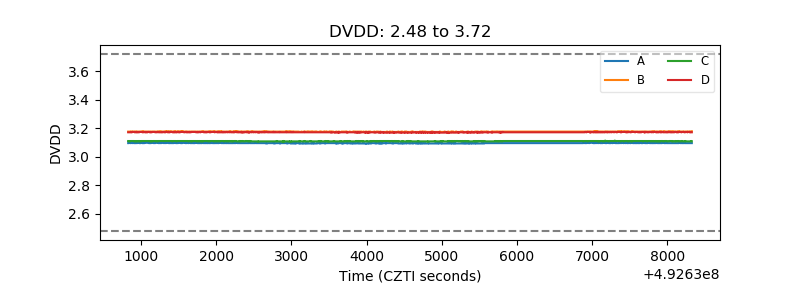 |
| Temperature 1 | 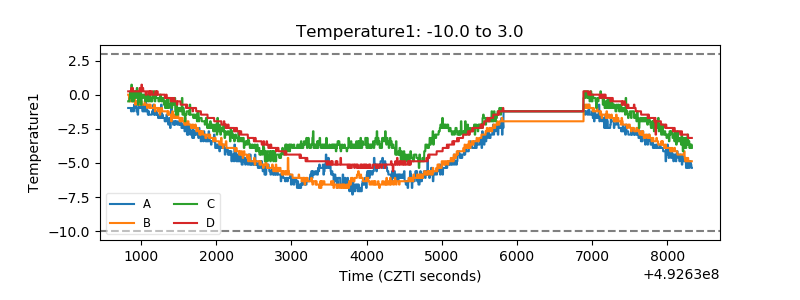 |
| Veto HV Monitor | 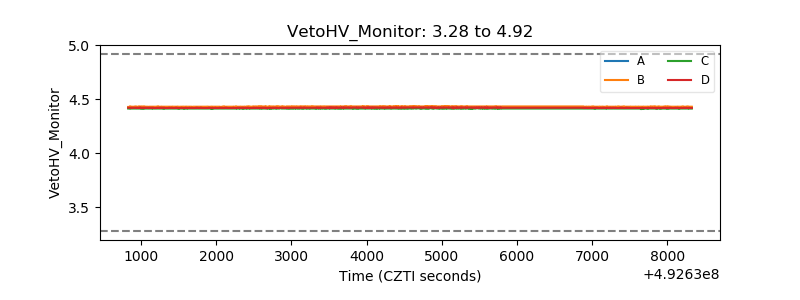 |
| Veto LLD | 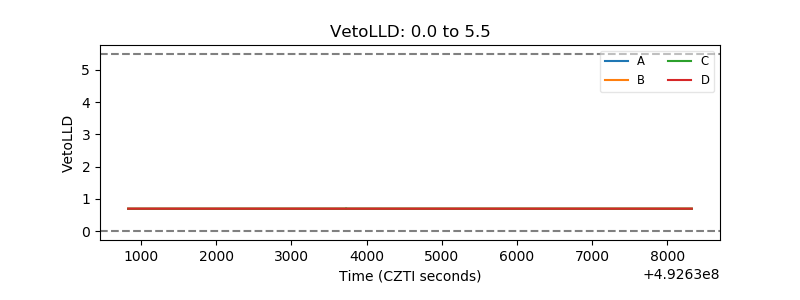 |
| Alpha Counter |  |
| _CPM_Rate | 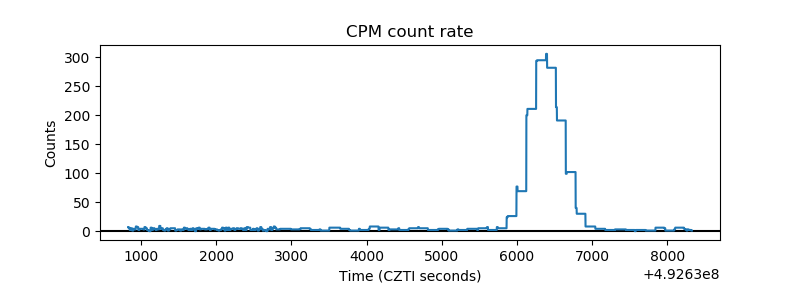 |
| CZT Counter | 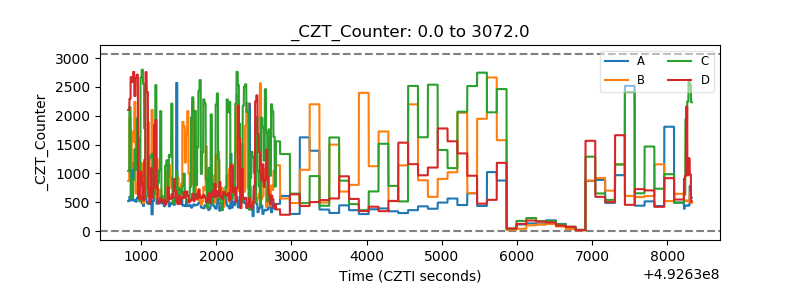 |
| +2.5 Volts monitor | 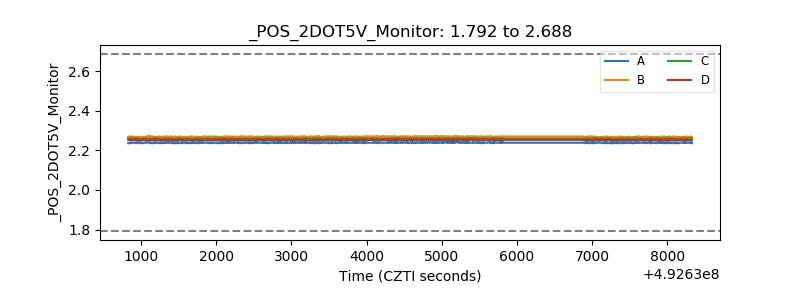 |
| +5 Volts monitor | 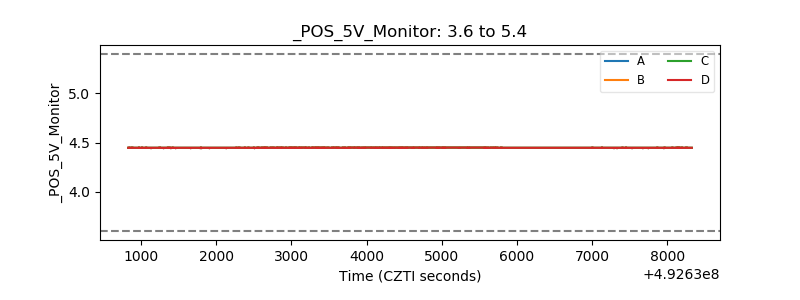 |
| _ROLL_ROT | 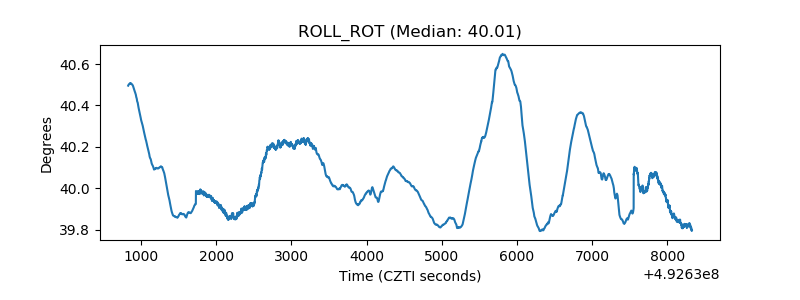 |
| _Roll_DEC | 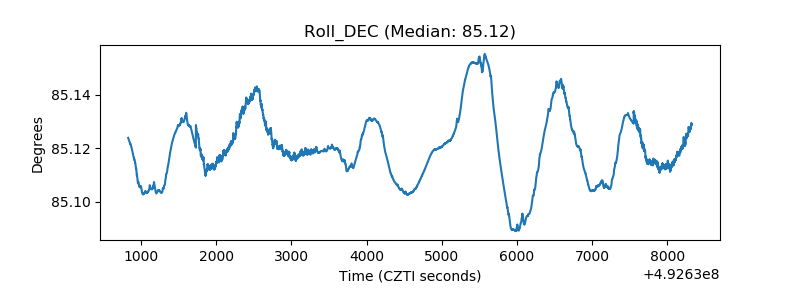 |
| _Roll_RA | 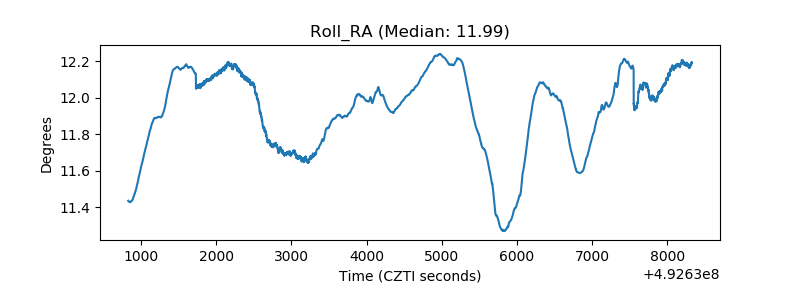 |
| Veto Counter | 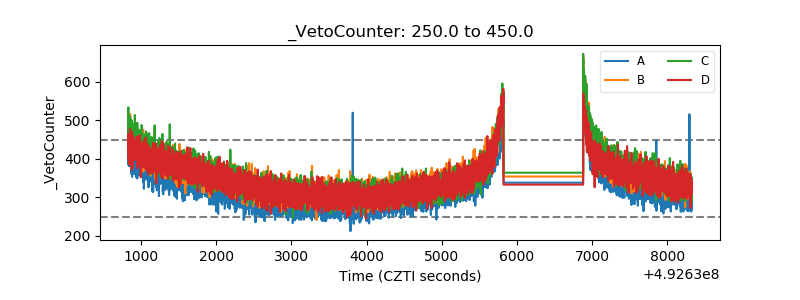 |