| Param | Original file | Final file |
|---|---|---|
| Filename | modeM0/AS1C09_011T09_9000006494_53400cztM0_level2.fits | modeM0/AS1C09_011T09_9000006494_53400cztM0_level2_quad_clean.evt |
| Size (bytes) | 765,460,800 | 89,409,600 |
| Size | 730.0 MB | 85.3 MB |
| Events in quadrant A | 4,082,696 | 641,174 |
| Events in quadrant B | 6,762,348 | 630,695 |
| Events in quadrant C | 11,564,560 | 385,685 |
| Events in quadrant D | 5,398,513 | 574,634 |
| Mode SS | |||
|---|---|---|---|
| Quadrant | BADHDUFLAG | Total packets | Discarded packets |
| A | 0 | 140 | 0 |
| B | 0 | 140 | 0 |
| C | 0 | 140 | 0 |
| D | 0 | 140 | 0 |
| Mode M0 | |||
|---|---|---|---|
| Quadrant | BADHDUFLAG | Total packets | Discarded packets |
| A | 0 | 17054 | 2 |
| B | 0 | 24929 | 2 |
| C | 0 | 39078 | 2 |
| D | 0 | 20740 | 2 |
| Mode M9 | |||
|---|---|---|---|
| Quadrant | BADHDUFLAG | Total packets | Discarded packets |
| A | 0 | 12 | 0 |
| B | 0 | 13 | 0 |
| C | 0 | 13 | 0 |
| D | 0 | 13 | 0 |
| Quadrant | Total seconds | Saturated seconds | Saturation percentage |
|---|---|---|---|
| A | 6805 | 288 | 4.232182% |
| B | 6805 | 1013 | 14.886113% |
| C | 6805 | 3043 | 44.717120% |
| D | 6805 | 391 | 5.745775% |
Noise dominated data is calculated using 1-second bins in cleaned event files. If a bin has >2000 counts, and if more than 50% of those come from <1% of pixels, then it is considered to be noise-dominated and hence unusable.
| Quadrant | # 1 sec bins | Bins with >0 counts | Bins with >2000 counts | High rate bins dominated by noise | Noise dominated (total time) | Noise dominated (detector-on time) | Marked lightcurve |
|---|---|---|---|---|---|---|---|
| A | 7635 | 6806 | 192 | 192 | 2.51% | 2.82% | 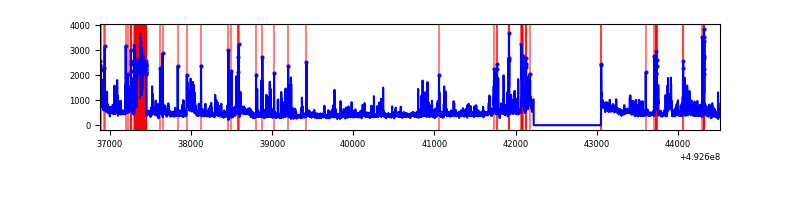 |
| B | 7635 | 6805 | 613 | 613 | 8.03% | 9.01% | 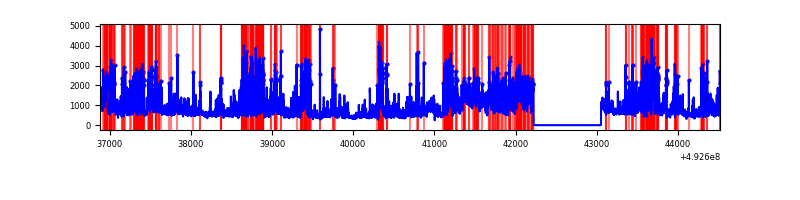 |
| C | 7634 | 6804 | 2607 | 2607 | 34.15% | 38.32% | 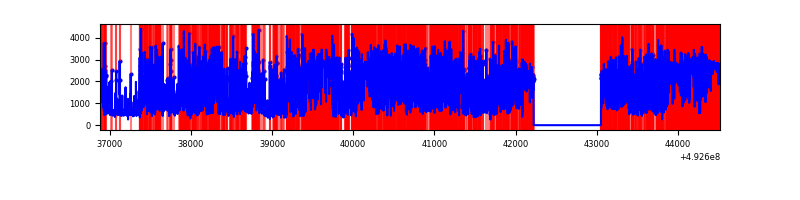 |
| D | 7635 | 6806 | 311 | 311 | 4.07% | 4.57% | 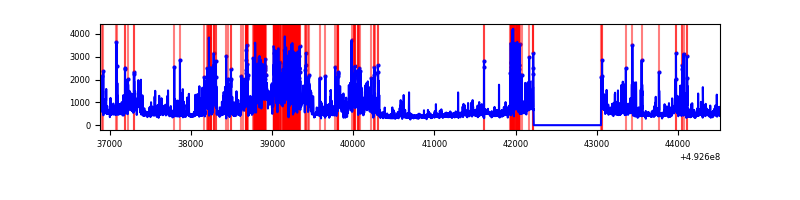 |
Top three noisy pixels from each quadrant. If the there are fewer than three noisy pixels in the level2.evt file, extra rows are filled as -1
| Pixel properties | Quadrant properties | ||||||
|---|---|---|---|---|---|---|---|
| Quadrant | DetID | PixID | Counts | Sigma | Mean | Median | Sigma |
| A | 15 | 174 | 595594 | 3464.45 | 699 | 682 | 171.7 |
| A | 7 | 191 | 272750 | 1584.38 | 699 | 682 | 171.7 |
| A | 5 | 241 | 83524 | 482.43 | 699 | 682 | 171.7 |
| B | 4 | 171 | 1189536 | 8314.2 | 678 | 654 | 143.0 |
| B | 2 | 249 | 1043173 | 7290.64 | 678 | 654 | 143.0 |
| B | 10 | 254 | 353315 | 2466.26 | 678 | 654 | 143.0 |
| C | 15 | 224 | 3551891 | 23183.53 | 556 | 552 | 153.2 |
| C | 14 | 80 | 2331178 | 15214.58 | 556 | 552 | 153.2 |
| C | 1 | 241 | 1468928 | 9585.72 | 556 | 552 | 153.2 |
| D | 0 | 18 | 946001 | 4861.64 | 686 | 654 | 194.5 |
| D | 2 | 172 | 449847 | 2310.07 | 686 | 654 | 194.5 |
| D | 2 | 153 | 262360 | 1345.88 | 686 | 654 | 194.5 |
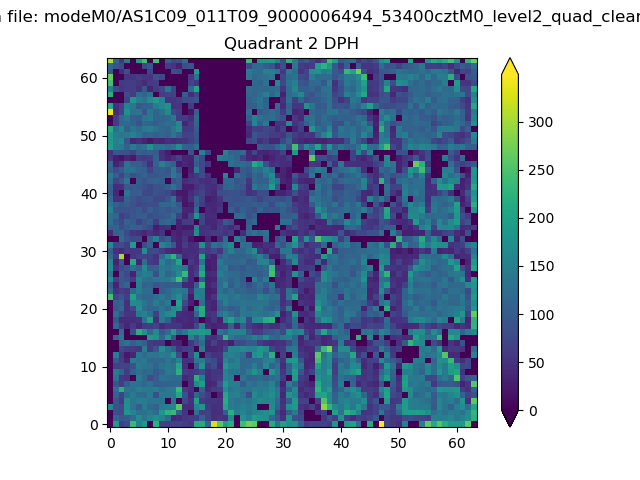
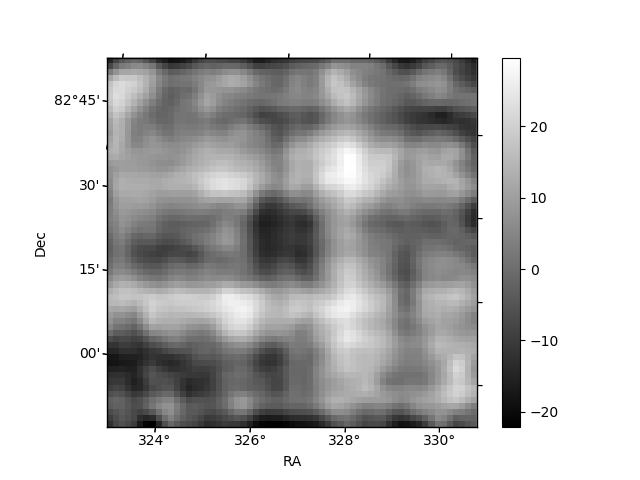
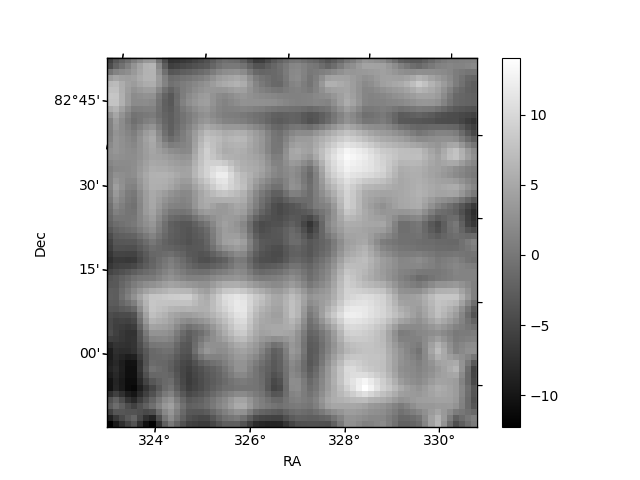
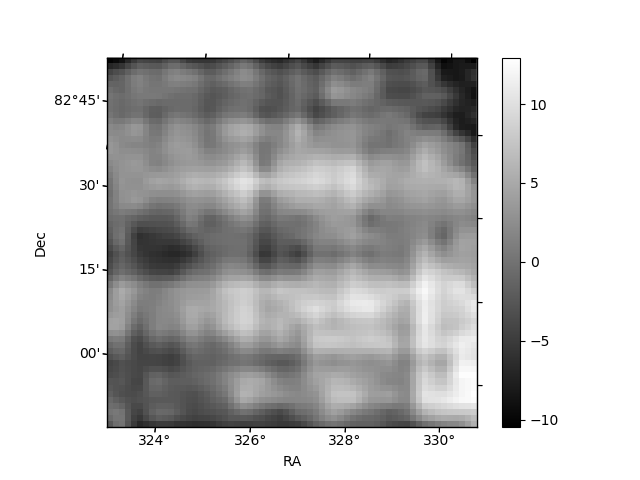
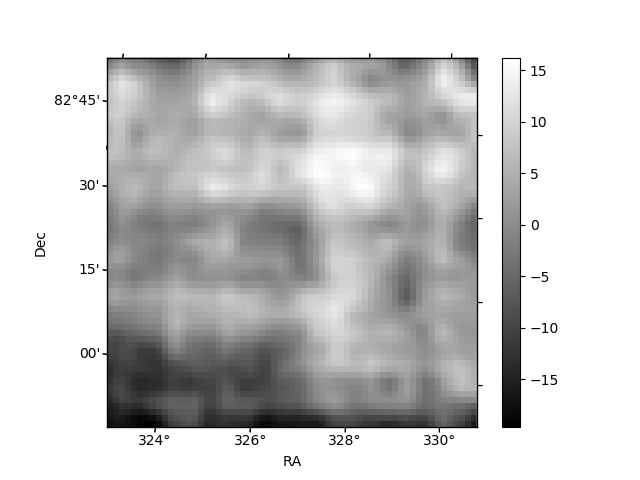
Histogram calculated using DETX and DETY for each event in the final _common_clean file
| Quadrant A | 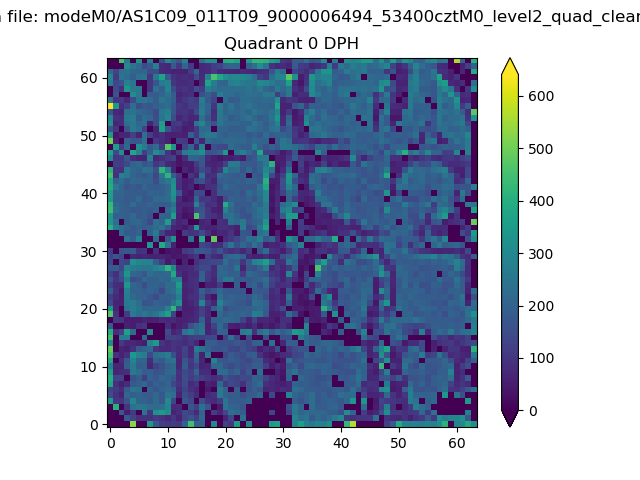 |
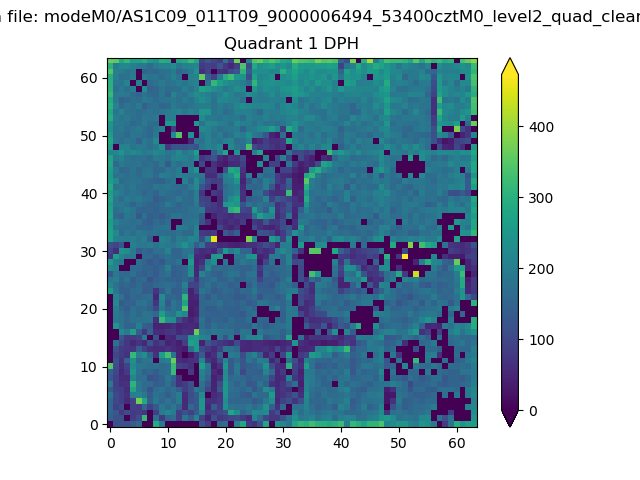 |
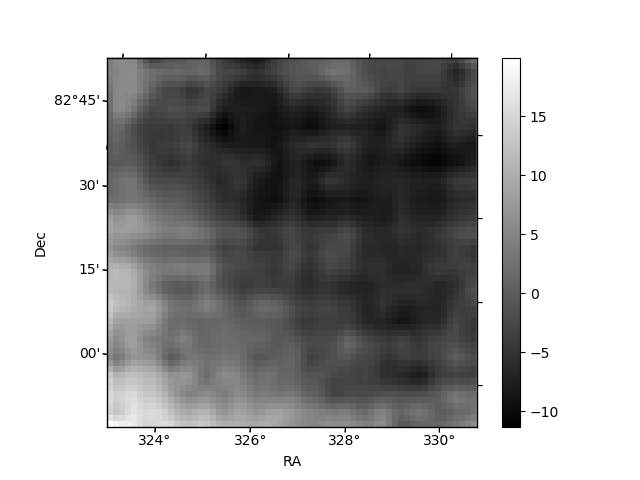
Quadrant B |
|---|---|---|---|
| Quadrant D | 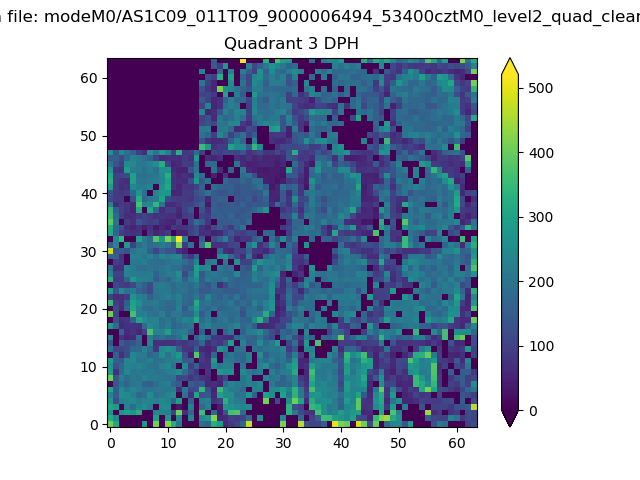 |
 |
Quadrant C |
| Plot type | Count rate plots | Images |
|---|---|---|
| Comparison with Poisson distribution Blue bars denote a histogram of data divided into 1 sec bins. Red curve is a Poisson curve with rate = median count rate of data. |
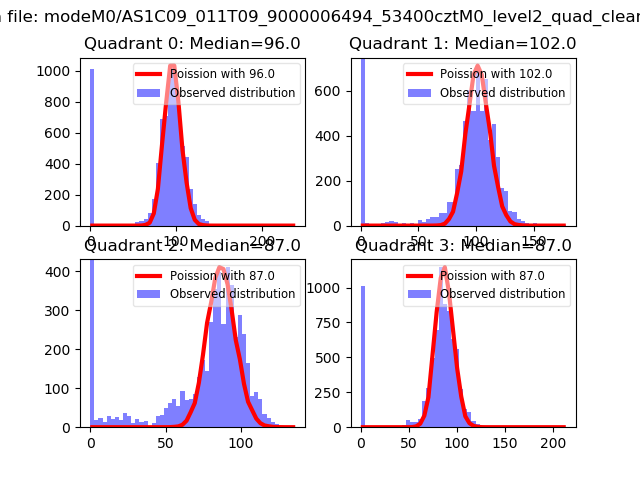 |
 |
| Quadrant-wise count rates Data is divided into 100 sec bins |
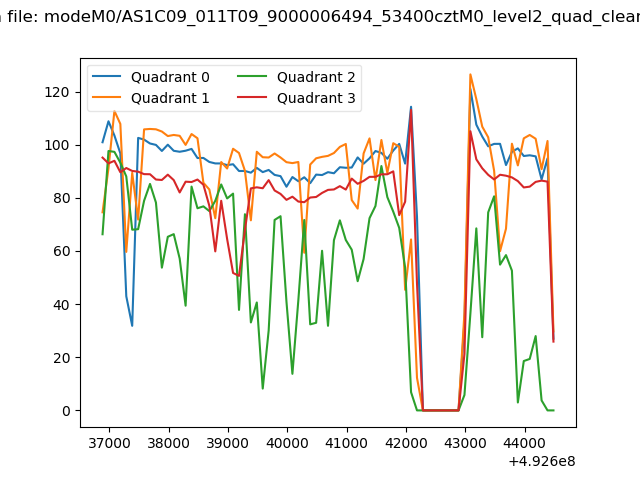 |
|
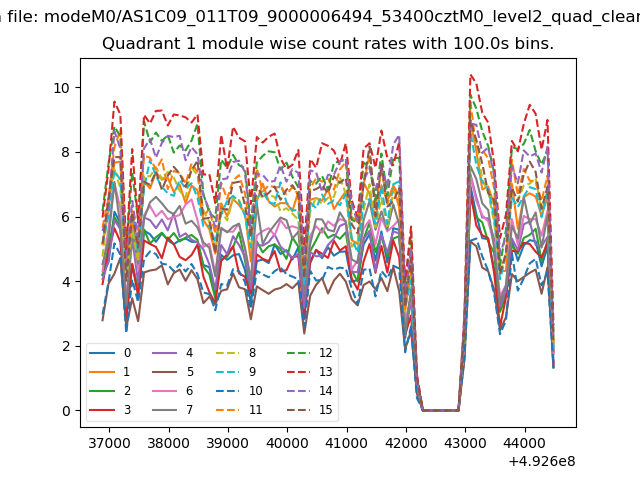
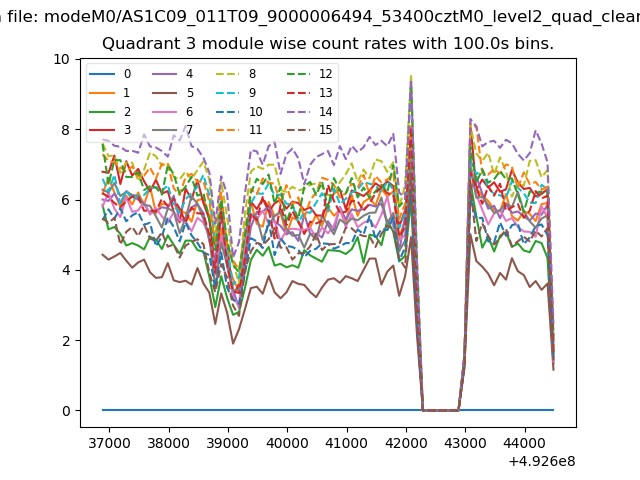
| Module-wise count rates for Quadrant A Data is divided into 100 sec bins |
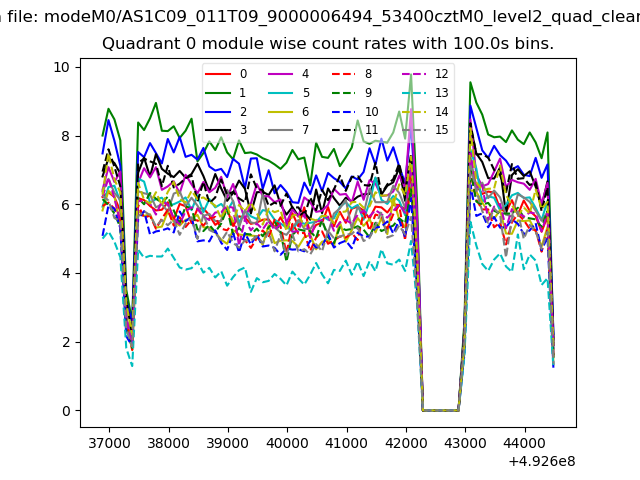 |
 |
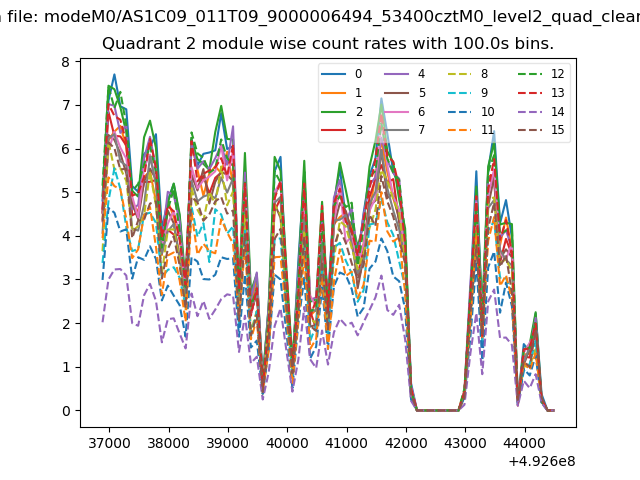
| Module-wise count rates for Quadrant B Data is divided into 100 sec bins |
 |
 |
| Module-wise count rates for Quadrant C Data is divided into 100 sec bins |
 |
 |
| Module-wise count rates for Quadrant D Data is divided into 100 sec bins |
 |
 |
| Parameter | Plot |
|---|---|
| CZT HV Monitor | 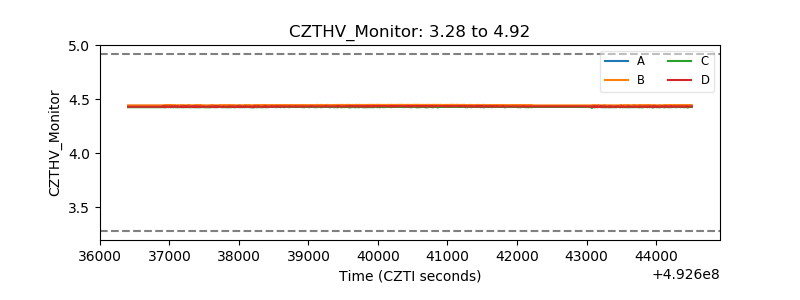 |
| D_VDD | 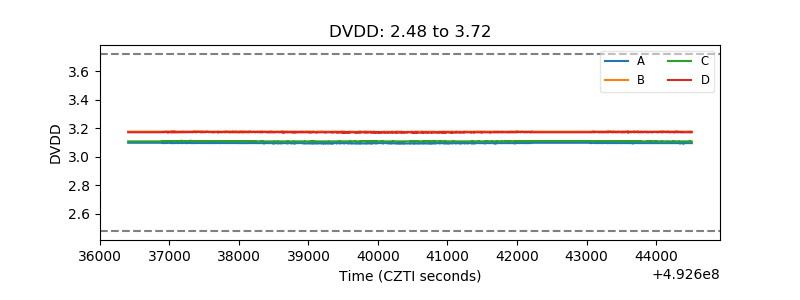 |
| Temperature 1 | 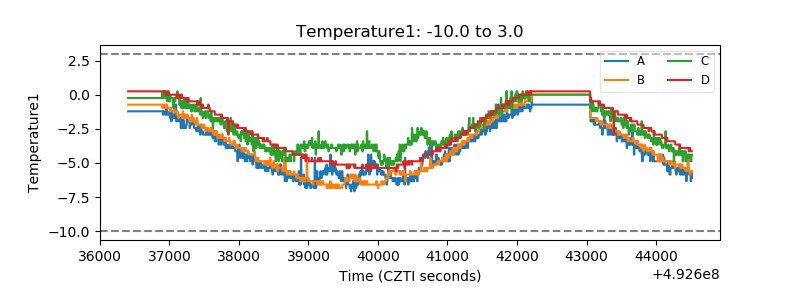 |
| Veto HV Monitor | 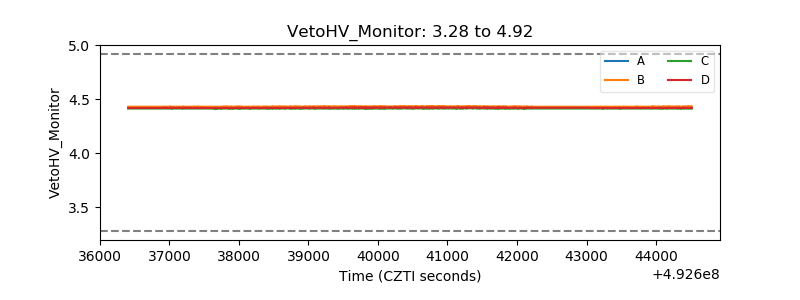 |
| Veto LLD | 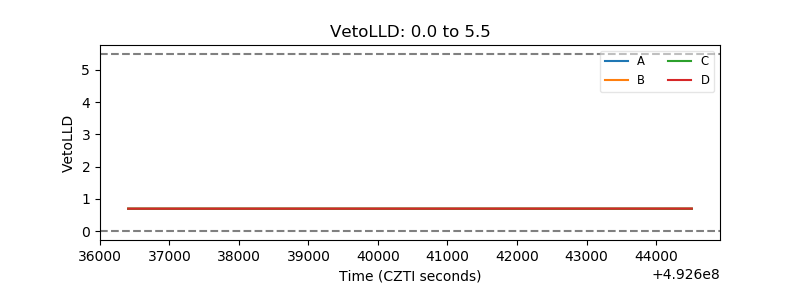 |
| Alpha Counter | 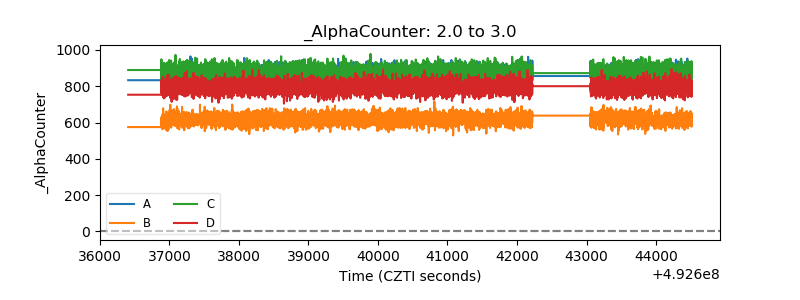 |
| _CPM_Rate | 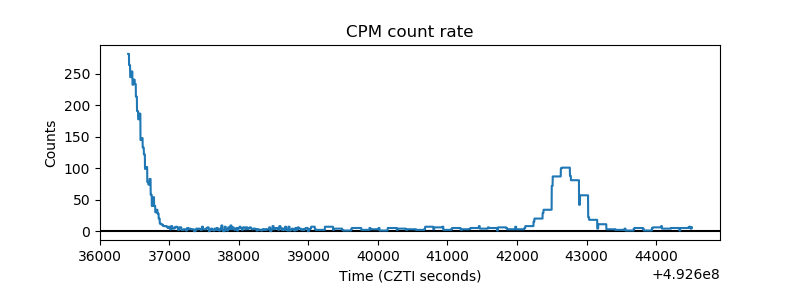 |
| CZT Counter | 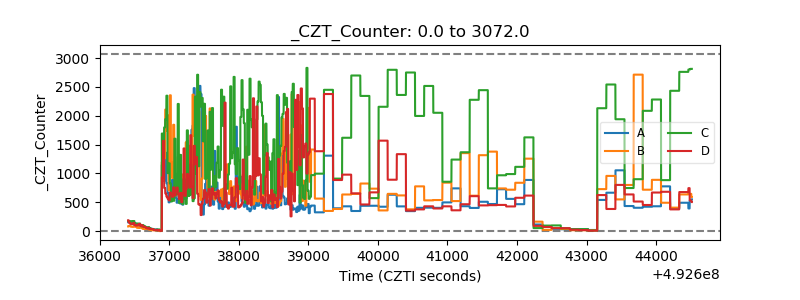 |
| +2.5 Volts monitor |  |
| +5 Volts monitor | 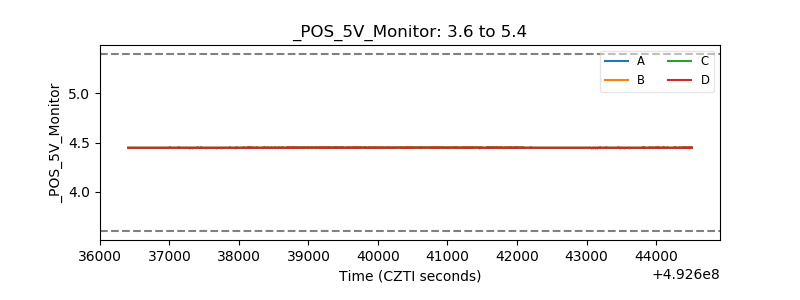 |
| _ROLL_ROT | 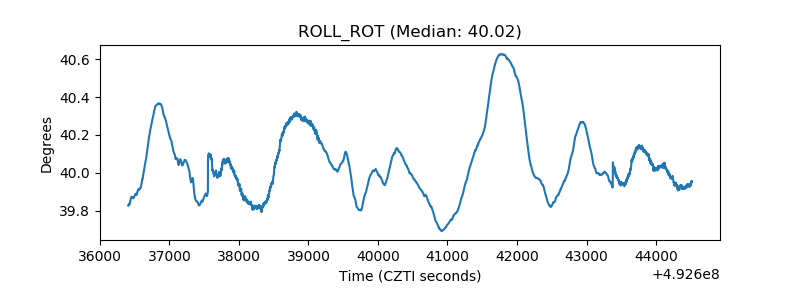 |
| _Roll_DEC | 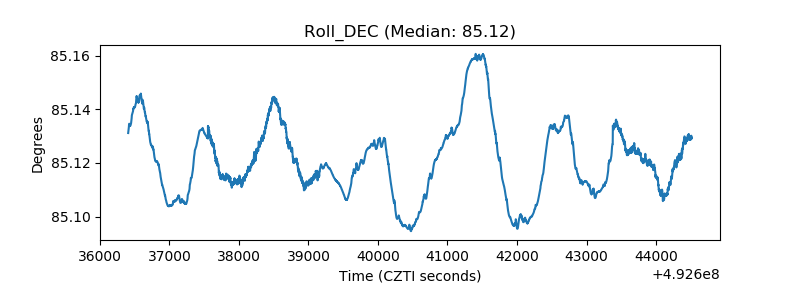 |
| _Roll_RA | 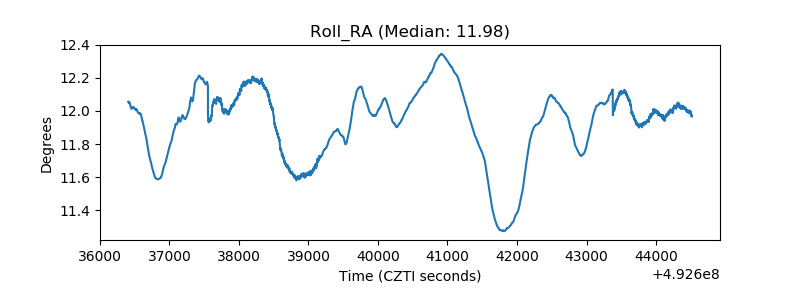 |
| Veto Counter | 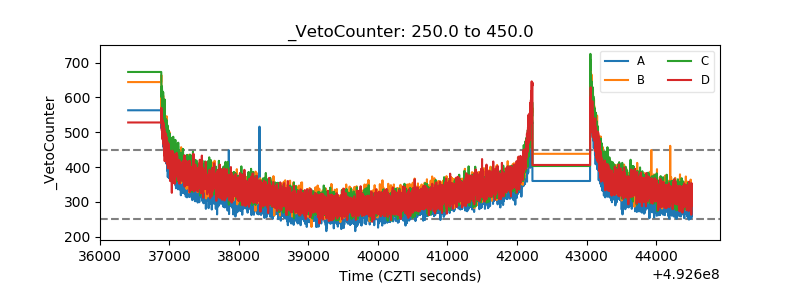 |