| Param | Original file | Final file |
|---|---|---|
| Filename | modeM0/AS1C09_011T09_9000006494_53401cztM0_level2.fits | modeM0/AS1C09_011T09_9000006494_53401cztM0_level2_quad_clean.evt |
| Size (bytes) | 888,396,480 | 92,407,680 |
| Size | 847.2 MB | 88.1 MB |
| Events in quadrant A | 4,342,275 | 692,156 |
| Events in quadrant B | 8,916,817 | 633,385 |
| Events in quadrant C | 13,633,373 | 336,098 |
| Events in quadrant D | 5,421,303 | 621,303 |
| Mode SS | |||
|---|---|---|---|
| Quadrant | BADHDUFLAG | Total packets | Discarded packets |
| A | 0 | 150 | 0 |
| B | 0 | 150 | 0 |
| C | 0 | 150 | 0 |
| D | 0 | 150 | 0 |
| Mode M0 | |||
|---|---|---|---|
| Quadrant | BADHDUFLAG | Total packets | Discarded packets |
| A | 0 | 18322 | 3 |
| B | 0 | 31737 | 3 |
| C | 0 | 45518 | 3 |
| D | 0 | 21270 | 3 |
| Mode M9 | |||
|---|---|---|---|
| Quadrant | BADHDUFLAG | Total packets | Discarded packets |
| A | 0 | 5 | 0 |
| B | 0 | 6 | 0 |
| C | 0 | 6 | 0 |
| D | 0 | 6 | 0 |
| Quadrant | Total seconds | Saturated seconds | Saturation percentage |
|---|---|---|---|
| A | 7393 | 259 | 3.503314% |
| B | 7393 | 1637 | 22.142567% |
| C | 7393 | 4053 | 54.822129% |
| D | 7393 | 359 | 4.855945% |
Noise dominated data is calculated using 1-second bins in cleaned event files. If a bin has >2000 counts, and if more than 50% of those come from <1% of pixels, then it is considered to be noise-dominated and hence unusable.
| Quadrant | # 1 sec bins | Bins with >0 counts | Bins with >2000 counts | High rate bins dominated by noise | Noise dominated (total time) | Noise dominated (detector-on time) | Marked lightcurve |
|---|---|---|---|---|---|---|---|
| A | 7803 | 7395 | 128 | 128 | 1.64% | 1.73% | 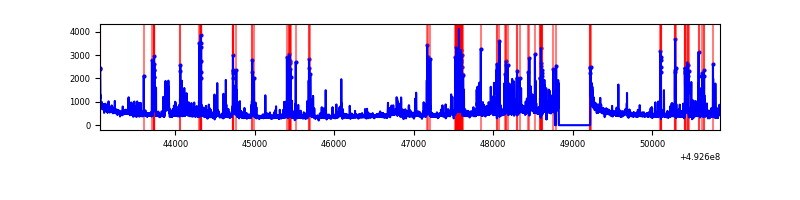 |
| B | 7803 | 7395 | 1187 | 1187 | 15.21% | 16.05% | 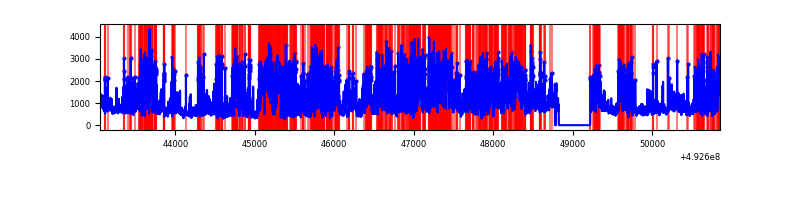 |
| C | 7803 | 7395 | 3727 | 3727 | 47.76% | 50.40% | 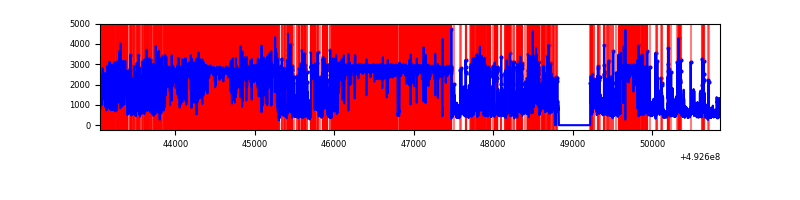 |
| D | 7803 | 7395 | 288 | 288 | 3.69% | 3.89% | 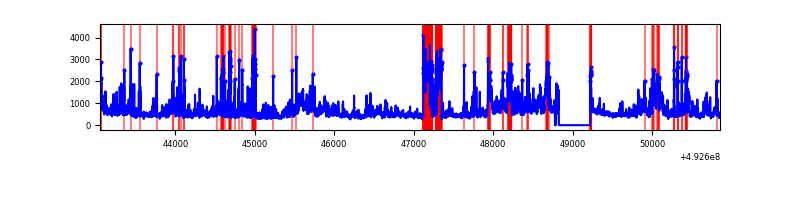 |
Top three noisy pixels from each quadrant. If the there are fewer than three noisy pixels in the level2.evt file, extra rows are filled as -1
| Pixel properties | Quadrant properties | ||||||
|---|---|---|---|---|---|---|---|
| Quadrant | DetID | PixID | Counts | Sigma | Mean | Median | Sigma |
| A | 15 | 174 | 358467 | 1863.74 | 768 | 749 | 191.9 |
| A | 4 | 249 | 245998 | 1277.77 | 768 | 749 | 191.9 |
| A | 7 | 191 | 176615 | 916.28 | 768 | 749 | 191.9 |
| B | 2 | 249 | 2698893 | 18010.29 | 718 | 694 | 149.8 |
| B | 4 | 171 | 1246060 | 8312.73 | 718 | 694 | 149.8 |
| B | 4 | 206 | 534409 | 3562.51 | 718 | 694 | 149.8 |
| C | 1 | 241 | 6674967 | 44918.61 | 537 | 532 | 148.6 |
| C | 15 | 224 | 2122546 | 14281.05 | 537 | 532 | 148.6 |
| C | 14 | 80 | 1256675 | 8453.78 | 537 | 532 | 148.6 |
| D | 3 | 12 | 1178539 | 5518.78 | 745 | 709 | 213.4 |
| D | 0 | 18 | 365207 | 1707.87 | 745 | 709 | 213.4 |
| D | 2 | 153 | 257797 | 1204.6 | 745 | 709 | 213.4 |
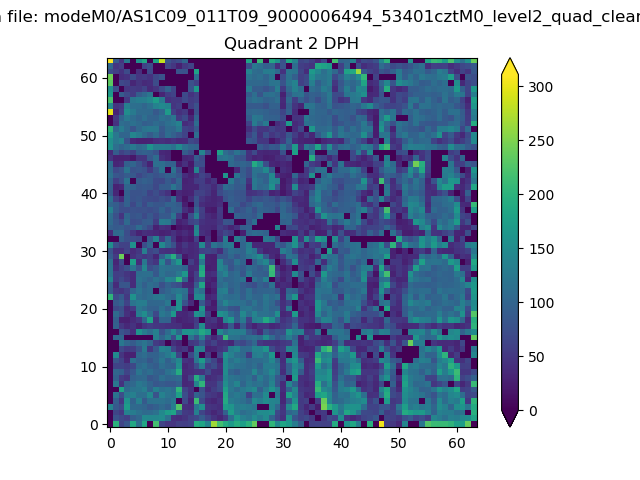
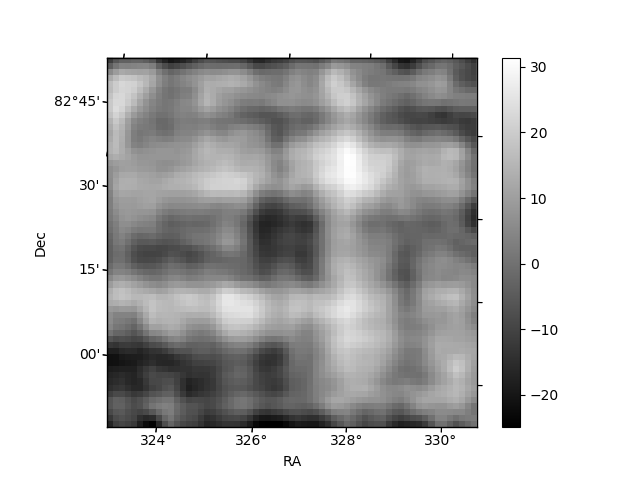
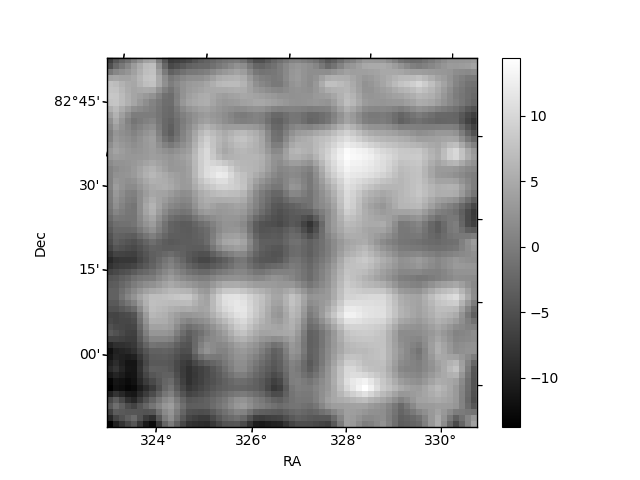
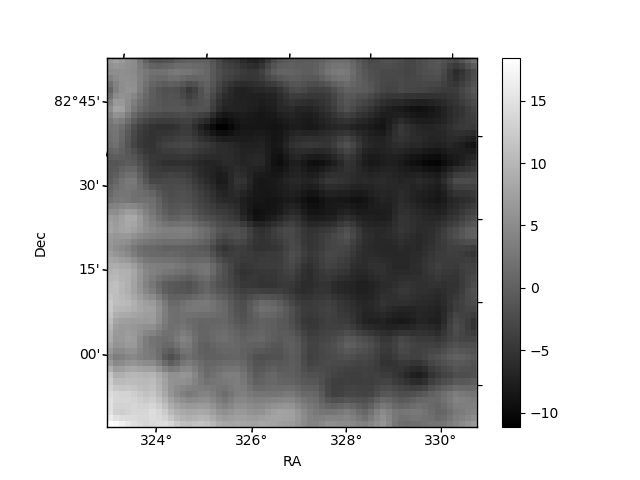
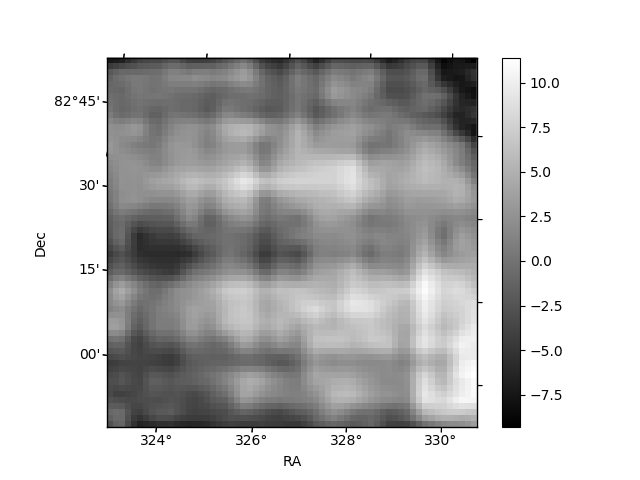
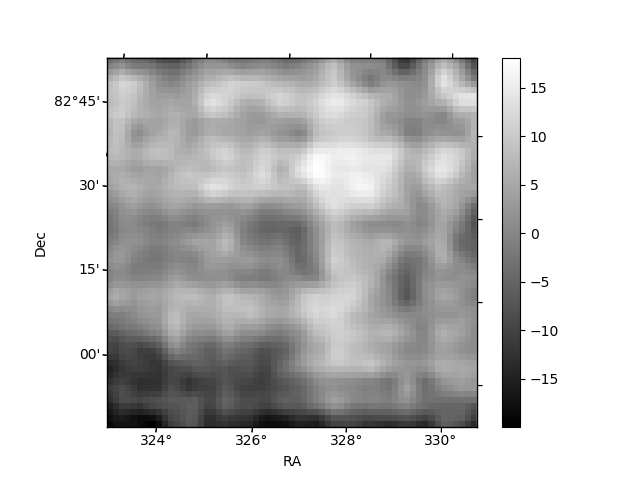
Histogram calculated using DETX and DETY for each event in the final _common_clean file
| Quadrant A | 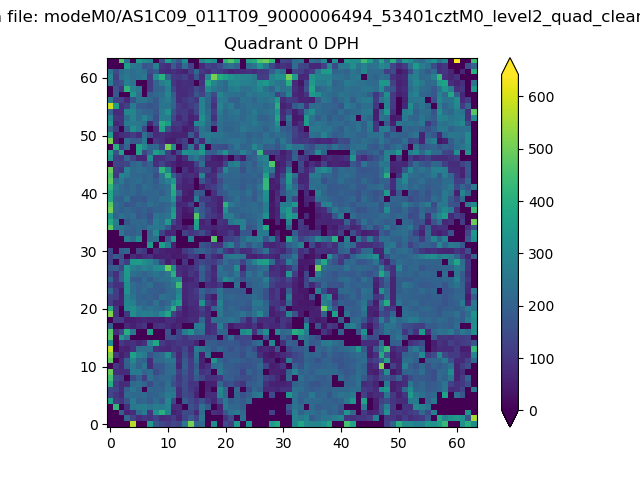 |
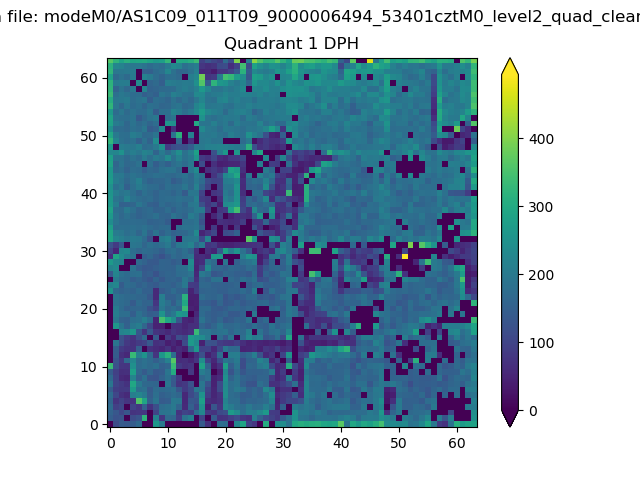 |
Quadrant B |
|---|---|---|---|
| Quadrant D | 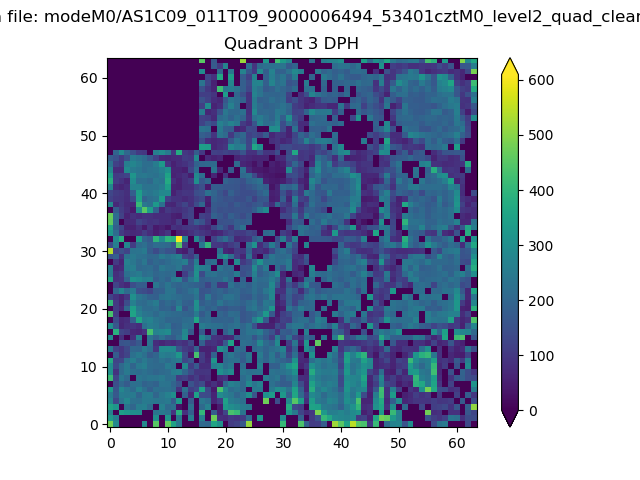 |
 |
Quadrant C |
| Plot type | Count rate plots | Images |
|---|---|---|
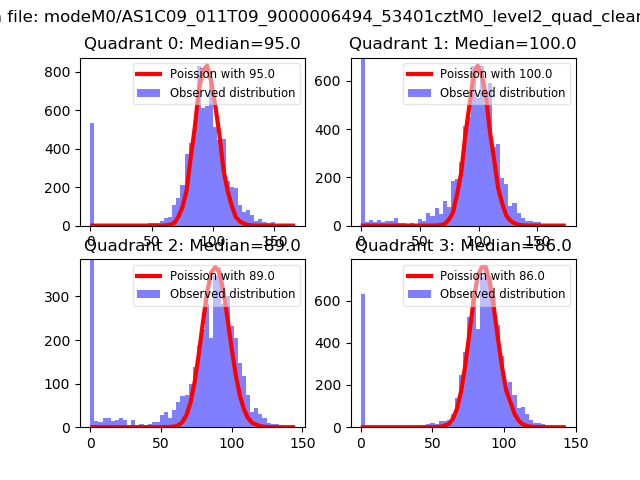
| Comparison with Poisson distribution Blue bars denote a histogram of data divided into 1 sec bins. Red curve is a Poisson curve with rate = median count rate of data. |
 |
 |
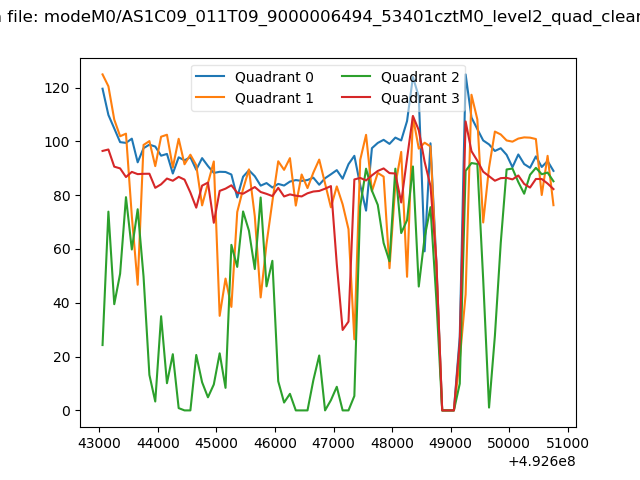
| Quadrant-wise count rates Data is divided into 100 sec bins |
 |
|
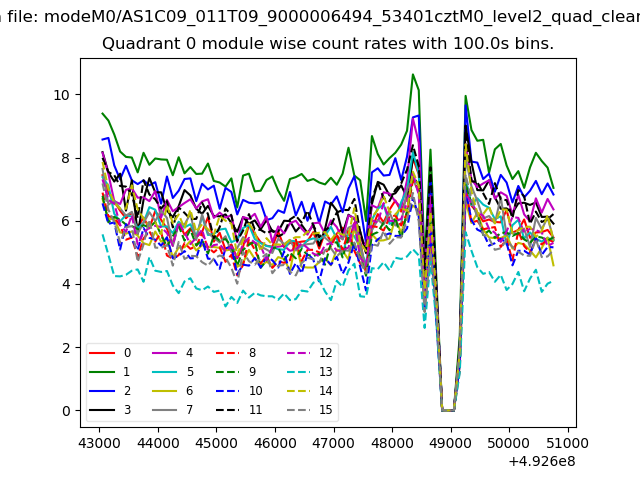
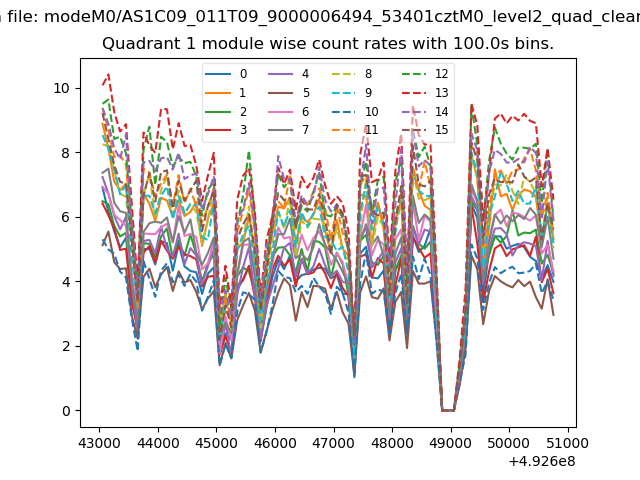
| Module-wise count rates for Quadrant A Data is divided into 100 sec bins |
 |
 |
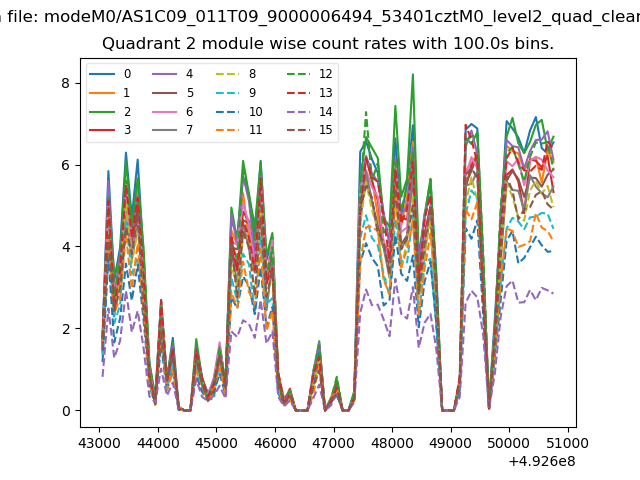
| Module-wise count rates for Quadrant B Data is divided into 100 sec bins |
 |
 |
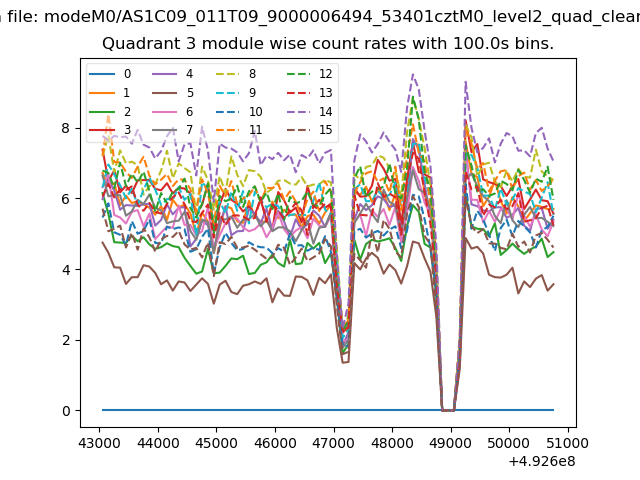
| Module-wise count rates for Quadrant C Data is divided into 100 sec bins |
 |
 |
| Module-wise count rates for Quadrant D Data is divided into 100 sec bins |
 |
 |
| Parameter | Plot |
|---|---|
| CZT HV Monitor | 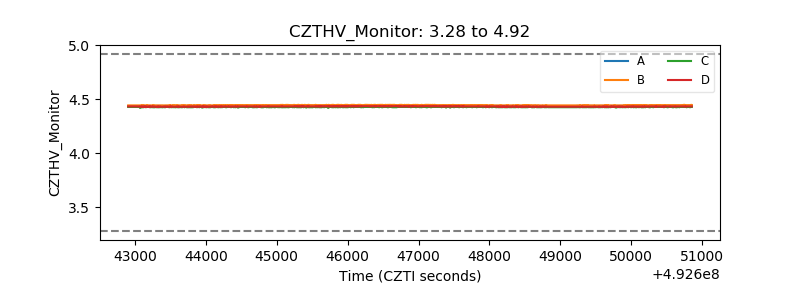 |
| D_VDD | 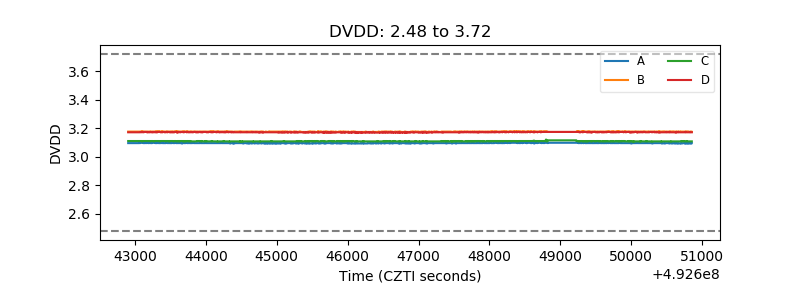 |
| Temperature 1 | 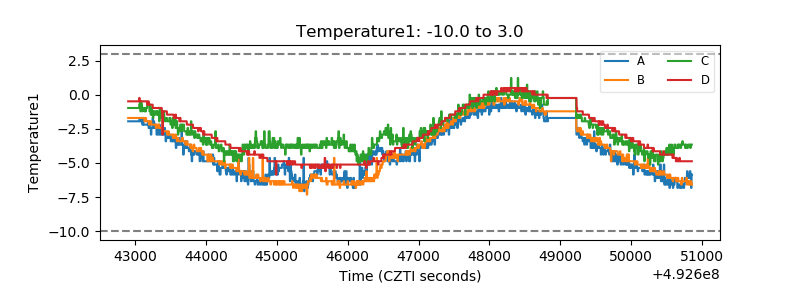 |
| Veto HV Monitor | 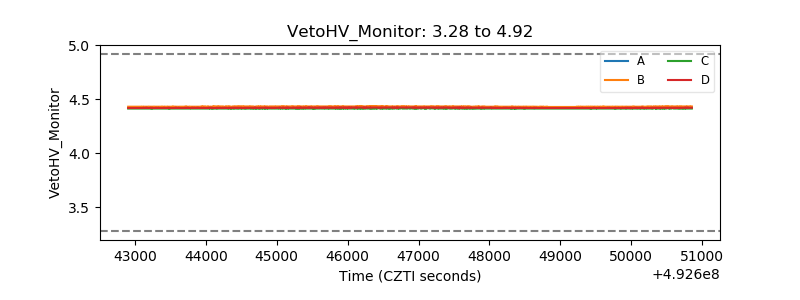 |
| Veto LLD | 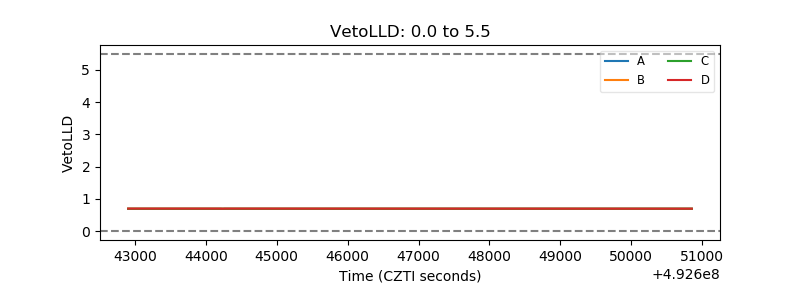 |
| Alpha Counter | 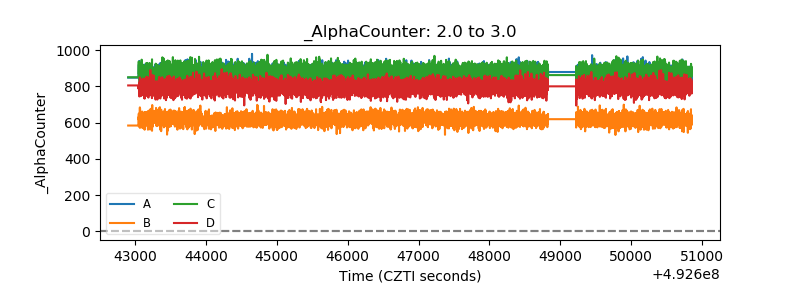 |
| _CPM_Rate | 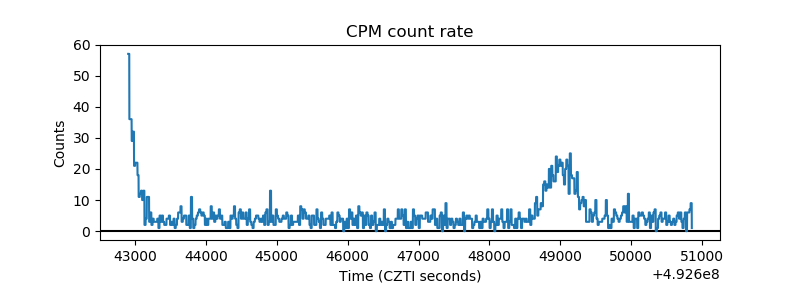 |
| CZT Counter | 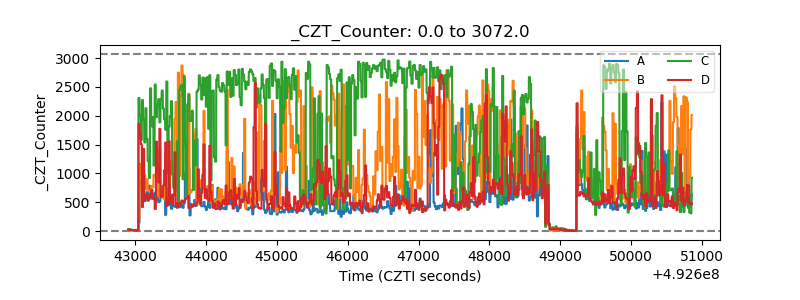 |
| +2.5 Volts monitor |  |
| +5 Volts monitor | 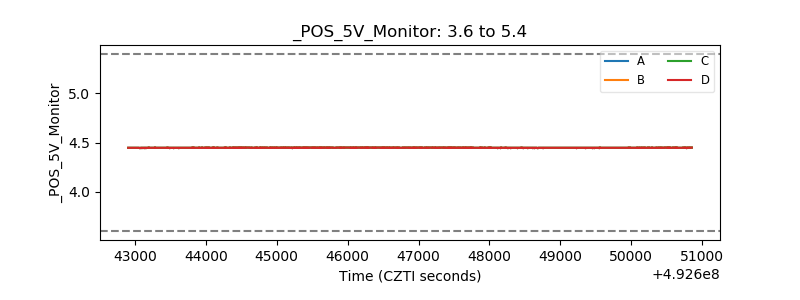 |
| _ROLL_ROT | 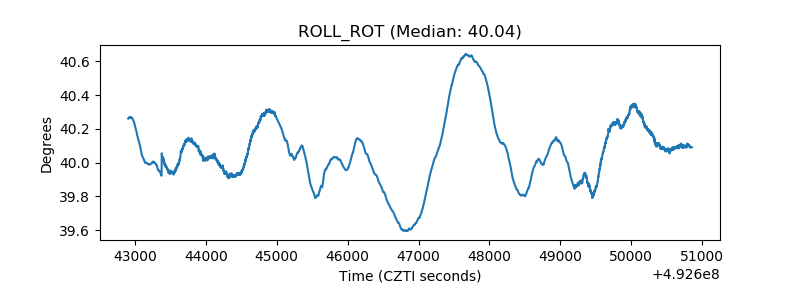 |
| _Roll_DEC | 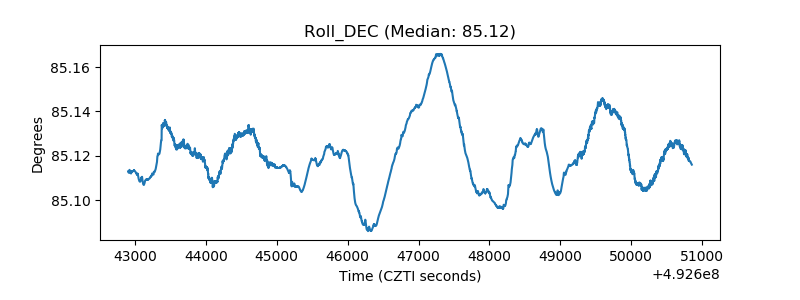 |
| _Roll_RA | 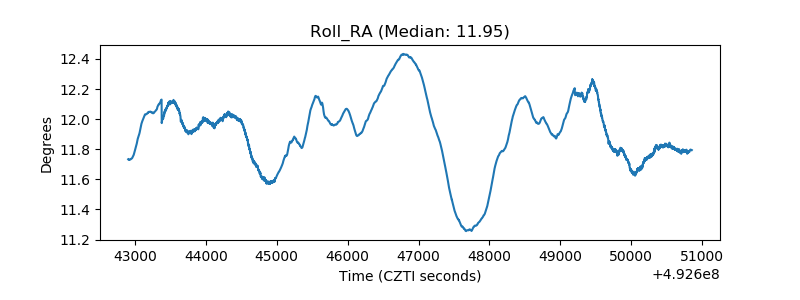 |
| Veto Counter | 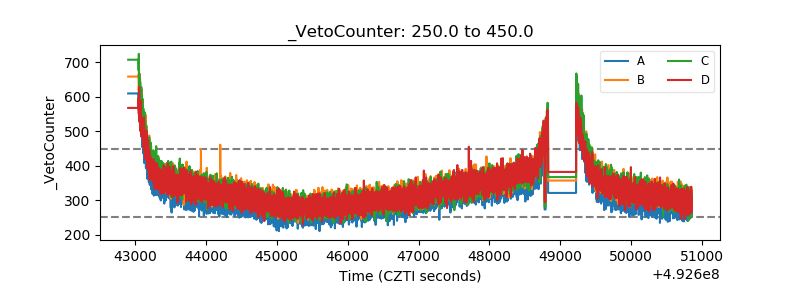 |