| Param | Original file | Final file |
|---|---|---|
| Filename | modeM0/AS1C09_011T09_9000006494_53402cztM0_level2.fits | modeM0/AS1C09_011T09_9000006494_53402cztM0_level2_quad_clean.evt |
| Size (bytes) | 754,721,280 | 110,557,440 |
| Size | 719.8 MB | 105.4 MB |
| Events in quadrant A | 5,514,598 | 722,622 |
| Events in quadrant B | 7,303,943 | 764,641 |
| Events in quadrant C | 8,685,870 | 615,994 |
| Events in quadrant D | 5,812,150 | 685,845 |
| Mode SS | |||
|---|---|---|---|
| Quadrant | BADHDUFLAG | Total packets | Discarded packets |
| A | 0 | 164 | 0 |
| B | 0 | 164 | 0 |
| C | 0 | 164 | 0 |
| D | 0 | 164 | 0 |
| Mode M0 | |||
|---|---|---|---|
| Quadrant | BADHDUFLAG | Total packets | Discarded packets |
| A | 0 | 22127 | 2 |
| B | 0 | 27317 | 2 |
| C | 0 | 31496 | 2 |
| D | 0 | 22892 | 2 |
| Mode M9 | |||
|---|---|---|---|
| Quadrant | BADHDUFLAG | Total packets | Discarded packets |
| A | 0 | 4 | 0 |
| B | 0 | 4 | 0 |
| C | 0 | 4 | 0 |
| D | 0 | 4 | 0 |
| Quadrant | Total seconds | Saturated seconds | Saturation percentage |
|---|---|---|---|
| A | 8023 | 537 | 6.693257% |
| B | 8023 | 816 | 10.170759% |
| C | 8023 | 1513 | 18.858282% |
| D | 8023 | 184 | 2.293406% |
Noise dominated data is calculated using 1-second bins in cleaned event files. If a bin has >2000 counts, and if more than 50% of those come from <1% of pixels, then it is considered to be noise-dominated and hence unusable.
| Quadrant | # 1 sec bins | Bins with >0 counts | Bins with >2000 counts | High rate bins dominated by noise | Noise dominated (total time) | Noise dominated (detector-on time) | Marked lightcurve |
|---|---|---|---|---|---|---|---|
| A | 8432 | 8024 | 369 | 369 | 4.38% | 4.60% | 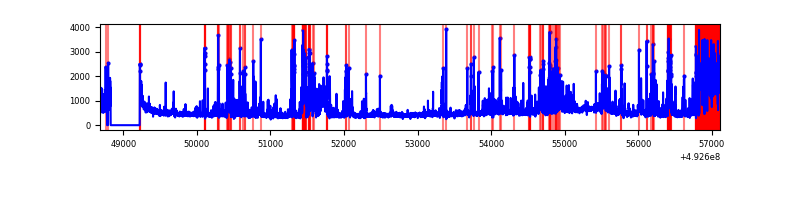 |
| B | 8433 | 8025 | 479 | 479 | 5.68% | 5.97% | 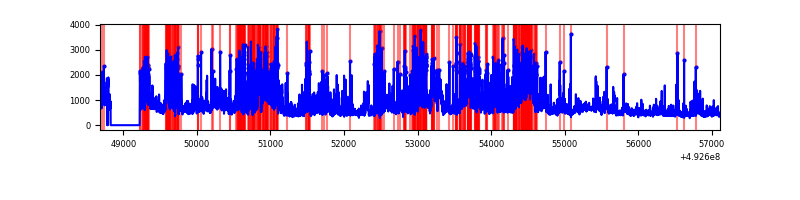 |
| C | 8433 | 8025 | 1286 | 1286 | 15.25% | 16.02% | 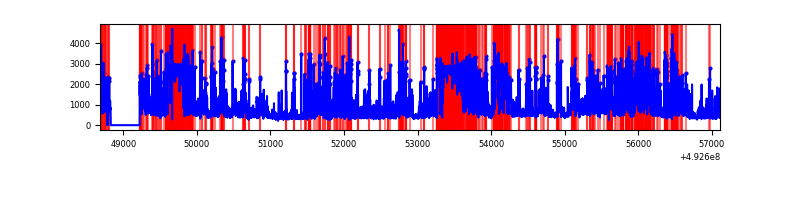 |
| D | 8433 | 8025 | 182 | 182 | 2.16% | 2.27% | 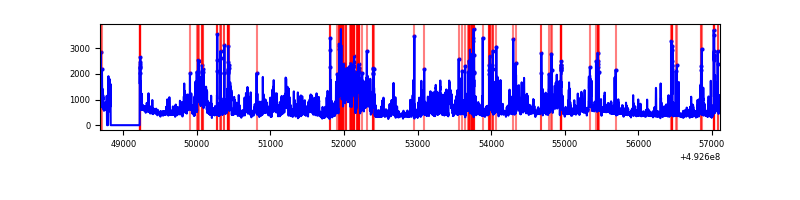 |
Top three noisy pixels from each quadrant. If the there are fewer than three noisy pixels in the level2.evt file, extra rows are filled as -1
| Pixel properties | Quadrant properties | ||||||
|---|---|---|---|---|---|---|---|
| Quadrant | DetID | PixID | Counts | Sigma | Mean | Median | Sigma |
| A | 15 | 174 | 446810 | 2174.35 | 828 | 808 | 205.1 |
| A | 7 | 191 | 445501 | 2167.97 | 828 | 808 | 205.1 |
| A | 7 | 190 | 391479 | 1904.6 | 828 | 808 | 205.1 |
| B | 4 | 171 | 1311717 | 7461.04 | 828 | 797 | 175.7 |
| B | 2 | 249 | 997606 | 5673.29 | 828 | 797 | 175.7 |
| B | 4 | 206 | 389563 | 2212.64 | 828 | 797 | 175.7 |
| C | 15 | 224 | 2285079 | 10911.08 | 760 | 752 | 209.4 |
| C | 1 | 241 | 2181984 | 10418.65 | 760 | 752 | 209.4 |
| C | 15 | 178 | 343787 | 1638.51 | 760 | 752 | 209.4 |
| D | 0 | 18 | 1431355 | 6097.35 | 826 | 790 | 234.6 |
| D | 3 | 12 | 246878 | 1048.88 | 826 | 790 | 234.6 |
| D | 2 | 153 | 229302 | 973.96 | 826 | 790 | 234.6 |
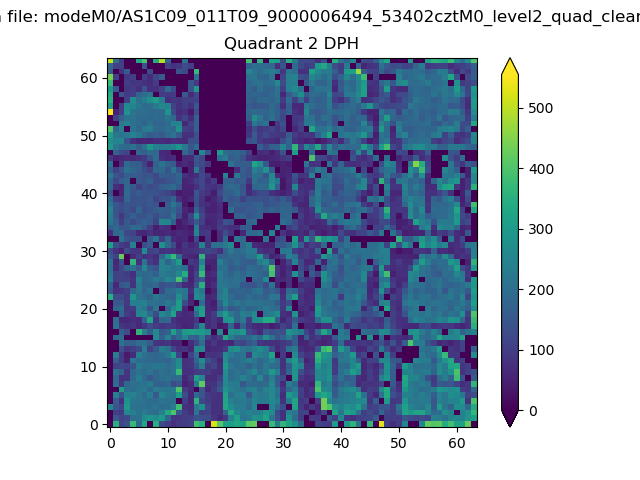
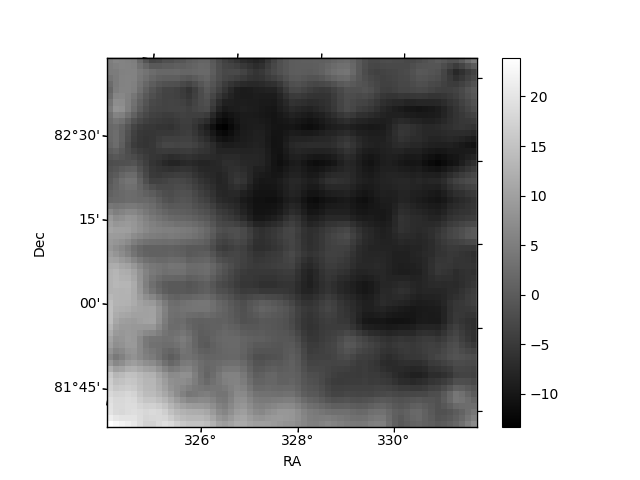
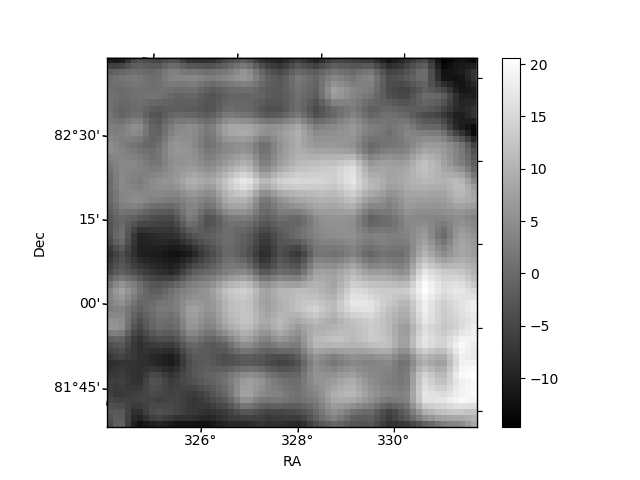
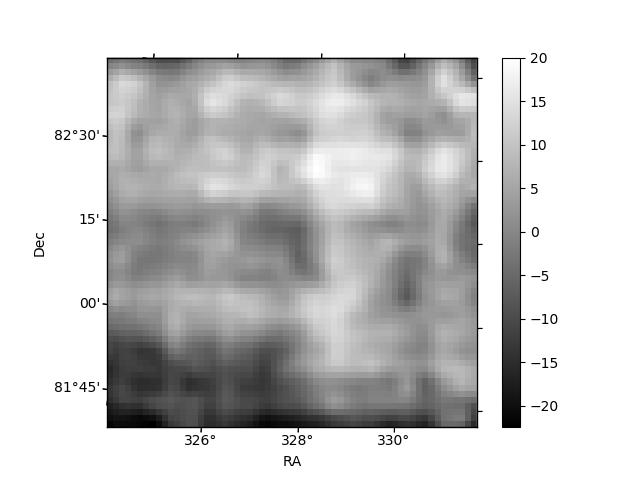
Histogram calculated using DETX and DETY for each event in the final _common_clean file
| Quadrant A | 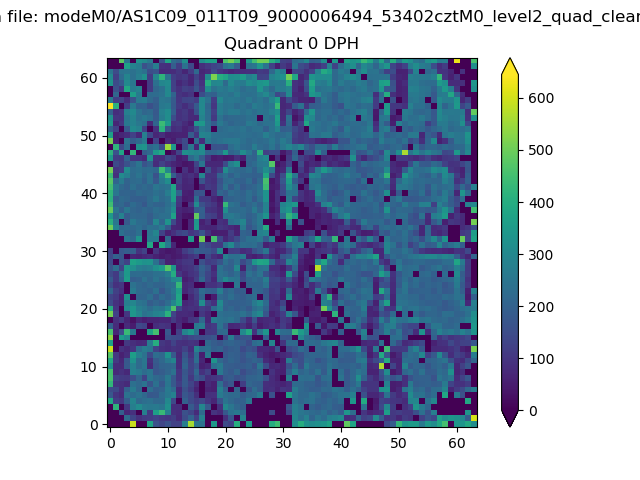 |
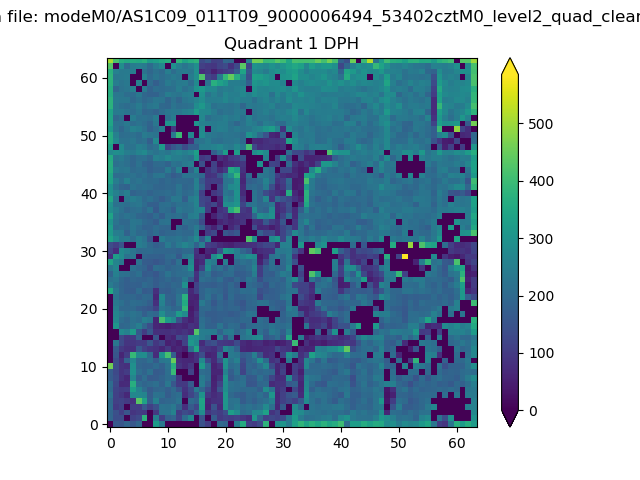 |
Quadrant B |
|---|---|---|---|
| Quadrant D | 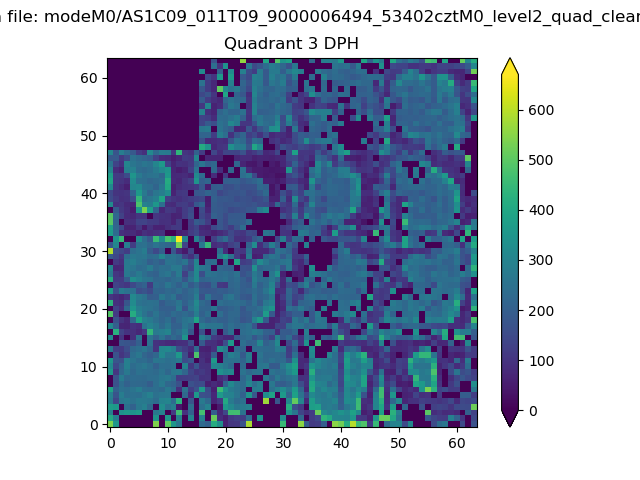 |
 |
Quadrant C |
| Plot type | Count rate plots | Images |
|---|---|---|
| Comparison with Poisson distribution Blue bars denote a histogram of data divided into 1 sec bins. Red curve is a Poisson curve with rate = median count rate of data. |
 |
 |
| Quadrant-wise count rates Data is divided into 100 sec bins |
 |
|
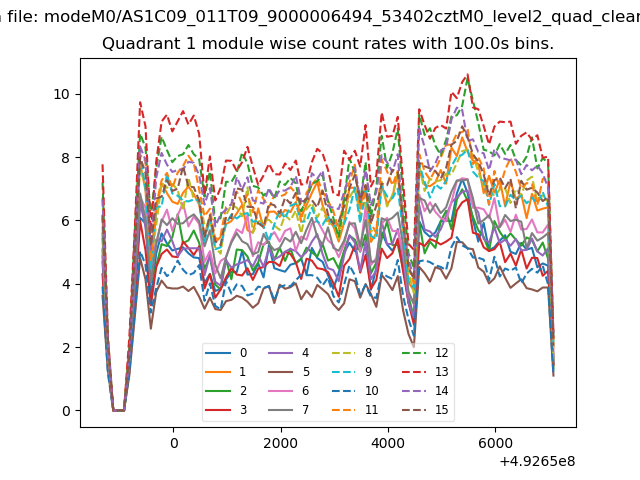
| Module-wise count rates for Quadrant A Data is divided into 100 sec bins |
 |
 |
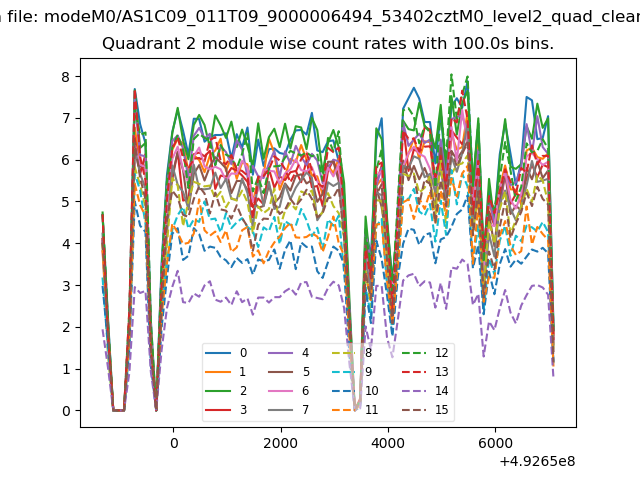
| Module-wise count rates for Quadrant B Data is divided into 100 sec bins |
 |
 |
| Module-wise count rates for Quadrant C Data is divided into 100 sec bins |
 |
 |
| Module-wise count rates for Quadrant D Data is divided into 100 sec bins |
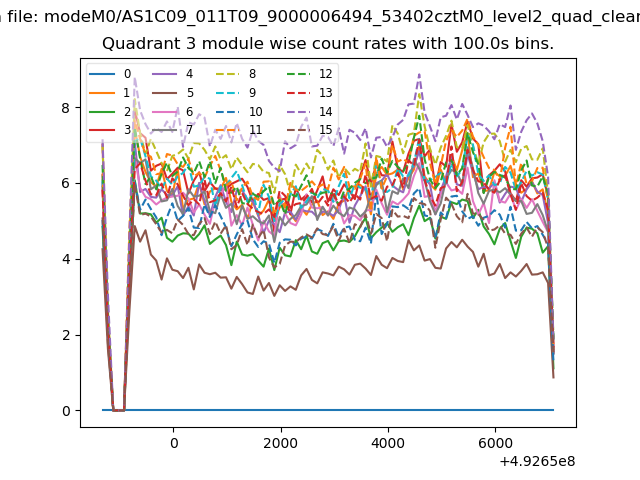 |
 |
| Parameter | Plot |
|---|---|
| CZT HV Monitor | 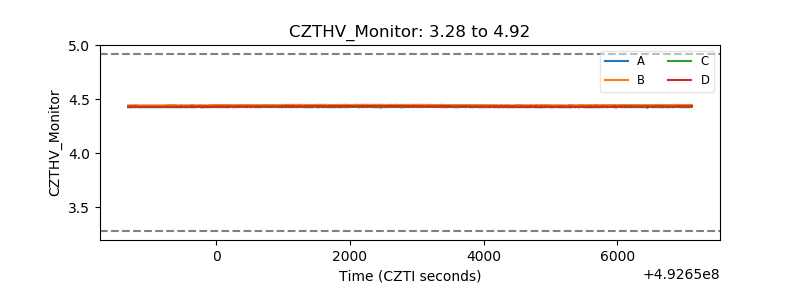 |
| D_VDD | 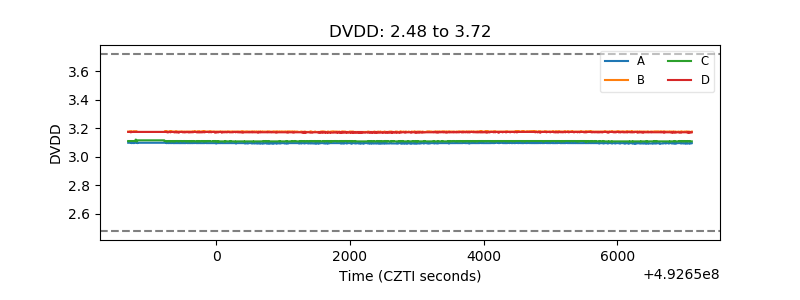 |
| Temperature 1 | 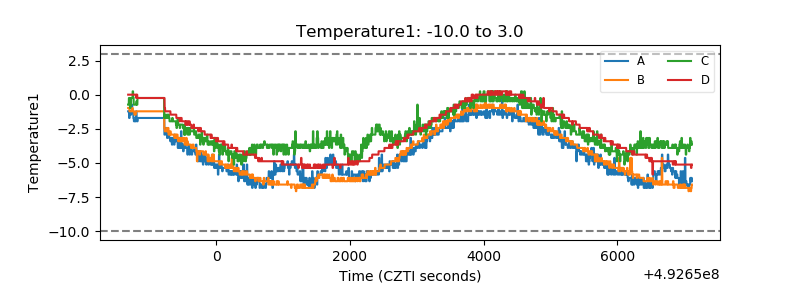 |
| Veto HV Monitor | 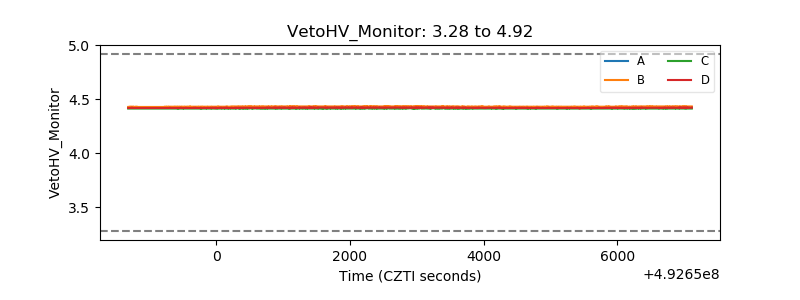 |
| Veto LLD | 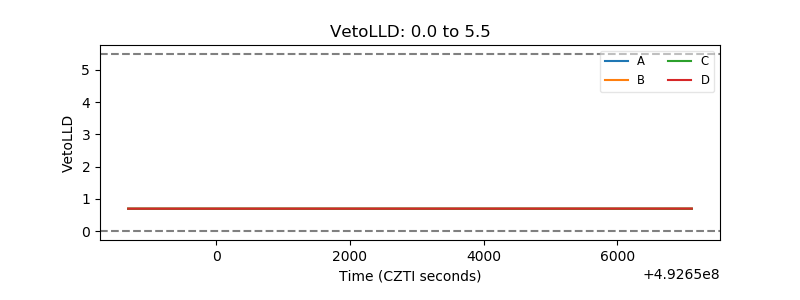 |
| Alpha Counter |  |
| _CPM_Rate | 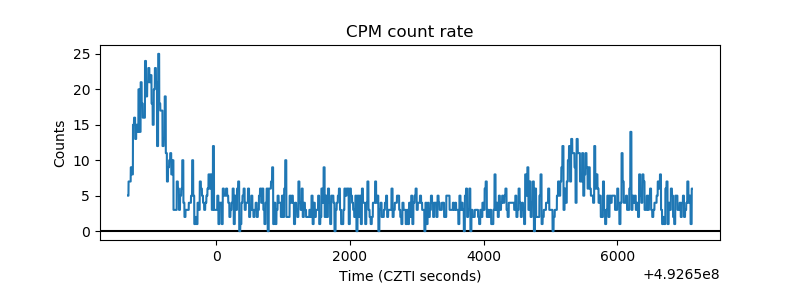 |
| CZT Counter | 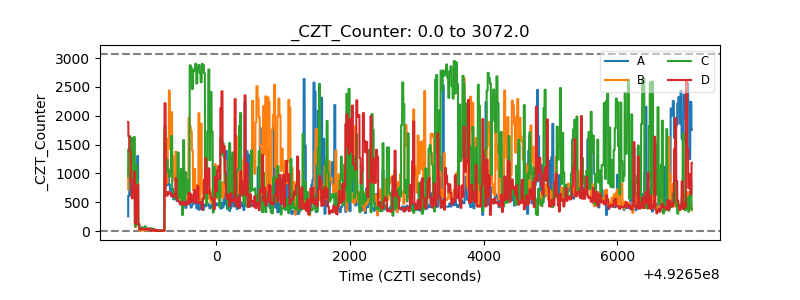 |
| +2.5 Volts monitor | 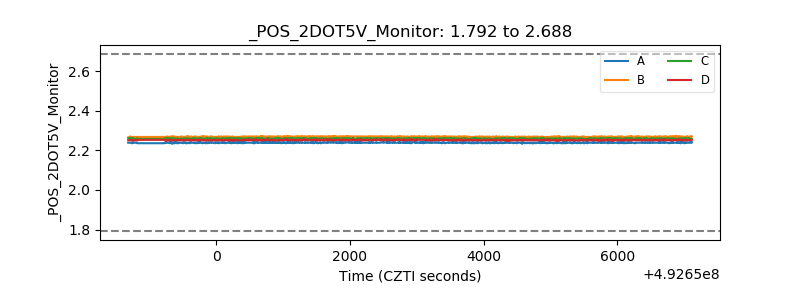 |
| +5 Volts monitor | 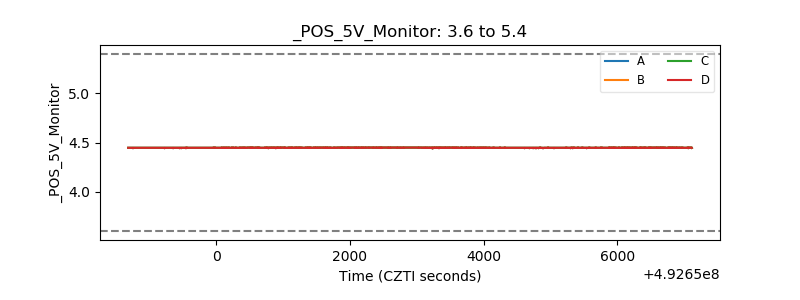 |
| _ROLL_ROT | 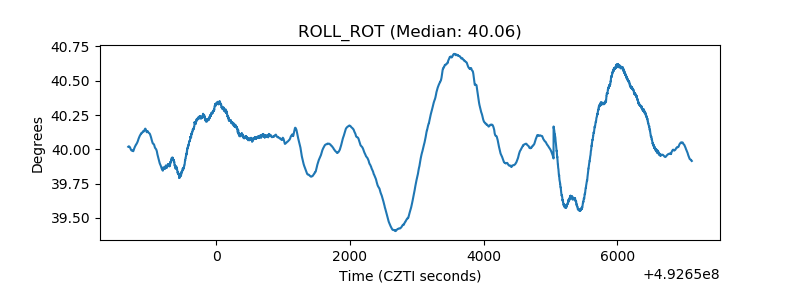 |
| _Roll_DEC | 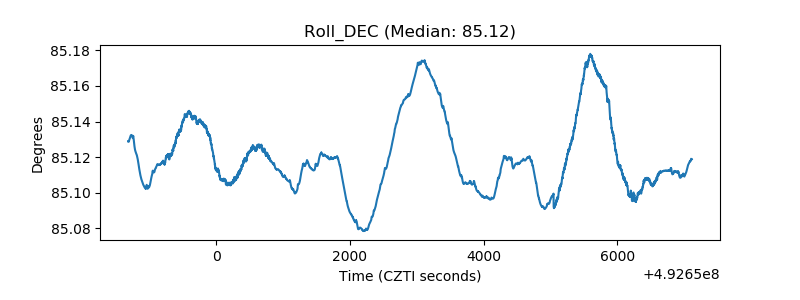 |
| _Roll_RA | 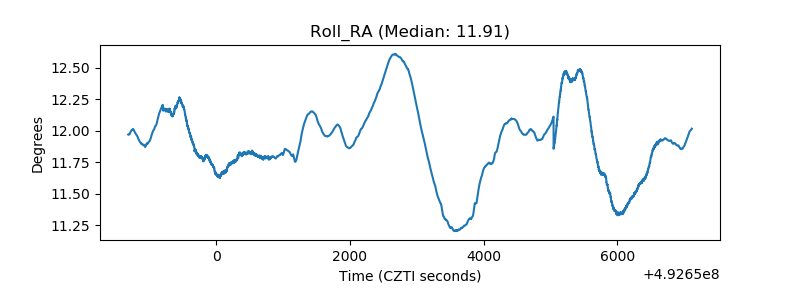 |
| Veto Counter | 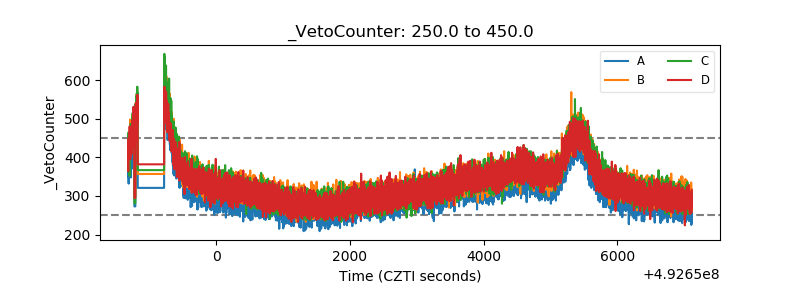 |